|
|
市場調査レポート
商品コード
1583991
複合鉄筋の世界市場 (2024~2028年)Global Composite Rebar Market 2024-2028 |
||||||

|
|||||||
カスタマイズ可能
|
|||||||


| 複合鉄筋の世界市場 (2024~2028年) |
|
出版日: 2024年09月04日
発行: TechNavio
ページ情報: 英文 166 Pages
納期: 即納可能
|

全表示
- 概要
- 図表
- 目次
複合鉄筋市場は2023年から2028年に3億3,430万米ドル分拡大し、予測期間中に9.59%のCAGRで成長すると予測されます。
当レポートでは、複合鉄筋市場の全体的な分析、市場規模・予測、動向、成長促進要因、課題、約25社のベンダーを網羅したベンダー分析などを掲載しています。
当レポートでは、現在の市場シナリオ、最新動向と促進要因、市場環境全体に関する最新分析を提供しています。当市場は、インフラに対する政府支出の増加、世界の商業施設・住宅の建設増加、自動車産業における炭素繊維強化ポリマー鉄筋の採用によって牽引されています。
| 市場範囲 | |
|---|---|
| 基準年 | 2024年 |
| 終了年 | 2028年 |
| 予測期間 | 2024~2028年 |
| 成長モメンタム | 加速 |
| 前年比 (2024年) | 8.84% |
| CAGR | 9.59% |
| 増分額 | 3億3,430万米ドル |
当レポートでは、今後数年間の複合鉄筋市場の成長を促進する主な理由の一つとして、軽量材料の人気拡大を挙げています。また、構造物のリフォーム需要の増加や複合鉄筋の技術革新が市場の大きな需要につながります。
目次
第1章 エグゼクティブサマリー
- 市場概要
第2章 市場情勢
- 市場エコシステム
- 市場の特徴
- バリューチェーン分析
第3章 市場規模の評価
- 市場の定義
- 市場セグメント分析
- 市場規模 (2023年)
- 市場の見通し (2023~2028年)
第4章 市場規模実績
- 複合鉄筋の世界市場 (2018~2022年)
- エンドユーザー別分析 (2018~2022年)
- 種類別分析 (2018~2022年)
- 地域別分析 (2018~2022年)
- 国別分析 (2018~2022年)
第5章 ファイブフォース分析
- ファイブフォースの要約
- 買い手の交渉力
- 供給企業の交渉力
- 新規参入業者の脅威
- 代替品の脅威
- 競争の脅威
- 市況
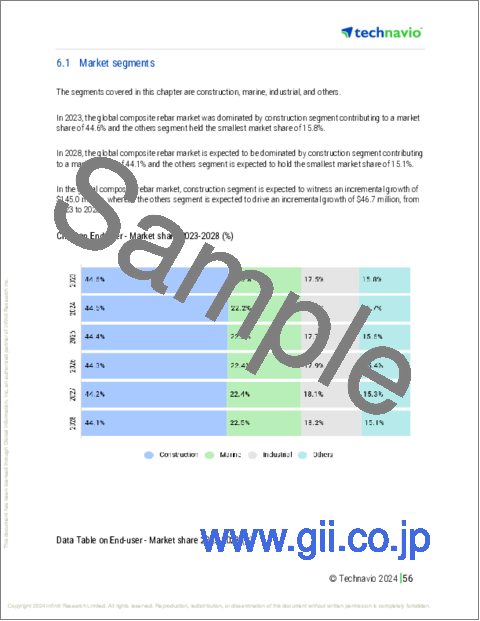
第6章 エンドユーザー別市場セグメンテーション
- 市場セグメンテーション
- 比較:エンドユーザー別
- 建設:市場規模と予測 (2023~2028年)
- 海洋:市場規模と予測 (2023~2028年)
- 工業:市場規模と予測 (2023~2028年)
- その他:市場規模と予測 (2023~2028年)
- エンドユーザー別の市場機会
第7章 種類別市場セグメンテーション
- 市場セグメンテーション
- 比較:種類別
- ガラス繊維:市場規模と予測 (2023~2028年)
- 炭素繊維:市場規模と予測 (2023~2028年)
- バサルト繊維:市場規模と予測 (2023~2028年)
- 種類別の市場機会
第8章 顧客情勢
- 顧客情勢の概要
第9章 地域別情勢
- 地域別セグメンテーション
- 地域別比較
- 北米:市場規模と予測 (2023~2028年)
- 欧州:市場規模と予測 (2023~2028年)
- アジア太平洋:市場規模と予測 (2023~2028年)
- 南米:市場規模と予測 (2023~2028年)
- 中東・アフリカ:市場規模と予測 (2023~2028年)
- 米国:市場規模と予測 (2023~2028年)
- 中国:市場規模と予測 (2023~2028年)
- ドイツ:市場規模と予測 (2023~2028年)
- 英国:市場規模と予測 (2023~2028年)
- フランス:市場規模と予測 (2023~2028年)
- 地域別の市場機会
第10章 促進要因・課題・機会・抑制要因
- 市場促進要因
- 市場の課題
- 促進要因と課題の影響
- 市場の機会・抑制要因
第11章 競合情勢
- 概要
- 競合情勢
- 混乱の状況
- 業界のリスク
第12章 競合分析
- 企業プロファイル
- 企業の市場ポジショニング
- ALP Supply
- Armastek
- Composite Group Chelyabinsk LLC
- FiReP Rebar Technology GmbH
- Galen LLC
- Hubei Yulong group Jinli New Material Co. Ltd.
- Kodiak Fiberglass Rebar
- Marshall Composite Technology LLC
- Mateenbar Ltd.
- MRG Composites India Pvt. Ltd.
- Nanjing Fenghui Composite Material Co. Ltd.
- Owens Corning
- Pultron Composites Ltd.
- Schock Bauteile GmbH
- SFTec LLC
第13章 付録
Exhibits:
- Exhibits1: Executive Summary - Chart on Market Overview
- Exhibits2: Executive Summary - Data Table on Market Overview
- Exhibits3: Executive Summary - Chart on Global Market Characteristics
- Exhibits4: Executive Summary - Chart on Market By Geographical Landscape
- Exhibits5: Executive Summary - Chart on Market Segmentation by End-user
- Exhibits6: Executive Summary - Chart on Market Segmentation by Type
- Exhibits7: Executive Summary - Chart on Incremental Growth
- Exhibits8: Executive Summary - Data Table on Incremental Growth
- Exhibits9: Executive Summary - Chart on Company Market Positioning
- Exhibits10: Parent Market
- Exhibits11: Data Table on - Parent Market
- Exhibits12: Market characteristics analysis
- Exhibits13: Value Chain Analysis
- Exhibits14: Offerings of companies included in the market definition
- Exhibits15: Market segments
- Exhibits16: Chart on Global - Market size and forecast 2023-2028 ($ million)
- Exhibits17: Data Table on Global - Market size and forecast 2023-2028 ($ million)
- Exhibits18: Chart on Global Market: Year-over-year growth 2023-2028 (%)
- Exhibits19: Data Table on Global Market: Year-over-year growth 2023-2028 (%)
- Exhibits20: Historic Market Size - Data Table on Global Composite Rebar Market 2018 - 2022 ($ million)
- Exhibits21: Historic Market Size - End-user Segment 2018 - 2022 ($ million)
- Exhibits22: Historic Market Size - Type Segment 2018 - 2022 ($ million)
- Exhibits23: Historic Market Size - Geography Segment 2018 - 2022 ($ million)
- Exhibits24: Historic Market Size - Country Segment 2018 - 2022 ($ million)
- Exhibits25: Five forces analysis - Comparison between 2023 and 2028
- Exhibits26: Bargaining power of buyers - Impact of key factors 2023 and 2028
- Exhibits27: Bargaining power of suppliers - Impact of key factors in 2023 and 2028
- Exhibits28: Threat of new entrants - Impact of key factors in 2023 and 2028
- Exhibits29: Threat of substitutes - Impact of key factors in 2023 and 2028
- Exhibits30: Threat of rivalry - Impact of key factors in 2023 and 2028
- Exhibits31: Chart on Market condition - Five forces 2023 and 2028
- Exhibits32: Chart on End-user - Market share 2023-2028 (%)
- Exhibits33: Data Table on End-user - Market share 2023-2028 (%)
- Exhibits34: Chart on Comparison by End-user
- Exhibits35: Data Table on Comparison by End-user
- Exhibits36: Chart on Construction - Market size and forecast 2023-2028 ($ million)
- Exhibits37: Data Table on Construction - Market size and forecast 2023-2028 ($ million)
- Exhibits38: Chart on Construction - Year-over-year growth 2023-2028 (%)
- Exhibits39: Data Table on Construction - Year-over-year growth 2023-2028 (%)
- Exhibits40: Chart on Marine - Market size and forecast 2023-2028 ($ million)
- Exhibits41: Data Table on Marine - Market size and forecast 2023-2028 ($ million)
- Exhibits42: Chart on Marine - Year-over-year growth 2023-2028 (%)
- Exhibits43: Data Table on Marine - Year-over-year growth 2023-2028 (%)
- Exhibits44: Chart on Industrial - Market size and forecast 2023-2028 ($ million)
- Exhibits45: Data Table on Industrial - Market size and forecast 2023-2028 ($ million)
- Exhibits46: Chart on Industrial - Year-over-year growth 2023-2028 (%)
- Exhibits47: Data Table on Industrial - Year-over-year growth 2023-2028 (%)
- Exhibits48: Chart on Others - Market size and forecast 2023-2028 ($ million)
- Exhibits49: Data Table on Others - Market size and forecast 2023-2028 ($ million)
- Exhibits50: Chart on Others - Year-over-year growth 2023-2028 (%)
- Exhibits51: Data Table on Others - Year-over-year growth 2023-2028 (%)
- Exhibits52: Market opportunity by End-user ($ million)
- Exhibits53: Data Table on Market opportunity by End-user ($ million)
- Exhibits54: Chart on Type - Market share 2023-2028 (%)
- Exhibits55: Data Table on Type - Market share 2023-2028 (%)
- Exhibits56: Chart on Comparison by Type
- Exhibits57: Data Table on Comparison by Type
- Exhibits58: Chart on Glass fiber - Market size and forecast 2023-2028 ($ million)
- Exhibits59: Data Table on Glass fiber - Market size and forecast 2023-2028 ($ million)
- Exhibits60: Chart on Glass fiber - Year-over-year growth 2023-2028 (%)
- Exhibits61: Data Table on Glass fiber - Year-over-year growth 2023-2028 (%)
- Exhibits62: Chart on Carbon fiber - Market size and forecast 2023-2028 ($ million)
- Exhibits63: Data Table on Carbon fiber - Market size and forecast 2023-2028 ($ million)
- Exhibits64: Chart on Carbon fiber - Year-over-year growth 2023-2028 (%)
- Exhibits65: Data Table on Carbon fiber - Year-over-year growth 2023-2028 (%)
- Exhibits66: Chart on Basalt fiber - Market size and forecast 2023-2028 ($ million)
- Exhibits67: Data Table on Basalt fiber - Market size and forecast 2023-2028 ($ million)
- Exhibits68: Chart on Basalt fiber - Year-over-year growth 2023-2028 (%)
- Exhibits69: Data Table on Basalt fiber - Year-over-year growth 2023-2028 (%)
- Exhibits70: Market opportunity by Type ($ million)
- Exhibits71: Data Table on Market opportunity by Type ($ million)
- Exhibits72: Analysis of price sensitivity, lifecycle, customer purchase basket, adoption rates, and purchase criteria
- Exhibits73: Chart on Market share By Geographical Landscape 2023-2028 (%)
- Exhibits74: Data Table on Market share By Geographical Landscape 2023-2028 (%)
- Exhibits75: Chart on Geographic comparison
- Exhibits76: Data Table on Geographic comparison
- Exhibits77: Chart on North America - Market size and forecast 2023-2028 ($ million)
- Exhibits78: Data Table on North America - Market size and forecast 2023-2028 ($ million)
- Exhibits79: Chart on North America - Year-over-year growth 2023-2028 (%)
- Exhibits80: Data Table on North America - Year-over-year growth 2023-2028 (%)
- Exhibits81: Chart on Europe - Market size and forecast 2023-2028 ($ million)
- Exhibits82: Data Table on Europe - Market size and forecast 2023-2028 ($ million)
- Exhibits83: Chart on Europe - Year-over-year growth 2023-2028 (%)
- Exhibits84: Data Table on Europe - Year-over-year growth 2023-2028 (%)
- Exhibits85: Chart on APAC - Market size and forecast 2023-2028 ($ million)
- Exhibits86: Data Table on APAC - Market size and forecast 2023-2028 ($ million)
- Exhibits87: Chart on APAC - Year-over-year growth 2023-2028 (%)
- Exhibits88: Data Table on APAC - Year-over-year growth 2023-2028 (%)
- Exhibits89: Chart on South America - Market size and forecast 2023-2028 ($ million)
- Exhibits90: Data Table on South America - Market size and forecast 2023-2028 ($ million)
- Exhibits91: Chart on South America - Year-over-year growth 2023-2028 (%)
- Exhibits92: Data Table on South America - Year-over-year growth 2023-2028 (%)
- Exhibits93: Chart on Middle East and Africa - Market size and forecast 2023-2028 ($ million)
- Exhibits94: Data Table on Middle East and Africa - Market size and forecast 2023-2028 ($ million)
- Exhibits95: Chart on Middle East and Africa - Year-over-year growth 2023-2028 (%)
- Exhibits96: Data Table on Middle East and Africa - Year-over-year growth 2023-2028 (%)
- Exhibits97: Chart on US - Market size and forecast 2023-2028 ($ million)
- Exhibits98: Data Table on US - Market size and forecast 2023-2028 ($ million)
- Exhibits99: Chart on US - Year-over-year growth 2023-2028 (%)
- Exhibits100: Data Table on US - Year-over-year growth 2023-2028 (%)
- Exhibits101: Chart on China - Market size and forecast 2023-2028 ($ million)
- Exhibits102: Data Table on China - Market size and forecast 2023-2028 ($ million)
- Exhibits103: Chart on China - Year-over-year growth 2023-2028 (%)
- Exhibits104: Data Table on China - Year-over-year growth 2023-2028 (%)
- Exhibits105: Chart on Germany - Market size and forecast 2023-2028 ($ million)
- Exhibits106: Data Table on Germany - Market size and forecast 2023-2028 ($ million)
- Exhibits107: Chart on Germany - Year-over-year growth 2023-2028 (%)
- Exhibits108: Data Table on Germany - Year-over-year growth 2023-2028 (%)
- Exhibits109: Chart on UK - Market size and forecast 2023-2028 ($ million)
- Exhibits110: Data Table on UK - Market size and forecast 2023-2028 ($ million)
- Exhibits111: Chart on UK - Year-over-year growth 2023-2028 (%)
- Exhibits112: Data Table on UK - Year-over-year growth 2023-2028 (%)
- Exhibits113: Chart on France - Market size and forecast 2023-2028 ($ million)
- Exhibits114: Data Table on France - Market size and forecast 2023-2028 ($ million)
- Exhibits115: Chart on France - Year-over-year growth 2023-2028 (%)
- Exhibits116: Data Table on France - Year-over-year growth 2023-2028 (%)
- Exhibits117: Market opportunity By Geographical Landscape ($ million)
- Exhibits118: Data Tables on Market opportunity By Geographical Landscape ($ million)
- Exhibits119: Impact of drivers and challenges in 2023 and 2028
- Exhibits120: Overview on criticality of inputs and factors of differentiation
- Exhibits121: Overview on factors of disruption
- Exhibits122: Impact of key risks on business
- Exhibits123: Companies covered
- Exhibits124: Matrix on companies position and classification
- Exhibits125: ALP Supply - Overview
- Exhibits126: ALP Supply - Product / Service
- Exhibits127: ALP Supply - Key offerings
- Exhibits128: Armastek - Overview
- Exhibits129: Armastek - Product / Service
- Exhibits130: Armastek - Key offerings
- Exhibits131: Composite Group Chelyabinsk LLC - Overview
- Exhibits132: Composite Group Chelyabinsk LLC - Product / Service
- Exhibits133: Composite Group Chelyabinsk LLC - Key offerings
- Exhibits134: FiReP Rebar Technology GmbH - Overview
- Exhibits135: FiReP Rebar Technology GmbH - Product / Service
- Exhibits136: FiReP Rebar Technology GmbH - Key offerings
- Exhibits137: Galen LLC - Overview
- Exhibits138: Galen LLC - Product / Service
- Exhibits139: Galen LLC - Key offerings
- Exhibits140: Hubei Yulong group Jinli New Material Co. Ltd. - Overview
- Exhibits141: Hubei Yulong group Jinli New Material Co. Ltd. - Product / Service
- Exhibits142: Hubei Yulong group Jinli New Material Co. Ltd. - Key offerings
- Exhibits143: Kodiak Fiberglass Rebar - Overview
- Exhibits144: Kodiak Fiberglass Rebar - Product / Service
- Exhibits145: Kodiak Fiberglass Rebar - Key offerings
- Exhibits146: Marshall Composite Technology LLC - Overview
- Exhibits147: Marshall Composite Technology LLC - Product / Service
- Exhibits148: Marshall Composite Technology LLC - Key offerings
- Exhibits149: Mateenbar Ltd. - Overview
- Exhibits150: Mateenbar Ltd. - Product / Service
- Exhibits151: Mateenbar Ltd. - Key offerings
- Exhibits152: MRG Composites India Pvt. Ltd. - Overview
- Exhibits153: MRG Composites India Pvt. Ltd. - Product / Service
- Exhibits154: MRG Composites India Pvt. Ltd. - Key offerings
- Exhibits155: Nanjing Fenghui Composite Material Co. Ltd. - Overview
- Exhibits156: Nanjing Fenghui Composite Material Co. Ltd. - Product / Service
- Exhibits157: Nanjing Fenghui Composite Material Co. Ltd. - Key offerings
- Exhibits158: Owens Corning - Overview
- Exhibits159: Owens Corning - Business segments
- Exhibits160: Owens Corning - Key news
- Exhibits161: Owens Corning - Key offerings
- Exhibits162: Owens Corning - Segment focus
- Exhibits163: Pultron Composites Ltd. - Overview
- Exhibits164: Pultron Composites Ltd. - Product / Service
- Exhibits165: Pultron Composites Ltd. - Key offerings
- Exhibits166: Schock Bauteile GmbH - Overview
- Exhibits167: Schock Bauteile GmbH - Product / Service
- Exhibits168: Schock Bauteile GmbH - Key offerings
- Exhibits169: SFTec LLC - Overview
- Exhibits170: SFTec LLC - Product / Service
- Exhibits171: SFTec LLC - Key offerings
- Exhibits172: Inclusions checklist
- Exhibits173: Exclusions checklist
- Exhibits174: Currency conversion rates for US$
- Exhibits175: Research methodology
- Exhibits176: Information sources
- Exhibits177: Data validation
- Exhibits178: Validation techniques employed for market sizing
- Exhibits179: Data synthesis
- Exhibits180: 360 degree market analysis
- Exhibits181: List of abbreviations
The composite rebar market is forecasted to grow by USD 334.3 mn during 2023-2028, accelerating at a CAGR of 9.59% during the forecast period. The report on the composite rebar market provides a holistic analysis, market size and forecast, trends, growth drivers, and challenges, as well as vendor analysis covering around 25 vendors.
The report offers an up-to-date analysis regarding the current market scenario, the latest trends and drivers, and the overall market environment. The market is driven by increased government spending on infrastructure, growing global commercial and residential construction, and adoption of carbon fiber-reinforced polymer rebar in automotive industry.
Technavio's composite rebar market is segmented as below:
| Market Scope | |
|---|---|
| Base Year | 2024 |
| End Year | 2028 |
| Series Year | 2024-2028 |
| Growth Momentum | Accelerate |
| YOY 2024 | 8.84% |
| CAGR | 9.59% |
| Incremental Value | $334.3 mn |
By End-user
- Construction
- Marine
- Industrial
- Others
By Type
- Glass fiber
- Carbon fiber
- Basalt fiber
By Geographical Landscape
- North America
- Europe
- APAC
- South America
- Middle East and Africa
This study identifies the rising preference for lightweight materials as one of the prime reasons driving the composite rebar market growth during the next few years. Also, increase in demand for remodeling structures and technological innovations in composite rebars will lead to sizable demand in the market.
The report on the composite rebar market covers the following areas:
- Composite rebar market sizing
- Composite rebar market forecast
- Composite rebar market industry analysis
The robust vendor analysis is designed to help clients improve their market position, and in line with this, this report provides a detailed analysis of several leading composite rebar market vendors that include ALP Supply, Armastek, Composite Group Chelyabinsk LLC, Everest Composites Pvt. Ltd., FiReP Rebar Technology GmbH, Galen LLC, Hubei Yulong group Jinli New Material Co. Ltd., Kodiak Fiberglass Rebar, Marshall Composite Technology LLC, Mateenbar Ltd., MRG Composites India Pvt. Ltd., Nanjing Fenghui Composite Material Co. Ltd., Owens Corning, Pultron Composites Ltd., Schock Bauteile GmbH, SFTec LLC, Sireg Geotech Srl, Technobasalt Invest LLC, Tribeni Fiber Pvt Ltd., and TUF BAR Inc.. Also, the composite rebar market analysis report includes information on upcoming trends and challenges that will influence market growth. This is to help companies strategize and leverage all forthcoming growth opportunities.
The study was conducted using an objective combination of primary and secondary information including inputs from key participants in the industry. The report contains a comprehensive market and vendor landscape in addition to an analysis of the key vendors.
The publisher presents a detailed picture of the market by the way of study, synthesis, and summation of data from multiple sources by an analysis of key parameters such as profit, pricing, competition, and promotions. It presents various market facets by identifying the key industry influencers. The data presented is comprehensive, reliable, and a result of extensive research - both primary and secondary. The market research reports provide a complete competitive landscape and an in-depth vendor selection methodology and analysis using qualitative and quantitative research to forecast the accurate market growth.
Table of Contents
1 Executive Summary
- 1.1 Market overview
- Executive Summary - Chart on Market Overview
- Executive Summary - Data Table on Market Overview
- Executive Summary - Chart on Global Market Characteristics
- Executive Summary - Chart on Market By Geographical Landscape
- Executive Summary - Chart on Market Segmentation by End-user
- Executive Summary - Chart on Market Segmentation by Type
- Executive Summary - Chart on Incremental Growth
- Executive Summary - Data Table on Incremental Growth
- Executive Summary - Chart on Company Market Positioning
2 Market Landscape
- 2.1 Market ecosystem
- Parent Market
- Data Table on - Parent Market
- 2.2 Market characteristics
- Market characteristics analysis
- 2.3 Value chain analysis
- Value Chain Analysis
3 Market Sizing
- 3.1 Market definition
- Offerings of companies included in the market definition
- 3.2 Market segment analysis
- Market segments
- 3.3 Market size 2023
- 3.4 Market outlook: Forecast for 2023-2028
- Chart on Global - Market size and forecast 2023-2028 ($ million)
- Data Table on Global - Market size and forecast 2023-2028 ($ million)
- Chart on Global Market: Year-over-year growth 2023-2028 (%)
- Data Table on Global Market: Year-over-year growth 2023-2028 (%)
4 Historic Market Size
- 4.1 Global Composite Rebar Market 2018 - 2022
- Historic Market Size - Data Table on Global Composite Rebar Market 2018 - 2022 ($ million)
- 4.2 End-user segment analysis 2018 - 2022
- Historic Market Size - End-user Segment 2018 - 2022 ($ million)
- 4.3 Type segment analysis 2018 - 2022
- Historic Market Size - Type Segment 2018 - 2022 ($ million)
- 4.4 Geography segment analysis 2018 - 2022
- Historic Market Size - Geography Segment 2018 - 2022 ($ million)
- 4.5 Country segment analysis 2018 - 2022
- Historic Market Size - Country Segment 2018 - 2022 ($ million)
5 Five Forces Analysis
- 5.1 Five forces summary
- Five forces analysis - Comparison between 2023 and 2028
- 5.2 Bargaining power of buyers
- Bargaining power of buyers - Impact of key factors 2023 and 2028
- 5.3 Bargaining power of suppliers
- Bargaining power of suppliers - Impact of key factors in 2023 and 2028
- 5.4 Threat of new entrants
- Threat of new entrants - Impact of key factors in 2023 and 2028
- 5.5 Threat of substitutes
- Threat of substitutes - Impact of key factors in 2023 and 2028
- 5.6 Threat of rivalry
- Threat of rivalry - Impact of key factors in 2023 and 2028
- 5.7 Market condition
- Chart on Market condition - Five forces 2023 and 2028
6 Market Segmentation by End-user
- 6.1 Market segments
- Chart on End-user - Market share 2023-2028 (%)
- Data Table on End-user - Market share 2023-2028 (%)
- 6.2 Comparison by End-user
- Chart on Comparison by End-user
- Data Table on Comparison by End-user
- 6.3 Construction - Market size and forecast 2023-2028
- Chart on Construction - Market size and forecast 2023-2028 ($ million)
- Data Table on Construction - Market size and forecast 2023-2028 ($ million)
- Chart on Construction - Year-over-year growth 2023-2028 (%)
- Data Table on Construction - Year-over-year growth 2023-2028 (%)
- 6.4 Marine - Market size and forecast 2023-2028
- Chart on Marine - Market size and forecast 2023-2028 ($ million)
- Data Table on Marine - Market size and forecast 2023-2028 ($ million)
- Chart on Marine - Year-over-year growth 2023-2028 (%)
- Data Table on Marine - Year-over-year growth 2023-2028 (%)
- 6.5 Industrial - Market size and forecast 2023-2028
- Chart on Industrial - Market size and forecast 2023-2028 ($ million)
- Data Table on Industrial - Market size and forecast 2023-2028 ($ million)
- Chart on Industrial - Year-over-year growth 2023-2028 (%)
- Data Table on Industrial - Year-over-year growth 2023-2028 (%)
- 6.6 Others - Market size and forecast 2023-2028
- Chart on Others - Market size and forecast 2023-2028 ($ million)
- Data Table on Others - Market size and forecast 2023-2028 ($ million)
- Chart on Others - Year-over-year growth 2023-2028 (%)
- Data Table on Others - Year-over-year growth 2023-2028 (%)
- 6.7 Market opportunity by End-user
- Market opportunity by End-user ($ million)
- Data Table on Market opportunity by End-user ($ million)
7 Market Segmentation by Type
- 7.1 Market segments
- Chart on Type - Market share 2023-2028 (%)
- Data Table on Type - Market share 2023-2028 (%)
- 7.2 Comparison by Type
- Chart on Comparison by Type
- Data Table on Comparison by Type
- 7.3 Glass fiber - Market size and forecast 2023-2028
- Chart on Glass fiber - Market size and forecast 2023-2028 ($ million)
- Data Table on Glass fiber - Market size and forecast 2023-2028 ($ million)
- Chart on Glass fiber - Year-over-year growth 2023-2028 (%)
- Data Table on Glass fiber - Year-over-year growth 2023-2028 (%)
- 7.4 Carbon fiber - Market size and forecast 2023-2028
- Chart on Carbon fiber - Market size and forecast 2023-2028 ($ million)
- Data Table on Carbon fiber - Market size and forecast 2023-2028 ($ million)
- Chart on Carbon fiber - Year-over-year growth 2023-2028 (%)
- Data Table on Carbon fiber - Year-over-year growth 2023-2028 (%)
- 7.5 Basalt fiber - Market size and forecast 2023-2028
- Chart on Basalt fiber - Market size and forecast 2023-2028 ($ million)
- Data Table on Basalt fiber - Market size and forecast 2023-2028 ($ million)
- Chart on Basalt fiber - Year-over-year growth 2023-2028 (%)
- Data Table on Basalt fiber - Year-over-year growth 2023-2028 (%)
- 7.6 Market opportunity by Type
- Market opportunity by Type ($ million)
- Data Table on Market opportunity by Type ($ million)
8 Customer Landscape
- 8.1 Customer landscape overview
- Analysis of price sensitivity, lifecycle, customer purchase basket, adoption rates, and purchase criteria
9 Geographic Landscape
- 9.1 Geographic segmentation
- Chart on Market share By Geographical Landscape 2023-2028 (%)
- Data Table on Market share By Geographical Landscape 2023-2028 (%)
- 9.2 Geographic comparison
- Chart on Geographic comparison
- Data Table on Geographic comparison
- 9.3 North America - Market size and forecast 2023-2028
- Chart on North America - Market size and forecast 2023-2028 ($ million)
- Data Table on North America - Market size and forecast 2023-2028 ($ million)
- Chart on North America - Year-over-year growth 2023-2028 (%)
- Data Table on North America - Year-over-year growth 2023-2028 (%)
- 9.4 Europe - Market size and forecast 2023-2028
- Chart on Europe - Market size and forecast 2023-2028 ($ million)
- Data Table on Europe - Market size and forecast 2023-2028 ($ million)
- Chart on Europe - Year-over-year growth 2023-2028 (%)
- Data Table on Europe - Year-over-year growth 2023-2028 (%)
- 9.5 APAC - Market size and forecast 2023-2028
- Chart on APAC - Market size and forecast 2023-2028 ($ million)
- Data Table on APAC - Market size and forecast 2023-2028 ($ million)
- Chart on APAC - Year-over-year growth 2023-2028 (%)
- Data Table on APAC - Year-over-year growth 2023-2028 (%)
- 9.6 South America - Market size and forecast 2023-2028
- Chart on South America - Market size and forecast 2023-2028 ($ million)
- Data Table on South America - Market size and forecast 2023-2028 ($ million)
- Chart on South America - Year-over-year growth 2023-2028 (%)
- Data Table on South America - Year-over-year growth 2023-2028 (%)
- 9.7 Middle East and Africa - Market size and forecast 2023-2028
- Chart on Middle East and Africa - Market size and forecast 2023-2028 ($ million)
- Data Table on Middle East and Africa - Market size and forecast 2023-2028 ($ million)
- Chart on Middle East and Africa - Year-over-year growth 2023-2028 (%)
- Data Table on Middle East and Africa - Year-over-year growth 2023-2028 (%)
- 9.8 US - Market size and forecast 2023-2028
- Chart on US - Market size and forecast 2023-2028 ($ million)
- Data Table on US - Market size and forecast 2023-2028 ($ million)
- Chart on US - Year-over-year growth 2023-2028 (%)
- Data Table on US - Year-over-year growth 2023-2028 (%)
- 9.9 China - Market size and forecast 2023-2028
- Chart on China - Market size and forecast 2023-2028 ($ million)
- Data Table on China - Market size and forecast 2023-2028 ($ million)
- Chart on China - Year-over-year growth 2023-2028 (%)
- Data Table on China - Year-over-year growth 2023-2028 (%)
- 9.10 Germany - Market size and forecast 2023-2028
- Chart on Germany - Market size and forecast 2023-2028 ($ million)
- Data Table on Germany - Market size and forecast 2023-2028 ($ million)
- Chart on Germany - Year-over-year growth 2023-2028 (%)
- Data Table on Germany - Year-over-year growth 2023-2028 (%)
- 9.11 UK - Market size and forecast 2023-2028
- Chart on UK - Market size and forecast 2023-2028 ($ million)
- Data Table on UK - Market size and forecast 2023-2028 ($ million)
- Chart on UK - Year-over-year growth 2023-2028 (%)
- Data Table on UK - Year-over-year growth 2023-2028 (%)
- 9.12 France - Market size and forecast 2023-2028
- Chart on France - Market size and forecast 2023-2028 ($ million)
- Data Table on France - Market size and forecast 2023-2028 ($ million)
- Chart on France - Year-over-year growth 2023-2028 (%)
- Data Table on France - Year-over-year growth 2023-2028 (%)
- 9.13 Market opportunity By Geographical Landscape
- Market opportunity By Geographical Landscape ($ million)
- Data Tables on Market opportunity By Geographical Landscape ($ million)
10 Drivers, Challenges, and Opportunity/Restraints
- 10.1 Market drivers
- 10.2 Market challenges
- 10.3 Impact of drivers and challenges
- Impact of drivers and challenges in 2023 and 2028
- 10.4 Market opportunities/restraints
11 Competitive Landscape
- 11.1 Overview
- 11.2 Competitive Landscape
- Overview on criticality of inputs and factors of differentiation
- 11.3 Landscape disruption
- Overview on factors of disruption
- 11.4 Industry risks
- Impact of key risks on business
12 Competitive Analysis
- 12.1 Companies profiled
- Companies covered
- 12.2 Market positioning of companies
- Matrix on companies position and classification
- 12.3 ALP Supply
- ALP Supply - Overview
- ALP Supply - Product / Service
- ALP Supply - Key offerings
- 12.4 Armastek
- Armastek - Overview
- Armastek - Product / Service
- Armastek - Key offerings
- 12.5 Composite Group Chelyabinsk LLC
- Composite Group Chelyabinsk LLC - Overview
- Composite Group Chelyabinsk LLC - Product / Service
- Composite Group Chelyabinsk LLC - Key offerings
- 12.6 FiReP Rebar Technology GmbH
- FiReP Rebar Technology GmbH - Overview
- FiReP Rebar Technology GmbH - Product / Service
- FiReP Rebar Technology GmbH - Key offerings
- 12.7 Galen LLC
- Galen LLC - Overview
- Galen LLC - Product / Service
- Galen LLC - Key offerings
- 12.8 Hubei Yulong group Jinli New Material Co. Ltd.
- Hubei Yulong group Jinli New Material Co. Ltd. - Overview
- Hubei Yulong group Jinli New Material Co. Ltd. - Product / Service
- Hubei Yulong group Jinli New Material Co. Ltd. - Key offerings
- 12.9 Kodiak Fiberglass Rebar
- Kodiak Fiberglass Rebar - Overview
- Kodiak Fiberglass Rebar - Product / Service
- Kodiak Fiberglass Rebar - Key offerings
- 12.10 Marshall Composite Technology LLC
- Marshall Composite Technology LLC - Overview
- Marshall Composite Technology LLC - Product / Service
- Marshall Composite Technology LLC - Key offerings
- 12.11 Mateenbar Ltd.
- Mateenbar Ltd. - Overview
- Mateenbar Ltd. - Product / Service
- Mateenbar Ltd. - Key offerings
- 12.12 MRG Composites India Pvt. Ltd.
- MRG Composites India Pvt. Ltd. - Overview
- MRG Composites India Pvt. Ltd. - Product / Service
- MRG Composites India Pvt. Ltd. - Key offerings
- 12.13 Nanjing Fenghui Composite Material Co. Ltd.
- Nanjing Fenghui Composite Material Co. Ltd. - Overview
- Nanjing Fenghui Composite Material Co. Ltd. - Product / Service
- Nanjing Fenghui Composite Material Co. Ltd. - Key offerings
- 12.14 Owens Corning
- Owens Corning - Overview
- Owens Corning - Business segments
- Owens Corning - Key news
- Owens Corning - Key offerings
- Owens Corning - Segment focus
- 12.15 Pultron Composites Ltd.
- Pultron Composites Ltd. - Overview
- Pultron Composites Ltd. - Product / Service
- Pultron Composites Ltd. - Key offerings
- 12.16 Schock Bauteile GmbH
- Schock Bauteile GmbH - Overview
- Schock Bauteile GmbH - Product / Service
- Schock Bauteile GmbH - Key offerings
- 12.17 SFTec LLC
- SFTec LLC - Overview
- SFTec LLC - Product / Service
- SFTec LLC - Key offerings
13 Appendix
- 13.1 Scope of the report
- 13.2 Inclusions and exclusions checklist
- Inclusions checklist
- Exclusions checklist
- 13.3 Currency conversion rates for US$
- Currency conversion rates for US$
- 13.4 Research methodology
- Research methodology
- 13.5 Data procurement
- Information sources
- 13.6 Data validation
- Data validation
- 13.7 Validation techniques employed for market sizing
- Validation techniques employed for market sizing
- 13.8 Data synthesis
- Data synthesis
- 13.9 360 degree market analysis
- 360 degree market analysis
- 13.10 List of abbreviations
- List of abbreviations

