|
|
市場調査レポート
商品コード
1660835
サーフェスウォータースポーツ用品の世界市場 2025~2029年Global Surface Water Sports Equipment Market 2025-2029 |
||||||

|
|||||||
カスタマイズ可能
|
|||||||


| サーフェスウォータースポーツ用品の世界市場 2025~2029年 |
|
出版日: 2025年02月13日
発行: TechNavio
ページ情報: 英文 233 Pages
納期: 即納可能
|

全表示
- 概要
- 目次
サーフェスウォータースポーツ用品市場は2024-2029年に157億5,000万米ドル、予測期間中のCAGRは8.2%で成長すると予測されます。
当レポートでは、サーフェスウォータースポーツ用品市場の全体的な分析、市場規模・予測、動向、成長促進要因、課題、約25のベンダーを網羅したベンダー分析などを掲載しています。
現在の市場シナリオ、最新動向と促進要因、市場環境全体に関する最新分析を提供しています。世界のウォータースポーツ施設の増加、水上スポーツに伴うフィットネス効果、サーフェスウォータースポーツ用品のオンライン小売の成長などが市場を牽引しています。
| 市場範囲 | |
|---|---|
| 基準年 | 2025 |
| 終了年 | 2029 |
| 予測期間 | 2025-2029 |
| 成長モメンタム | 加速 |
| 前年比2025年 | 8.1% |
| CAGR | 8.2% |
| 増分額 | 157億5,000万米ドル |
本調査は、業界の主要参加者からのインプットを含め、一次情報と二次情報を客観的に組み合わせて実施しました。本レポートには、主要企業の分析に加え、包括的な市場規模データ、地域分析によるセグメント、ベンダー情勢が含まれています。レポートには過去データと予測データがあります。
本調査では、今後数年間のサーフェスウォータースポーツ用品市場成長を牽引する主要因の一つとして、人工水上スポーツ体験を挙げています。また、斬新なサーフェスウォータースポーツ活動やサーフェスウォータースポーツ活動への参加者の増加は、市場の大きな需要につながります。
目次
第1章 エグゼクティブサマリー
- 市場概要
第2章 Technavio別分析
- 価格・ライフサイクル・顧客購入バスケット・採用率・購入基準の分析
- インプットの重要性と差別化の要因
- 混乱の要因
- 促進要因と課題の影響
第3章 市場情勢
- 市場エコシステム
- 市場の特徴
- バリューチェーン分析
第4章 市場規模
- 市場の定義
- 市場セグメント分析
- 市場規模 2024
- 市場の見通し 2024-2029
第5章 市場規模実績
- サーフェスウォータースポーツ用品の世界市場 2019-2023
- タイプ別セグメント分析 2019-2023
- 製品別セグメント分析 2019-2023
- 流通チャネル別セグメント分析 2019-2023
- 価格別セグメント分析 2019-2023
- 地域別セグメント分析 2019-2023
- 国別セグメント分析 2019-2023
第6章 定性分析
- AIの影響:サーフェスウォータースポーツ用品の世界市場
第7章 ファイブフォース分析
- ファイブフォースの要約
- 買い手の交渉力
- 供給企業の交渉力
- 新規参入業者の脅威
- 代替品の脅威
- 競争の脅威
- 市況
第8章 市場セグメンテーション:タイプ別
- 市場セグメント
- 比較:タイプ別
- サーフィン:市場規模と予測 2024-2029
- ボード:市場規模と予測 2024-2029
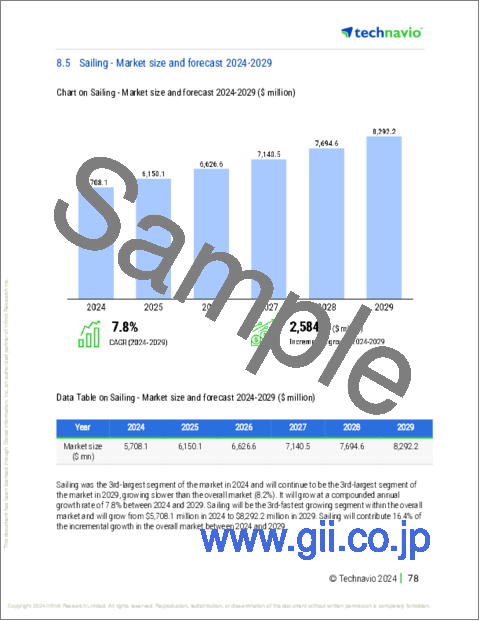
- セーリング:市場規模と予測 2024-2029
- 水上スキー:市場規模と予測 2024-2029
- その他:市場規模と予測 2024-2029
- 市場機会:タイプ別
第9章 市場セグメンテーション:製品別
- 市場セグメント
- 比較:製品別
- 衣服:市場規模と予測 2024-2029
- その他:市場規模と予測 2024-2029
- 市場機会:製品別
第10章 市場セグメンテーション:流通チャネル別
- 市場セグメント
- 比較:流通チャネル別
- ハイパーマーケットとスーパーマーケット:市場規模と予測 2024-2029
- 卸売業者および販売業者:市場規模と予測 2024-2029
- 限定店舗:市場規模と予測 2024-2029
- 市場機会:流通チャネル別
第11章 市場セグメンテーション価格別
- 市場セグメント
- 比較価格別
- 質量:市場規模と予測 2024-2029
- プレミアム:市場規模と予測 2024-2029
- 市場機会価格別
第12章 顧客情勢
- 顧客情勢の概要
第13章 地域別情勢
- 地域別セグメンテーション
- 地域別比較
- 北米:市場規模と予測 2024-2029
- 欧州:市場規模と予測 2024-2029
- アジア太平洋:市場規模と予測 2024-2029
- 南米:市場規模と予測 2024-2029
- 中東・アフリカ:市場規模と予測 2024-2029
- 米国:市場規模と予測 2024-2029
- フランス:市場規模と予測 2024-2029
- オーストラリア:市場規模と予測 2024-2029
- イタリア:市場規模と予測 2024-2029
- メキシコ:市場規模と予測 2024-2029
- ブラジル:市場規模と予測 2024-2029
- カナダ:市場規模と予測 2024-2029
- 中国:市場規模と予測 2024-2029
- インド:市場規模と予測 2024-2029
- 日本:市場規模と予測 2024-2029
- 市場機会:地域情勢別
第14章 促進要因・課題・機会・抑制要因
- 市場促進要因
- 市場の課題
- 促進要因と課題の影響
- 市場の機会・抑制要因
第15章 競合情勢
- 概要
- 競合情勢
- 混乱の状況
- 業界のリスク
第16章 競合分析
- 企業プロファイル
- 企業ランキング指数
- 企業の市場ポジショニング
- AIRE Inc.
- Belassi GmbH
- BomBoard LLC
- Decathlon SA
- Escalade Inc.
- Imagine Nation Sports LLC
- Kent Water Sports LLC
- KJK Sports
- Kubus Sports B.V.
- North Sails LLC
- Starboard Co. Ltd.
- Sunny Water Sports Products Pvt. Ltd.
- SurfTech LLC
- Vanguard Inflatables
- Wing Group
第17章 付録
The surface water sports equipment market is forecasted to grow by USD 15.75 billion during 2024-2029, accelerating at a CAGR of 8.2% during the forecast period. The report on the surface water sports equipment market provides a holistic analysis, market size and forecast, trends, growth drivers, and challenges, as well as vendor analysis covering around 25 vendors.
The report offers an up-to-date analysis regarding the current market scenario, the latest trends and drivers, and the overall market environment. The market is driven by growing number of water sporting facilities globally, fitness benefits associated with surface water sports, and growth in online retail of surface water sports equipment.
| Market Scope | |
|---|---|
| Base Year | 2025 |
| End Year | 2029 |
| Series Year | 2025-2029 |
| Growth Momentum | Accelerate |
| YOY 2025 | 8.1% |
| CAGR | 8.2% |
| Incremental Value | $15.75 bn |
The study was conducted using an objective combination of primary and secondary information including inputs from key participants in the industry. The report contains a comprehensive market size data, segment with regional analysis and vendor landscape in addition to an analysis of the key companies. Reports have historic and forecast data.
Technavio's surface water sports equipment market is segmented as below:
By Type
- Surfing
- Boarding
- Sailing
- Skiing
- Others
By Product
- Apparel
- Others
By Distribution Channel
- Hypermarkets and supermarkets
- Wholesalers and distributors
- Exclusive stores
By Price
- Mass
- Premium
By Geographical Landscape
- North America
- Europe
- APAC
- South America
- Middle East and Africa
This study identifies the artificial water sporting experiences as one of the prime reasons driving the surface water sports equipment market growth during the next few years. Also, novel surface water sporting activities and increasing participation in surface water sporting activities will lead to sizable demand in the market.
The report on the surface water sports equipment market covers the following areas:
- Surface Water Sports Equipment Market sizing
- Surface Water Sports Equipment Market forecast
- Surface Water Sports Equipment Market industry analysis
The robust vendor analysis is designed to help clients improve their market position, and in line with this, this report provides a detailed analysis of several leading surface water sports equipment market vendors that include AIRE Inc., Belassi GmbH, Blue Sea Watersports, BomBoard LLC, Decathlon SA, Escalade Inc., Imagine Nation Sports LLC, Johnson Outdoors Inc., Kent Water Sports LLC, KJK Sports, Kubus Sports B.V., Marine Products Corp., North Sails LLC, Obrien, Solstice Watersports, Starboard Co. Ltd., Sunny Water Sports Products Pvt. Ltd., SurfTech LLC, Vanguard Inflatables, and Wing Group. Also, the surface water sports equipment market analysis report includes information on upcoming trends and challenges that will influence market growth. This is to help companies strategize and leverage all forthcoming growth opportunities.
The publisher presents a detailed picture of the market by the way of study, synthesis, and summation of data from multiple sources by an analysis of key parameters such as profit, pricing, competition, and promotions. It presents various market facets by identifying the key industry influencers. The data presented is comprehensive, reliable, and a result of extensive primary and secondary research. The market research reports provide a complete competitive landscape and an in-depth vendor selection methodology and analysis using qualitative and quantitative research to forecast accurate market growth.
Table of Contents
1 Executive Summary
- 1.1 Market overview
- Executive Summary - Chart on Market Overview
- Executive Summary - Data Table on Market Overview
- Executive Summary - Chart on Global Market Characteristics
- Executive Summary - Chart on Market By Geographical Landscape
- Executive Summary - Chart on Market Segmentation by Type
- Executive Summary - Chart on Market Segmentation by Product
- Executive Summary - Chart on Market Segmentation by Distribution Channel
- Executive Summary - Chart on Market Segmentation by Price
- Executive Summary - Chart on Incremental Growth
- Executive Summary - Data Table on Incremental Growth
- Executive Summary - Chart on Company Market Positioning
2 Technavio Analysis
- 2.1 Analysis of price sensitivity, lifecycle, customer purchase basket, adoption rates, and purchase criteria
- Analysis of price sensitivity, lifecycle, customer purchase basket, adoption rates, and purchase criteria
- 2.2 Criticality of inputs and Factors of differentiation
- Overview on criticality of inputs and factors of differentiation
- 2.3 Factors of disruption
- Overview on factors of disruption
- 2.4 Impact of drivers and challenges
- Impact of drivers and challenges in 2024 and 2029
3 Market Landscape
- 3.1 Market ecosystem
- Parent Market
- Data Table on - Parent Market
- 3.2 Market characteristics
- Market characteristics analysis
- 3.3 Value chain analysis
- Value chain analysis
4 Market Sizing
- 4.1 Market definition
- Offerings of companies included in the market definition
- 4.2 Market segment analysis
- Market segments
- 4.3 Market size 2024
- 4.4 Market outlook: Forecast for 2024-2029
- Chart on Global - Market size and forecast 2024-2029 ($ billion)
- Data Table on Global - Market size and forecast 2024-2029 ($ billion)
- Chart on Global Market: Year-over-year growth 2024-2029 (%)
- Data Table on Global Market: Year-over-year growth 2024-2029 (%)
5 Historic Market Size
- 5.1 Global Surface Water Sports Equipment Market 2019 - 2023
- Historic Market Size - Data Table on Global Surface Water Sports Equipment Market 2019 - 2023 ($ billion)
- 5.2 Type segment analysis 2019 - 2023
- Historic Market Size - Type Segment 2019 - 2023 ($ billion)
- 5.3 Product segment analysis 2019 - 2023
- Historic Market Size - Product Segment 2019 - 2023 ($ billion)
- 5.4 Distribution Channel segment analysis 2019 - 2023
- Historic Market Size - Distribution Channel Segment 2019 - 2023 ($ billion)
- 5.5 Price segment analysis 2019 - 2023
- Historic Market Size - Price Segment 2019 - 2023 ($ billion)
- 5.6 Geography segment analysis 2019 - 2023
- Historic Market Size - Geography Segment 2019 - 2023 ($ billion)
- 5.7 Country segment analysis 2019 - 2023
- Historic Market Size - Country Segment 2019 - 2023 ($ billion)
6 Qualitative Analysis
- 6.1 The AI impact on Global Surface Water Sports Equipment Market
7 Five Forces Analysis
- 7.1 Five forces summary
- Five forces analysis - Comparison between 2024 and 2029
- 7.2 Bargaining power of buyers
- Bargaining power of buyers - Impact of key factors 2024 and 2029
- 7.3 Bargaining power of suppliers
- Bargaining power of suppliers - Impact of key factors in 2024 and 2029
- 7.4 Threat of new entrants
- Threat of new entrants - Impact of key factors in 2024 and 2029
- 7.5 Threat of substitutes
- Threat of substitutes - Impact of key factors in 2024 and 2029
- 7.6 Threat of rivalry
- Threat of rivalry - Impact of key factors in 2024 and 2029
- 7.7 Market condition
- Chart on Market condition - Five forces 2024 and 2029
8 Market Segmentation by Type
- 8.1 Market segments
- Chart on Type - Market share 2024-2029 (%)
- Data Table on Type - Market share 2024-2029 (%)
- 8.2 Comparison by Type
- Chart on Comparison by Type
- Data Table on Comparison by Type
- 8.3 Surfing - Market size and forecast 2024-2029
- Chart on Surfing - Market size and forecast 2024-2029 ($ billion)
- Data Table on Surfing - Market size and forecast 2024-2029 ($ billion)
- Chart on Surfing - Year-over-year growth 2024-2029 (%)
- Data Table on Surfing - Year-over-year growth 2024-2029 (%)
- 8.4 Boarding - Market size and forecast 2024-2029
- Chart on Boarding - Market size and forecast 2024-2029 ($ billion)
- Data Table on Boarding - Market size and forecast 2024-2029 ($ billion)
- Chart on Boarding - Year-over-year growth 2024-2029 (%)
- Data Table on Boarding - Year-over-year growth 2024-2029 (%)
- 8.5 Sailing - Market size and forecast 2024-2029
- Chart on Sailing - Market size and forecast 2024-2029 ($ billion)
- Data Table on Sailing - Market size and forecast 2024-2029 ($ billion)
- Chart on Sailing - Year-over-year growth 2024-2029 (%)
- Data Table on Sailing - Year-over-year growth 2024-2029 (%)
- 8.6 Skiing - Market size and forecast 2024-2029
- Chart on Skiing - Market size and forecast 2024-2029 ($ billion)
- Data Table on Skiing - Market size and forecast 2024-2029 ($ billion)
- Chart on Skiing - Year-over-year growth 2024-2029 (%)
- Data Table on Skiing - Year-over-year growth 2024-2029 (%)
- 8.7 Others - Market size and forecast 2024-2029
- Chart on Others - Market size and forecast 2024-2029 ($ billion)
- Data Table on Others - Market size and forecast 2024-2029 ($ billion)
- Chart on Others - Year-over-year growth 2024-2029 (%)
- Data Table on Others - Year-over-year growth 2024-2029 (%)
- 8.8 Market opportunity by Type
- Market opportunity by Type ($ billion)
- Data Table on Market opportunity by Type ($ billion)
9 Market Segmentation by Product
- 9.1 Market segments
- Chart on Product - Market share 2024-2029 (%)
- Data Table on Product - Market share 2024-2029 (%)
- 9.2 Comparison by Product
- Chart on Comparison by Product
- Data Table on Comparison by Product
- 9.3 Apparel - Market size and forecast 2024-2029
- Chart on Apparel - Market size and forecast 2024-2029 ($ billion)
- Data Table on Apparel - Market size and forecast 2024-2029 ($ billion)
- Chart on Apparel - Year-over-year growth 2024-2029 (%)
- Data Table on Apparel - Year-over-year growth 2024-2029 (%)
- 9.4 Others - Market size and forecast 2024-2029
- Chart on Others - Market size and forecast 2024-2029 ($ billion)
- Data Table on Others - Market size and forecast 2024-2029 ($ billion)
- Chart on Others - Year-over-year growth 2024-2029 (%)
- Data Table on Others - Year-over-year growth 2024-2029 (%)
- 9.5 Market opportunity by Product
- Market opportunity by Product ($ billion)
- Data Table on Market opportunity by Product ($ billion)
10 Market Segmentation by Distribution Channel
- 10.1 Market segments
- Chart on Distribution Channel - Market share 2024-2029 (%)
- Data Table on Distribution Channel - Market share 2024-2029 (%)
- 10.2 Comparison by Distribution Channel
- Chart on Comparison by Distribution Channel
- Data Table on Comparison by Distribution Channel
- 10.3 Hypermarkets and supermarkets - Market size and forecast 2024-2029
- Chart on Hypermarkets and supermarkets - Market size and forecast 2024-2029 ($ billion)
- Data Table on Hypermarkets and supermarkets - Market size and forecast 2024-2029 ($ billion)
- Chart on Hypermarkets and supermarkets - Year-over-year growth 2024-2029 (%)
- Data Table on Hypermarkets and supermarkets - Year-over-year growth 2024-2029 (%)
- 10.4 Wholesalers and distributors - Market size and forecast 2024-2029
- Chart on Wholesalers and distributors - Market size and forecast 2024-2029 ($ billion)
- Data Table on Wholesalers and distributors - Market size and forecast 2024-2029 ($ billion)
- Chart on Wholesalers and distributors - Year-over-year growth 2024-2029 (%)
- Data Table on Wholesalers and distributors - Year-over-year growth 2024-2029 (%)
- 10.5 Exclusive stores - Market size and forecast 2024-2029
- Chart on Exclusive stores - Market size and forecast 2024-2029 ($ billion)
- Data Table on Exclusive stores - Market size and forecast 2024-2029 ($ billion)
- Chart on Exclusive stores - Year-over-year growth 2024-2029 (%)
- Data Table on Exclusive stores - Year-over-year growth 2024-2029 (%)
- 10.6 Market opportunity by Distribution Channel
- Market opportunity by Distribution Channel ($ billion)
- Data Table on Market opportunity by Distribution Channel ($ billion)
11 Market Segmentation by Price
- 11.1 Market segments
- Chart on Price - Market share 2024-2029 (%)
- Data Table on Price - Market share 2024-2029 (%)
- 11.2 Comparison by Price
- Chart on Comparison by Price
- Data Table on Comparison by Price
- 11.3 Mass - Market size and forecast 2024-2029
- Chart on Mass - Market size and forecast 2024-2029 ($ billion)
- Data Table on Mass - Market size and forecast 2024-2029 ($ billion)
- Chart on Mass - Year-over-year growth 2024-2029 (%)
- Data Table on Mass - Year-over-year growth 2024-2029 (%)
- 11.4 Premium - Market size and forecast 2024-2029
- Chart on Premium - Market size and forecast 2024-2029 ($ billion)
- Data Table on Premium - Market size and forecast 2024-2029 ($ billion)
- Chart on Premium - Year-over-year growth 2024-2029 (%)
- Data Table on Premium - Year-over-year growth 2024-2029 (%)
- 11.5 Market opportunity by Price
- Market opportunity by Price ($ billion)
- Data Table on Market opportunity by Price ($ billion)
12 Customer Landscape
- 12.1 Customer landscape overview
- Analysis of price sensitivity, lifecycle, customer purchase basket, adoption rates, and purchase criteria
13 Geographic Landscape
- 13.1 Geographic segmentation
- Chart on Market share By Geographical Landscape 2024-2029 (%)
- Data Table on Market share By Geographical Landscape 2024-2029 (%)
- 13.2 Geographic comparison
- Chart on Geographic comparison
- Data Table on Geographic comparison
- 13.3 North America - Market size and forecast 2024-2029
- Chart on North America - Market size and forecast 2024-2029 ($ billion)
- Data Table on North America - Market size and forecast 2024-2029 ($ billion)
- Chart on North America - Year-over-year growth 2024-2029 (%)
- Data Table on North America - Year-over-year growth 2024-2029 (%)
- 13.4 Europe - Market size and forecast 2024-2029
- Chart on Europe - Market size and forecast 2024-2029 ($ billion)
- Data Table on Europe - Market size and forecast 2024-2029 ($ billion)
- Chart on Europe - Year-over-year growth 2024-2029 (%)
- Data Table on Europe - Year-over-year growth 2024-2029 (%)
- 13.5 APAC - Market size and forecast 2024-2029
- Chart on APAC - Market size and forecast 2024-2029 ($ billion)
- Data Table on APAC - Market size and forecast 2024-2029 ($ billion)
- Chart on APAC - Year-over-year growth 2024-2029 (%)
- Data Table on APAC - Year-over-year growth 2024-2029 (%)
- 13.6 South America - Market size and forecast 2024-2029
- Chart on South America - Market size and forecast 2024-2029 ($ billion)
- Data Table on South America - Market size and forecast 2024-2029 ($ billion)
- Chart on South America - Year-over-year growth 2024-2029 (%)
- Data Table on South America - Year-over-year growth 2024-2029 (%)
- 13.7 Middle East and Africa - Market size and forecast 2024-2029
- Chart on Middle East and Africa - Market size and forecast 2024-2029 ($ billion)
- Data Table on Middle East and Africa - Market size and forecast 2024-2029 ($ billion)
- Chart on Middle East and Africa - Year-over-year growth 2024-2029 (%)
- Data Table on Middle East and Africa - Year-over-year growth 2024-2029 (%)
- 13.8 US - Market size and forecast 2024-2029
- Chart on US - Market size and forecast 2024-2029 ($ billion)
- Data Table on US - Market size and forecast 2024-2029 ($ billion)
- Chart on US - Year-over-year growth 2024-2029 (%)
- Data Table on US - Year-over-year growth 2024-2029 (%)
- 13.9 France - Market size and forecast 2024-2029
- Chart on France - Market size and forecast 2024-2029 ($ billion)
- Data Table on France - Market size and forecast 2024-2029 ($ billion)
- Chart on France - Year-over-year growth 2024-2029 (%)
- Data Table on France - Year-over-year growth 2024-2029 (%)
- 13.10 Australia - Market size and forecast 2024-2029
- Chart on Australia - Market size and forecast 2024-2029 ($ billion)
- Data Table on Australia - Market size and forecast 2024-2029 ($ billion)
- Chart on Australia - Year-over-year growth 2024-2029 (%)
- Data Table on Australia - Year-over-year growth 2024-2029 (%)
- 13.11 Italy - Market size and forecast 2024-2029
- Chart on Italy - Market size and forecast 2024-2029 ($ billion)
- Data Table on Italy - Market size and forecast 2024-2029 ($ billion)
- Chart on Italy - Year-over-year growth 2024-2029 (%)
- Data Table on Italy - Year-over-year growth 2024-2029 (%)
- 13.12 Mexico - Market size and forecast 2024-2029
- Chart on Mexico - Market size and forecast 2024-2029 ($ billion)
- Data Table on Mexico - Market size and forecast 2024-2029 ($ billion)
- Chart on Mexico - Year-over-year growth 2024-2029 (%)
- Data Table on Mexico - Year-over-year growth 2024-2029 (%)
- 13.13 Brazil - Market size and forecast 2024-2029
- Chart on Brazil - Market size and forecast 2024-2029 ($ billion)
- Data Table on Brazil - Market size and forecast 2024-2029 ($ billion)
- Chart on Brazil - Year-over-year growth 2024-2029 (%)
- Data Table on Brazil - Year-over-year growth 2024-2029 (%)
- 13.14 Canada - Market size and forecast 2024-2029
- Chart on Canada - Market size and forecast 2024-2029 ($ billion)
- Data Table on Canada - Market size and forecast 2024-2029 ($ billion)
- Chart on Canada - Year-over-year growth 2024-2029 (%)
- Data Table on Canada - Year-over-year growth 2024-2029 (%)
- 13.15 China - Market size and forecast 2024-2029
- Chart on China - Market size and forecast 2024-2029 ($ billion)
- Data Table on China - Market size and forecast 2024-2029 ($ billion)
- Chart on China - Year-over-year growth 2024-2029 (%)
- Data Table on China - Year-over-year growth 2024-2029 (%)
- 13.16 India - Market size and forecast 2024-2029
- Chart on India - Market size and forecast 2024-2029 ($ billion)
- Data Table on India - Market size and forecast 2024-2029 ($ billion)
- Chart on India - Year-over-year growth 2024-2029 (%)
- Data Table on India - Year-over-year growth 2024-2029 (%)
- 13.17 Japan - Market size and forecast 2024-2029
- Chart on Japan - Market size and forecast 2024-2029 ($ billion)
- Data Table on Japan - Market size and forecast 2024-2029 ($ billion)
- Chart on Japan - Year-over-year growth 2024-2029 (%)
- Data Table on Japan - Year-over-year growth 2024-2029 (%)
- 13.18 Market opportunity By Geographical Landscape
- Market opportunity By Geographical Landscape ($ billion)
- Data Tables on Market opportunity By Geographical Landscape ($ billion)
14 Drivers, Challenges, and Opportunity/Restraints
- 14.1 Market drivers
- 14.2 Market challenges
- 14.3 Impact of drivers and challenges
- Impact of drivers and challenges in 2024 and 2029
- 14.4 Market opportunities/restraints
15 Competitive Landscape
- 15.1 Overview
- 15.2 Competitive Landscape
- Overview on criticality of inputs and factors of differentiation
- 15.3 Landscape disruption
- Overview on factors of disruption
- 15.4 Industry risks
- Impact of key risks on business
16 Competitive Analysis
- 16.1 Companies profiled
- Companies covered
- 16.2 Company ranking index
- Company ranking index
- 16.3 Market positioning of companies
- Matrix on companies position and classification
- 16.4 AIRE Inc.
- AIRE Inc. - Overview
- AIRE Inc. - Product / Service
- AIRE Inc. - Key offerings
- SWOT
- 16.5 Belassi GmbH
- Belassi GmbH - Overview
- Belassi GmbH - Product / Service
- Belassi GmbH - Key offerings
- SWOT
- 16.6 BomBoard LLC
- BomBoard LLC - Overview
- BomBoard LLC - Product / Service
- BomBoard LLC - Key offerings
- SWOT
- 16.7 Decathlon SA
- Decathlon SA - Overview
- Decathlon SA - Product / Service
- Decathlon SA - Key offerings
- SWOT
- 16.8 Escalade Inc.
- Escalade Inc. - Overview
- Escalade Inc. - Product / Service
- Escalade Inc. - Key offerings
- SWOT
- 16.9 Imagine Nation Sports LLC
- Imagine Nation Sports LLC - Overview
- Imagine Nation Sports LLC - Product / Service
- Imagine Nation Sports LLC - Key offerings
- SWOT
- 16.10 Kent Water Sports LLC
- Kent Water Sports LLC - Overview
- Kent Water Sports LLC - Product / Service
- Kent Water Sports LLC - Key offerings
- SWOT
- 16.11 KJK Sports
- KJK Sports - Overview
- KJK Sports - Product / Service
- KJK Sports - Key offerings
- SWOT
- 16.12 Kubus Sports B.V.
- Kubus Sports B.V. - Overview
- Kubus Sports B.V. - Product / Service
- Kubus Sports B.V. - Key offerings
- SWOT
- 16.13 North Sails LLC
- North Sails LLC - Overview
- North Sails LLC - Product / Service
- North Sails LLC - Key offerings
- SWOT
- 16.14 Starboard Co. Ltd.
- Starboard Co. Ltd. - Overview
- Starboard Co. Ltd. - Product / Service
- Starboard Co. Ltd. - Key offerings
- SWOT
- 16.15 Sunny Water Sports Products Pvt. Ltd.
- Sunny Water Sports Products Pvt. Ltd. - Overview
- Sunny Water Sports Products Pvt. Ltd. - Product / Service
- Sunny Water Sports Products Pvt. Ltd. - Key offerings
- SWOT
- 16.16 SurfTech LLC
- SurfTech LLC - Overview
- SurfTech LLC - Product / Service
- SurfTech LLC - Key offerings
- SWOT
- 16.17 Vanguard Inflatables
- Vanguard Inflatables - Overview
- Vanguard Inflatables - Product / Service
- Vanguard Inflatables - Key offerings
- SWOT
- 16.18 Wing Group
- Wing Group - Overview
- Wing Group - Product / Service
- Wing Group - Key offerings
- SWOT
17 Appendix
- 17.1 Scope of the report
- 17.2 Inclusions and exclusions checklist
- Inclusions checklist
- Exclusions checklist
- 17.3 Currency conversion rates for US$
- Currency conversion rates for US$
- 17.4 Research methodology
- Research methodology
- 17.5 Data procurement
- Information sources
- 17.6 Data validation
- Data validation
- 17.7 Validation techniques employed for market sizing
- Validation techniques employed for market sizing
- 17.8 Data synthesis
- Data synthesis
- 17.9 360 degree market analysis
- 360 degree market analysis
- 17.10 List of abbreviations
- List of abbreviations

