|
|
市場調査レポート
商品コード
1652819
自動車部品の世界市場、2025-2029年Global Auto Parts Market 2025-2029 |
||||||

|
|||||||
カスタマイズ可能
|
|||||||


| 自動車部品の世界市場、2025-2029年 |
|
出版日: 2025年01月23日
発行: TechNavio
ページ情報: 英文 205 Pages
納期: 即納可能
|

全表示
- 概要
- 目次
自動車部品市場は2024-2029年に3,676億米ドル、予測期間中のCAGRは3.2%で成長すると予測されます。
当レポートでは、自動車部品市場の全体的な分析、市場規模・予測、動向、成長促進要因、課題、約25のベンダーを網羅したベンダー分析などを掲載しています。
現在の市場シナリオ、最新動向と促進要因、市場環境全体に関する最新分析を提供しています。世界の自動車部品市場における技術進歩の利用増加、自動車修理・メンテナンスサービスのデジタル化、アフターマーケットからの高い需要が市場を牽引しています。
| 市場範囲 | |
|---|---|
| 基準年 | 2025 |
| 終了年 | 2029 |
| 予測期間 | 2025-2029 |
| 成長モメンタム | 加速 |
| 前年比2025年 | 3.1% |
| CAGR | 3.2% |
| 増分額 | 3,676億米ドル |
本調査では、今後数年間の自動車部品市場の成長を促進する主な要因の1つとして、カスタマイズとパーソナライゼーションの増加を挙げています。また、インダストリー4.0による業務効率の向上や、eコマースプラットフォームでの自動車アフターマーケット部品の入手可能性の拡大も、市場の大きな需要につながると思われます。
目次
第1章 エグゼクティブサマリー
- 市場概要
第2章 Technavio分析
- 価格・ライフサイクル・顧客購入バスケット・採用率・購入基準の分析
- インプットの重要性と差別化の要因
- 混乱の要因
- 促進要因と課題の影響
第3章 市場情勢
- 市場エコシステム
- 市場の特徴
- バリューチェーン分析
第4章 市場規模
- 市場の定義
- 市場セグメント分析
- 市場規模 2024
- 市場の見通し 2024-2029
第5章 市場規模実績
- 自動車部品の世界市場 2019-2023
- エンドユーザーセグメント分析 2019-2023
- 流通チャネルセグメント分析 2019-2023
- 地域別セグメント分析 2019-2023
- 国別セグメント分析 2019-2023
第6章 定性分析
- AIの影響:自動車部品の世界市場
第7章 ファイブフォース分析
- ファイブフォースの要約
- 買い手の交渉力
- 供給企業の交渉力
- 新規参入業者の脅威
- 代替品の脅威
- 競争の脅威
- 市況
第8章 市場セグメンテーション:エンドユーザー別
- 市場セグメント
- 比較:エンドユーザー別
- OEM:市場規模と予測 2024-2029
- アフターマーケット:市場規模と予測 2024-2029
- 市場機会:エンドユーザー別
第9章 市場セグメンテーション:流通チャネル別
- 市場セグメント
- 比較:流通チャネル別
- オフライン:市場規模と予測 2024-2029
- オンライン:市場規模と予測 2024-2029
- 市場機会:流通チャネル別
第10章 顧客情勢
- 顧客情勢の概要
第11章 地域別情勢
- 地域別セグメンテーション
- 地域別比較
- 北米:市場規模と予測 2024-2029
- 欧州:市場規模と予測 2024-2029
- アジア太平洋:市場規模と予測 2024-2029
- 南米:市場規模と予測 2024-2029
- 中東・アフリカ:市場規模と予測 2024-2029
- 米国:市場規模と予測 2024-2029
- ドイツ:市場規模と予測 2024-2029
- 中国:市場規模と予測 2024-2029
- 英国:市場規模と予測 2024-2029
- 日本:市場規模と予測 2024-2029
- インド:市場規模と予測 2024-2029
- カナダ:市場規模と予測 2024-2029
- 韓国:市場規模と予測 2024-2029
- フランス:市場規模と予測 2024-2029
- イタリア:市場規模と予測 2024-2029
- 市場機会:地域情勢別
第12章 促進要因・課題・機会・抑制要因
- 市場促進要因
- 市場の課題
- 促進要因と課題の影響
- 市場の機会・抑制要因
第13章 競合情勢
- 概要
- 競合情勢
- 混乱の状況
- 業界のリスク
第14章 競合分析
- 企業プロファイル
- 企業ランキング指数
- 企業の市場ポジショニング
- AISIN Corp.
- Akebono Brake Industry Co. Ltd.
- BorgWarner Inc.
- Brembo Spa
- Forvia SE
- General Motors Co.
- Hyundai Motor Co.
- Marelli Holdings Co. Ltd.
- Robert Bosch GmbH
- Schaeffler AG
- Tenneco Inc.
- The Goodyear Tire and Rubber Co.
- Toyota Motor Corp.
- ZF Friedrichshafen AG
第15章 付録
The auto parts market is forecasted to grow by USD 367.6 bn during 2024-2029, accelerating at a CAGR of 3.2% during the forecast period. The report on the auto parts market provides a holistic analysis, market size and forecast, trends, growth drivers, and challenges, as well as vendor analysis covering around 25 vendors.
The report offers an up-to-date analysis regarding the current market scenario, the latest trends and drivers, and the overall market environment. The market is driven by increased usage of technological advancement in global auto parts market, digitalization of automotive repair and maintenance services, and high demand from aftermarket.
| Market Scope | |
|---|---|
| Base Year | 2025 |
| End Year | 2029 |
| Series Year | 2025-2029 |
| Growth Momentum | Accelerate |
| YOY 2025 | 3.1% |
| CAGR | 3.2% |
| Incremental Value | $367.6 bn |
Technavio's auto parts market is segmented as below:
By End-user
- OEM
- Aftermarket
By Distribution Channel
- Offline
- Online
By Geographical Landscape
- North America
- Europe
- APAC
- South America
- Middle East and Africa
This study identifies the increasing customization and personalization as one of the prime reasons driving the auto parts market growth during the next few years. Also, enhancing operating efficiency with industry 4.0 and growing availability of automotive aftermarket parts on e-commerce platforms will lead to sizable demand in the market.
The report on the auto parts market covers the following areas:
- Auto Parts Market sizing
- Auto Parts Market forecast
- Auto Parts Market industry analysis
The robust vendor analysis is designed to help clients improve their market position, and in line with this, this report provides a detailed analysis of several leading auto parts market vendors that include 3M Co., AISIN Corp., Akebono Brake Industry Co. Ltd., Autoliv Inc., BorgWarner Inc., Brembo Spa, Forvia SE, General Motors Co., HELLA GmbH and Co. KGaA, Hyundai Motor Co., Lear Corp., Magna International Inc., Marelli Holdings Co. Ltd., Robert Bosch GmbH, Schaeffler AG, Tenneco Inc., The Goodyear Tire and Rubber Co., Toyota Motor Corp., Valeo SA, and ZF Friedrichshafen AG. Also, the auto parts market analysis report includes information on upcoming trends and challenges that will influence market growth. This is to help companies strategize and leverage all forthcoming growth opportunities.
The study was conducted using an objective combination of primary and secondary information including inputs from key participants in the industry. The report contains a comprehensive market and vendor landscape in addition to an analysis of the key vendors.
The publisher presents a detailed picture of the market by the way of study, synthesis, and summation of data from multiple sources by an analysis of key parameters such as profit, pricing, competition, and promotions. It presents various market facets by identifying the key industry influencers. The data presented is comprehensive, reliable, and a result of extensive primary and secondary research. The market research reports provide a complete competitive landscape and an in-depth vendor selection methodology and analysis using qualitative and quantitative research to forecast accurate market growth.
Table of Contents
1 Executive Summary
- 1.1 Market overview
- Executive Summary - Chart on Market Overview
- Executive Summary - Data Table on Market Overview
- Executive Summary - Chart on Global Market Characteristics
- Executive Summary - Chart on Market By Geographical Landscape
- Executive Summary - Chart on Market Segmentation by End-user
- Executive Summary - Chart on Market Segmentation by Distribution Channel
- Executive Summary - Chart on Incremental Growth
- Executive Summary - Data Table on Incremental Growth
- Executive Summary - Chart on Company Market Positioning
2 Technavio Analysis
- 2.1 Analysis of price sensitivity, lifecycle, customer purchase basket, adoption rates, and purchase criteria
- Analysis of price sensitivity, lifecycle, customer purchase basket, adoption rates, and purchase criteria
- 2.2 Criticality of inputs and Factors of differentiation
- Overview on criticality of inputs and factors of differentiation
- 2.3 Factors of disruption
- Overview on factors of disruption
- 2.4 Impact of drivers and challenges
- Impact of drivers and challenges in 2024 and 2029
3 Market Landscape
- 3.1 Market ecosystem
- Parent Market
- Data Table on - Parent Market
- 3.2 Market characteristics
- Market characteristics analysis
- 3.3 Value chain analysis
- Value chain analysis
4 Market Sizing
- 4.1 Market definition
- Offerings of companies included in the market definition
- 4.2 Market segment analysis
- Market segments
- 4.3 Market size 2024
- 4.4 Market outlook: Forecast for 2024-2029
- Chart on Global - Market size and forecast 2024-2029 ($ billion)
- Data Table on Global - Market size and forecast 2024-2029 ($ billion)
- Chart on Global Market: Year-over-year growth 2024-2029 (%)
- Data Table on Global Market: Year-over-year growth 2024-2029 (%)
5 Historic Market Size
- 5.1 Global Auto Parts Market 2019 - 2023
- Historic Market Size - Data Table on Global Auto Parts Market 2019 - 2023 ($ billion)
- 5.2 End-user segment analysis 2019 - 2023
- Historic Market Size - End-user Segment 2019 - 2023 ($ billion)
- 5.3 Distribution Channel segment analysis 2019 - 2023
- Historic Market Size - Distribution Channel Segment 2019 - 2023 ($ billion)
- 5.4 Geography segment analysis 2019 - 2023
- Historic Market Size - Geography Segment 2019 - 2023 ($ billion)
- 5.5 Country segment analysis 2019 - 2023
- Historic Market Size - Country Segment 2019 - 2023 ($ billion)
6 Qualitative Analysis
- 6.1 Impact of AI on the Global Auto Parts Market
7 Five Forces Analysis
- 7.1 Five forces summary
- Five forces analysis - Comparison between 2024 and 2029
- 7.2 Bargaining power of buyers
- Bargaining power of buyers - Impact of key factors 2024 and 2029
- 7.3 Bargaining power of suppliers
- Bargaining power of suppliers - Impact of key factors in 2024 and 2029
- 7.4 Threat of new entrants
- Threat of new entrants - Impact of key factors in 2024 and 2029
- 7.5 Threat of substitutes
- Threat of substitutes - Impact of key factors in 2024 and 2029
- 7.6 Threat of rivalry
- Threat of rivalry - Impact of key factors in 2024 and 2029
- 7.7 Market condition
- Chart on Market condition - Five forces 2024 and 2029
8 Market Segmentation by End-user
- 8.1 Market segments
- Chart on End-user - Market share 2024-2029 (%)
- Data Table on End-user - Market share 2024-2029 (%)
- 8.2 Comparison by End-user
- Chart on Comparison by End-user
- Data Table on Comparison by End-user
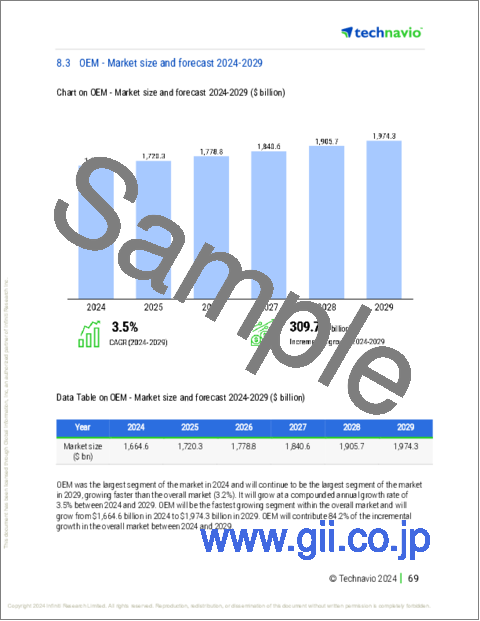
- 8.3 OEM - Market size and forecast 2024-2029
- Chart on OEM - Market size and forecast 2024-2029 ($ billion)
- Data Table on OEM - Market size and forecast 2024-2029 ($ billion)
- Chart on OEM - Year-over-year growth 2024-2029 (%)
- Data Table on OEM - Year-over-year growth 2024-2029 (%)
- 8.4 Aftermarket - Market size and forecast 2024-2029
- Chart on Aftermarket - Market size and forecast 2024-2029 ($ billion)
- Data Table on Aftermarket - Market size and forecast 2024-2029 ($ billion)
- Chart on Aftermarket - Year-over-year growth 2024-2029 (%)
- Data Table on Aftermarket - Year-over-year growth 2024-2029 (%)
- 8.5 Market opportunity by End-user
- Market opportunity by End-user ($ billion)
- Data Table on Market opportunity by End-user ($ billion)
9 Market Segmentation by Distribution Channel
- 9.1 Market segments
- Chart on Distribution Channel - Market share 2024-2029 (%)
- Data Table on Distribution Channel - Market share 2024-2029 (%)
- 9.2 Comparison by Distribution Channel
- Chart on Comparison by Distribution Channel
- Data Table on Comparison by Distribution Channel
- 9.3 Offline - Market size and forecast 2024-2029
- Chart on Offline - Market size and forecast 2024-2029 ($ billion)
- Data Table on Offline - Market size and forecast 2024-2029 ($ billion)
- Chart on Offline - Year-over-year growth 2024-2029 (%)
- Data Table on Offline - Year-over-year growth 2024-2029 (%)
- 9.4 Online - Market size and forecast 2024-2029
- Chart on Online - Market size and forecast 2024-2029 ($ billion)
- Data Table on Online - Market size and forecast 2024-2029 ($ billion)
- Chart on Online - Year-over-year growth 2024-2029 (%)
- Data Table on Online - Year-over-year growth 2024-2029 (%)
- 9.5 Market opportunity by Distribution Channel
- Market opportunity by Distribution Channel ($ billion)
- Data Table on Market opportunity by Distribution Channel ($ billion)
10 Customer Landscape
- 10.1 Customer landscape overview
- Analysis of price sensitivity, lifecycle, customer purchase basket, adoption rates, and purchase criteria
11 Geographic Landscape
- 11.1 Geographic segmentation
- Chart on Market share By Geographical Landscape 2024-2029 (%)
- Data Table on Market share By Geographical Landscape 2024-2029 (%)
- 11.2 Geographic comparison
- Chart on Geographic comparison
- Data Table on Geographic comparison
- 11.3 North America - Market size and forecast 2024-2029
- Chart on North America - Market size and forecast 2024-2029 ($ billion)
- Data Table on North America - Market size and forecast 2024-2029 ($ billion)
- Chart on North America - Year-over-year growth 2024-2029 (%)
- Data Table on North America - Year-over-year growth 2024-2029 (%)
- 11.4 Europe - Market size and forecast 2024-2029
- Chart on Europe - Market size and forecast 2024-2029 ($ billion)
- Data Table on Europe - Market size and forecast 2024-2029 ($ billion)
- Chart on Europe - Year-over-year growth 2024-2029 (%)
- Data Table on Europe - Year-over-year growth 2024-2029 (%)
- 11.5 APAC - Market size and forecast 2024-2029
- Chart on APAC - Market size and forecast 2024-2029 ($ billion)
- Data Table on APAC - Market size and forecast 2024-2029 ($ billion)
- Chart on APAC - Year-over-year growth 2024-2029 (%)
- Data Table on APAC - Year-over-year growth 2024-2029 (%)
- 11.6 South America - Market size and forecast 2024-2029
- Chart on South America - Market size and forecast 2024-2029 ($ billion)
- Data Table on South America - Market size and forecast 2024-2029 ($ billion)
- Chart on South America - Year-over-year growth 2024-2029 (%)
- Data Table on South America - Year-over-year growth 2024-2029 (%)
- 11.7 Middle East and Africa - Market size and forecast 2024-2029
- Chart on Middle East and Africa - Market size and forecast 2024-2029 ($ billion)
- Data Table on Middle East and Africa - Market size and forecast 2024-2029 ($ billion)
- Chart on Middle East and Africa - Year-over-year growth 2024-2029 (%)
- Data Table on Middle East and Africa - Year-over-year growth 2024-2029 (%)
- 11.8 US - Market size and forecast 2024-2029
- Chart on US - Market size and forecast 2024-2029 ($ billion)
- Data Table on US - Market size and forecast 2024-2029 ($ billion)
- Chart on US - Year-over-year growth 2024-2029 (%)
- Data Table on US - Year-over-year growth 2024-2029 (%)
- 11.9 Germany - Market size and forecast 2024-2029
- Chart on Germany - Market size and forecast 2024-2029 ($ billion)
- Data Table on Germany - Market size and forecast 2024-2029 ($ billion)
- Chart on Germany - Year-over-year growth 2024-2029 (%)
- Data Table on Germany - Year-over-year growth 2024-2029 (%)
- 11.10 China - Market size and forecast 2024-2029
- Chart on China - Market size and forecast 2024-2029 ($ billion)
- Data Table on China - Market size and forecast 2024-2029 ($ billion)
- Chart on China - Year-over-year growth 2024-2029 (%)
- Data Table on China - Year-over-year growth 2024-2029 (%)
- 11.11 UK - Market size and forecast 2024-2029
- Chart on UK - Market size and forecast 2024-2029 ($ billion)
- Data Table on UK - Market size and forecast 2024-2029 ($ billion)
- Chart on UK - Year-over-year growth 2024-2029 (%)
- Data Table on UK - Year-over-year growth 2024-2029 (%)
- 11.12 Japan - Market size and forecast 2024-2029
- Chart on Japan - Market size and forecast 2024-2029 ($ billion)
- Data Table on Japan - Market size and forecast 2024-2029 ($ billion)
- Chart on Japan - Year-over-year growth 2024-2029 (%)
- Data Table on Japan - Year-over-year growth 2024-2029 (%)
- 11.13 India - Market size and forecast 2024-2029
- Chart on India - Market size and forecast 2024-2029 ($ billion)
- Data Table on India - Market size and forecast 2024-2029 ($ billion)
- Chart on India - Year-over-year growth 2024-2029 (%)
- Data Table on India - Year-over-year growth 2024-2029 (%)
- 11.14 Canada - Market size and forecast 2024-2029
- Chart on Canada - Market size and forecast 2024-2029 ($ billion)
- Data Table on Canada - Market size and forecast 2024-2029 ($ billion)
- Chart on Canada - Year-over-year growth 2024-2029 (%)
- Data Table on Canada - Year-over-year growth 2024-2029 (%)
- 11.15 South Korea - Market size and forecast 2024-2029
- Chart on South Korea - Market size and forecast 2024-2029 ($ billion)
- Data Table on South Korea - Market size and forecast 2024-2029 ($ billion)
- Chart on South Korea - Year-over-year growth 2024-2029 (%)
- Data Table on South Korea - Year-over-year growth 2024-2029 (%)
- 11.16 France - Market size and forecast 2024-2029
- Chart on France - Market size and forecast 2024-2029 ($ billion)
- Data Table on France - Market size and forecast 2024-2029 ($ billion)
- Chart on France - Year-over-year growth 2024-2029 (%)
- Data Table on France - Year-over-year growth 2024-2029 (%)
- 11.17 Italy - Market size and forecast 2024-2029
- Chart on Italy - Market size and forecast 2024-2029 ($ billion)
- Data Table on Italy - Market size and forecast 2024-2029 ($ billion)
- Chart on Italy - Year-over-year growth 2024-2029 (%)
- Data Table on Italy - Year-over-year growth 2024-2029 (%)
- 11.18 Market opportunity By Geographical Landscape
- Market opportunity By Geographical Landscape ($ billion)
- Data Tables on Market opportunity By Geographical Landscape ($ billion)
12 Drivers, Challenges, and Opportunity/Restraints
- 12.1 Market drivers
- 12.2 Market challenges
- 12.3 Impact of drivers and challenges
- Impact of drivers and challenges in 2024 and 2029
- 12.4 Market opportunities/restraints
13 Competitive Landscape
- 13.1 Overview
- 13.2 Competitive Landscape
- Overview on criticality of inputs and factors of differentiation
- 13.3 Landscape disruption
- Overview on factors of disruption
- 13.4 Industry risks
- Impact of key risks on business
14 Competitive Analysis
- 14.1 Companies profiled
- Companies covered
- 14.2 Company ranking index
- Company ranking index
- 14.3 Market positioning of companies
- Matrix on companies position and classification
- 3M Co.
- 3M Co. - Overview
- 3M Co. - Business segments
- 3M Co. - Key news
- 3M Co. - Key offerings
- 3M Co. - Segment focus
- SWOT
- 14.5 AISIN Corp.
- AISIN Corp. - Overview
- AISIN Corp. - Business segments
- AISIN Corp. - Key news
- AISIN Corp. - Key offerings
- AISIN Corp. - Segment focus
- SWOT
- 14.6 Akebono Brake Industry Co. Ltd.
- Akebono Brake Industry Co. Ltd. - Overview
- Akebono Brake Industry Co. Ltd. - Business segments
- Akebono Brake Industry Co. Ltd. - Key offerings
- Akebono Brake Industry Co. Ltd. - Segment focus
- SWOT
- 14.7 BorgWarner Inc.
- BorgWarner Inc. - Overview
- BorgWarner Inc. - Business segments
- BorgWarner Inc. - Key news
- BorgWarner Inc. - Key offerings
- BorgWarner Inc. - Segment focus
- SWOT
- 14.8 Brembo Spa
- Brembo Spa - Overview
- Brembo Spa - Business segments
- Brembo Spa - Key news
- Brembo Spa - Key offerings
- Brembo Spa - Segment focus
- SWOT
- 14.9 Forvia SE
- Forvia SE - Overview
- Forvia SE - Business segments
- Forvia SE - Key offerings
- Forvia SE - Segment focus
- SWOT
- 14.10 General Motors Co.
- General Motors Co. - Overview
- General Motors Co. - Business segments
- General Motors Co. - Key news
- General Motors Co. - Key offerings
- General Motors Co. - Segment focus
- SWOT
- 14.11 Hyundai Motor Co.
- Hyundai Motor Co. - Overview
- Hyundai Motor Co. - Business segments
- Hyundai Motor Co. - Key news
- Hyundai Motor Co. - Key offerings
- Hyundai Motor Co. - Segment focus
- SWOT
- 14.12 Marelli Holdings Co. Ltd.
- Marelli Holdings Co. Ltd. - Overview
- Marelli Holdings Co. Ltd. - Product / Service
- Marelli Holdings Co. Ltd. - Key news
- Marelli Holdings Co. Ltd. - Key offerings
- SWOT
- 14.13 Robert Bosch GmbH
- Robert Bosch GmbH - Overview
- Robert Bosch GmbH - Product / Service
- Robert Bosch GmbH - Key news
- Robert Bosch GmbH - Key offerings
- SWOT
- 14.14 Schaeffler AG
- Schaeffler AG - Overview
- Schaeffler AG - Business segments
- Schaeffler AG - Key news
- Schaeffler AG - Key offerings
- Schaeffler AG - Segment focus
- SWOT
- 14.15 Tenneco Inc.
- Tenneco Inc. - Overview
- Tenneco Inc. - Product / Service
- Tenneco Inc. - Key news
- Tenneco Inc. - Key offerings
- SWOT
- 14.16 The Goodyear Tire and Rubber Co.
- The Goodyear Tire and Rubber Co. - Overview
- The Goodyear Tire and Rubber Co. - Business segments
- The Goodyear Tire and Rubber Co. - Key news
- The Goodyear Tire and Rubber Co. - Key offerings
- The Goodyear Tire and Rubber Co. - Segment focus
- SWOT
- 14.17 Toyota Motor Corp.
- Toyota Motor Corp. - Overview
- Toyota Motor Corp. - Business segments
- Toyota Motor Corp. - Key news
- Toyota Motor Corp. - Key offerings
- Toyota Motor Corp. - Segment focus
- SWOT
- 14.18 ZF Friedrichshafen AG
- ZF Friedrichshafen AG - Overview
- ZF Friedrichshafen AG - Business segments
- ZF Friedrichshafen AG - Key news
- ZF Friedrichshafen AG - Key offerings
- ZF Friedrichshafen AG - Segment focus
- SWOT
15 Appendix
- 15.1 Scope of the report
- 15.2 Inclusions and exclusions checklist
- Inclusions checklist
- Exclusions checklist
- 15.3 Currency conversion rates for US$
- Currency conversion rates for US$
- 15.4 Research methodology
- Research methodology
- 15.5 Data procurement
- Information sources
- 15.6 Data validation
- Data validation
- 15.7 Validation techniques employed for market sizing
- Validation techniques employed for market sizing
- 15.8 Data synthesis
- Data synthesis
- 15.9 360 degree market analysis
- 360 degree market analysis
- 15.10 List of abbreviations
- List of abbreviations

