|
|
市場調査レポート
商品コード
1557544
商業用温室の世界市場 2024年~2028年Global Commercial Greenhouse Market 2024-2028 |
||||||

|
|||||||
カスタマイズ可能
|
|||||||

| 商業用温室の世界市場 2024年~2028年 |
|
出版日: 2024年07月19日
発行: TechNavio
ページ情報: 英文 155 Pages
納期: 即納可能
|

全表示
- 概要
- 図表
- 目次
商業用温室市場は2023年~2028年年に127億6,950万米ドル、予測期間中のCAGRは11.53%で成長すると予測されます。
当レポートでは、商業用温室市場の全体的な分析、市場規模・予測、動向、成長促進要因、課題、約25のベンダーを網羅したベンダー分析などを掲載しています。
現在の市場シナリオ、最新動向と促進要因、市場環境全体に関する最新分析を提供しています。市場は、温室用CO2抽出技術の改善、商業温室におけるLED成長ライトの関連性の増加、食品需要の増加につながる人口増加によって牽引されています。
| 市場範囲 | |
|---|---|
| 基準年 | 2024年 |
| 終了年 | 2028年 |
| 予測期間 | 2024年~2028年 |
| 成長モメンタム | 加速 |
| 前年比2024年 | 10.45% |
| CAGR | 11.53% |
| 増分額 | 127億6,950万米ドル |
本調査では、新興経済諸国における商業用温室への政府支援が、今後数年間の商業用温室市場成長を牽引する主要因の一つであると指摘しています。また、急速な都市化により、近代的な農業技術やイノベーションの導入が加速し、商業用温室新興企業への投資が市場の大きな需要につながります。
目次
第1章 エグゼクティブサマリー
- 市場概要
第2章 市場情勢
- 市場エコシステム
- 市場の特徴
- バリューチェーン分析
第3章 市場規模の評価
- 市場の定義
- 市場セグメント分析
- 市場規模 2023年
- 市場の見通し 2023年~2028年
第4章 市場規模実績
- 商業用温室の世界市場 2018年~2022年
- タイプセグメント分析 2018年~2022年
- 製品セグメント分析 2018年~2022年
- 地域別セグメント分析 2018年~2022年
- 国別セグメント分析 2018年~2022年
第5章 ファイブフォース分析
- ファイブフォースの要約
- 買い手の交渉力
- 供給企業の交渉力
- 新規参入業者の脅威
- 代替品の脅威
- 競争の脅威
- 市況
第6章 市場セグメンテーション:タイプ別
- 市場セグメンテーション
- 比較:タイプ別
- プラスチック温室:市場規模と予測 2023年~2028年
- ガラス温室:市場規模と予測 2023年~2028年
- 市場機会:タイプ別
第7章 市場セグメンテーション:製品別
- 市場セグメンテーション
- 比較:製品別
- 果物と野菜:市場規模と予測 2023年~2028年
- 花と観賞植物:市場規模と予測 2023年~2028年
- 苗木:市場規模と予測 2023年~2028年
- 市場機会:製品別
第8章 顧客情勢
- 顧客情勢の概要
第9章 地域別情勢
- 地域別セグメンテーション
- 地域別比較
- 北米:市場規模と予測 2023年~2028年
- 欧州:市場規模と予測 2023年~2028年
- アジア太平洋:市場規模と予測 2023年~2028年
- 南米:市場規模と予測 2023年~2028年
- 中東・アフリカ:市場規模と予測 2023年~2028年
- 米国:市場規模と予測 2023年~2028年
- オランダ:市場規模と予測 2023年~2028年
- 中国:市場規模と予測 2023年~2028年
- ドイツ:市場規模と予測 2023年~2028年
- スペイン:市場規模と予測 2023年~2028年
- 市場機会:地域情勢別
第10章 促進要因・課題・機会・抑制要因
- 市場促進要因
- 市場の課題
- 促進要因と課題の影響
- 市場の機会・抑制要因
第11章 競合情勢
- 概要
- 競合情勢
- 混乱の状況
- 業界のリスク
第12章 競合分析
- 企業プロファイル
- 企業の市場ポジショニング
- Agra Tech Inc.
- Argus Control Systems Ltd.
- Berry Global Inc.
- Certhon Build B.V.
- Gibraltar Industries Inc.
- Heliospectra AB
- International Greenhouse Contractors LLC
- LOGIQS B.V.
- PLASTIKA KRITIS SA
- Prospiant Inc
- Richel Group SAS
- Signify NV
- Stuppy Greenhouse
- The Glasshouse Company Pty Ltd.
- Top Greenhouses Ltd.
第13章 付録
Exhibits:
- Exhibits1: Executive Summary - Chart on Market Overview
- Exhibits2: Executive Summary - Data Table on Market Overview
- Exhibits3: Executive Summary - Chart on Global Market Characteristics
- Exhibits4: Executive Summary - Chart on Market By Geographical Landscape
- Exhibits5: Executive Summary - Chart on Market Segmentation by Type
- Exhibits6: Executive Summary - Chart on Market Segmentation by Product
- Exhibits7: Executive Summary - Chart on Incremental Growth
- Exhibits8: Executive Summary - Data Table on Incremental Growth
- Exhibits9: Executive Summary - Chart on Company Market Positioning
- Exhibits10: Parent Market
- Exhibits11: Data Table on - Parent Market
- Exhibits12: Market characteristics analysis
- Exhibits13: Value Chain Analysis
- Exhibits14: Offerings of companies included in the market definition
- Exhibits15: Market segments
- Exhibits16: Chart on Global - Market size and forecast 2023-2028 ($ million)
- Exhibits17: Data Table on Global - Market size and forecast 2023-2028 ($ million)
- Exhibits18: Chart on Global Market: Year-over-year growth 2023-2028 (%)
- Exhibits19: Data Table on Global Market: Year-over-year growth 2023-2028 (%)
- Exhibits20: Historic Market Size - Data Table on Global Commercial Greenhouse Market 2018 - 2022 ($ million)
- Exhibits21: Historic Market Size - Type Segment 2018 - 2022 ($ million)
- Exhibits22: Historic Market Size - Product Segment 2018 - 2022 ($ million)
- Exhibits23: Historic Market Size - Geography Segment 2018 - 2022 ($ million)
- Exhibits24: Historic Market Size - Country Segment 2018 - 2022 ($ million)
- Exhibits25: Five forces analysis - Comparison between 2023 and 2028
- Exhibits26: Bargaining power of buyers - Impact of key factors 2023 and 2028
- Exhibits27: Bargaining power of suppliers - Impact of key factors in 2023 and 2028
- Exhibits28: Threat of new entrants - Impact of key factors in 2023 and 2028
- Exhibits29: Threat of substitutes - Impact of key factors in 2023 and 2028
- Exhibits30: Threat of rivalry - Impact of key factors in 2023 and 2028
- Exhibits31: Chart on Market condition - Five forces 2023 and 2028
- Exhibits32: Chart on Type - Market share 2023-2028 (%)
- Exhibits33: Data Table on Type - Market share 2023-2028 (%)
- Exhibits34: Chart on Comparison by Type
- Exhibits35: Data Table on Comparison by Type
- Exhibits36: Chart on Plastic greenhouse - Market size and forecast 2023-2028 ($ million)
- Exhibits37: Data Table on Plastic greenhouse - Market size and forecast 2023-2028 ($ million)
- Exhibits38: Chart on Plastic greenhouse - Year-over-year growth 2023-2028 (%)
- Exhibits39: Data Table on Plastic greenhouse - Year-over-year growth 2023-2028 (%)
- Exhibits40: Chart on Glass greenhouse - Market size and forecast 2023-2028 ($ million)
- Exhibits41: Data Table on Glass greenhouse - Market size and forecast 2023-2028 ($ million)
- Exhibits42: Chart on Glass greenhouse - Year-over-year growth 2023-2028 (%)
- Exhibits43: Data Table on Glass greenhouse - Year-over-year growth 2023-2028 (%)
- Exhibits44: Market opportunity by Type ($ million)
- Exhibits45: Data Table on Market opportunity by Type ($ million)
- Exhibits46: Chart on Product - Market share 2023-2028 (%)
- Exhibits47: Data Table on Product - Market share 2023-2028 (%)
- Exhibits48: Chart on Comparison by Product
- Exhibits49: Data Table on Comparison by Product
- Exhibits50: Chart on Fruits and vegetables - Market size and forecast 2023-2028 ($ million)
- Exhibits51: Data Table on Fruits and vegetables - Market size and forecast 2023-2028 ($ million)
- Exhibits52: Chart on Fruits and vegetables - Year-over-year growth 2023-2028 (%)
- Exhibits53: Data Table on Fruits and vegetables - Year-over-year growth 2023-2028 (%)
- Exhibits54: Chart on Flowers and ornamentals - Market size and forecast 2023-2028 ($ million)
- Exhibits55: Data Table on Flowers and ornamentals - Market size and forecast 2023-2028 ($ million)
- Exhibits56: Chart on Flowers and ornamentals - Year-over-year growth 2023-2028 (%)
- Exhibits57: Data Table on Flowers and ornamentals - Year-over-year growth 2023-2028 (%)
- Exhibits58: Chart on Nursery crops - Market size and forecast 2023-2028 ($ million)
- Exhibits59: Data Table on Nursery crops - Market size and forecast 2023-2028 ($ million)
- Exhibits60: Chart on Nursery crops - Year-over-year growth 2023-2028 (%)
- Exhibits61: Data Table on Nursery crops - Year-over-year growth 2023-2028 (%)
- Exhibits62: Market opportunity by Product ($ million)
- Exhibits63: Data Table on Market opportunity by Product ($ million)
- Exhibits64: Analysis of price sensitivity, lifecycle, customer purchase basket, adoption rates, and purchase criteria
- Exhibits65: Chart on Market share By Geographical Landscape 2023-2028 (%)
- Exhibits66: Data Table on Market share By Geographical Landscape 2023-2028 (%)
- Exhibits67: Chart on Geographic comparison
- Exhibits68: Data Table on Geographic comparison
- Exhibits69: Chart on North America - Market size and forecast 2023-2028 ($ million)
- Exhibits70: Data Table on North America - Market size and forecast 2023-2028 ($ million)
- Exhibits71: Chart on North America - Year-over-year growth 2023-2028 (%)
- Exhibits72: Data Table on North America - Year-over-year growth 2023-2028 (%)
- Exhibits73: Chart on Europe - Market size and forecast 2023-2028 ($ million)
- Exhibits74: Data Table on Europe - Market size and forecast 2023-2028 ($ million)
- Exhibits75: Chart on Europe - Year-over-year growth 2023-2028 (%)
- Exhibits76: Data Table on Europe - Year-over-year growth 2023-2028 (%)
- Exhibits77: Chart on APAC - Market size and forecast 2023-2028 ($ million)
- Exhibits78: Data Table on APAC - Market size and forecast 2023-2028 ($ million)
- Exhibits79: Chart on APAC - Year-over-year growth 2023-2028 (%)
- Exhibits80: Data Table on APAC - Year-over-year growth 2023-2028 (%)
- Exhibits81: Chart on South America - Market size and forecast 2023-2028 ($ million)
- Exhibits82: Data Table on South America - Market size and forecast 2023-2028 ($ million)
- Exhibits83: Chart on South America - Year-over-year growth 2023-2028 (%)
- Exhibits84: Data Table on South America - Year-over-year growth 2023-2028 (%)
- Exhibits85: Chart on Middle East and Africa - Market size and forecast 2023-2028 ($ million)
- Exhibits86: Data Table on Middle East and Africa - Market size and forecast 2023-2028 ($ million)
- Exhibits87: Chart on Middle East and Africa - Year-over-year growth 2023-2028 (%)
- Exhibits88: Data Table on Middle East and Africa - Year-over-year growth 2023-2028 (%)
- Exhibits89: Chart on US - Market size and forecast 2023-2028 ($ million)
- Exhibits90: Data Table on US - Market size and forecast 2023-2028 ($ million)
- Exhibits91: Chart on US - Year-over-year growth 2023-2028 (%)
- Exhibits92: Data Table on US - Year-over-year growth 2023-2028 (%)
- Exhibits93: Chart on The Netherlands - Market size and forecast 2023-2028 ($ million)
- Exhibits94: Data Table on The Netherlands - Market size and forecast 2023-2028 ($ million)
- Exhibits95: Chart on The Netherlands - Year-over-year growth 2023-2028 (%)
- Exhibits96: Data Table on The Netherlands - Year-over-year growth 2023-2028 (%)
- Exhibits97: Chart on China - Market size and forecast 2023-2028 ($ million)
- Exhibits98: Data Table on China - Market size and forecast 2023-2028 ($ million)
- Exhibits99: Chart on China - Year-over-year growth 2023-2028 (%)
- Exhibits100: Data Table on China - Year-over-year growth 2023-2028 (%)
- Exhibits101: Chart on Germany - Market size and forecast 2023-2028 ($ million)
- Exhibits102: Data Table on Germany - Market size and forecast 2023-2028 ($ million)
- Exhibits103: Chart on Germany - Year-over-year growth 2023-2028 (%)
- Exhibits104: Data Table on Germany - Year-over-year growth 2023-2028 (%)
- Exhibits105: Chart on Spain - Market size and forecast 2023-2028 ($ million)
- Exhibits106: Data Table on Spain - Market size and forecast 2023-2028 ($ million)
- Exhibits107: Chart on Spain - Year-over-year growth 2023-2028 (%)
- Exhibits108: Data Table on Spain - Year-over-year growth 2023-2028 (%)
- Exhibits109: Market opportunity By Geographical Landscape ($ million)
- Exhibits110: Data Tables on Market opportunity By Geographical Landscape ($ million)
- Exhibits111: Impact of drivers and challenges in 2023 and 2028
- Exhibits112: Overview on criticality of inputs and factors of differentiation
- Exhibits113: Overview on factors of disruption
- Exhibits114: Impact of key risks on business
- Exhibits115: Companies covered
- Exhibits116: Matrix on companies position and classification
- Exhibits117: Agra Tech Inc. - Overview
- Exhibits118: Agra Tech Inc. - Product / Service
- Exhibits119: Agra Tech Inc. - Key offerings
- Exhibits120: Argus Control Systems Ltd. - Overview
- Exhibits121: Argus Control Systems Ltd. - Product / Service
- Exhibits122: Argus Control Systems Ltd. - Key offerings
- Exhibits123: Berry Global Inc. - Overview
- Exhibits124: Berry Global Inc. - Business segments
- Exhibits125: Berry Global Inc. - Key news
- Exhibits126: Berry Global Inc. - Key offerings
- Exhibits127: Berry Global Inc. - Segment focus
- Exhibits128: Certhon Build B.V. - Overview
- Exhibits129: Certhon Build B.V. - Product / Service
- Exhibits130: Certhon Build B.V. - Key offerings
- Exhibits131: Gibraltar Industries Inc. - Overview
- Exhibits132: Gibraltar Industries Inc. - Business segments
- Exhibits133: Gibraltar Industries Inc. - Key offerings
- Exhibits134: Gibraltar Industries Inc. - Segment focus
- Exhibits135: Heliospectra AB - Overview
- Exhibits136: Heliospectra AB - Product / Service
- Exhibits137: Heliospectra AB - Key offerings
- Exhibits138: International Greenhouse Contractors LLC - Overview
- Exhibits139: International Greenhouse Contractors LLC - Product / Service
- Exhibits140: International Greenhouse Contractors LLC - Key offerings
- Exhibits141: LOGIQS B.V. - Overview
- Exhibits142: LOGIQS B.V. - Product / Service
- Exhibits143: LOGIQS B.V. - Key offerings
- Exhibits144: PLASTIKA KRITIS SA - Overview
- Exhibits145: PLASTIKA KRITIS SA - Product / Service
- Exhibits146: PLASTIKA KRITIS SA - Key offerings
- Exhibits147: Prospiant Inc - Overview
- Exhibits148: Prospiant Inc - Product / Service
- Exhibits149: Prospiant Inc - Key offerings
- Exhibits150: Richel Group SAS - Overview
- Exhibits151: Richel Group SAS - Product / Service
- Exhibits152: Richel Group SAS - Key offerings
- Exhibits153: Signify NV - Overview
- Exhibits154: Signify NV - Business segments
- Exhibits155: Signify NV - Key news
- Exhibits156: Signify NV - Key offerings
- Exhibits157: Signify NV - Segment focus
- Exhibits158: Stuppy Greenhouse - Overview
- Exhibits159: Stuppy Greenhouse - Product / Service
- Exhibits160: Stuppy Greenhouse - Key offerings
- Exhibits161: The Glasshouse Company Pty Ltd. - Overview
- Exhibits162: The Glasshouse Company Pty Ltd. - Product / Service
- Exhibits163: The Glasshouse Company Pty Ltd. - Key offerings
- Exhibits164: Top Greenhouses Ltd. - Overview
- Exhibits165: Top Greenhouses Ltd. - Product / Service
- Exhibits166: Top Greenhouses Ltd. - Key offerings
- Exhibits167: Inclusions checklist
- Exhibits168: Exclusions checklist
- Exhibits169: Currency conversion rates for US$
- Exhibits170: Research methodology
- Exhibits171: Information sources
- Exhibits172: Data validation
- Exhibits173: Validation techniques employed for market sizing
- Exhibits174: Data synthesis
- Exhibits175: 360 degree market analysis
- Exhibits176: List of abbreviations
The commercial greenhouse market is forecasted to grow by USD 12769.5 mn during 2023-2028, accelerating at a CAGR of 11.53% during the forecast period. The report on the commercial greenhouse market provides a holistic analysis, market size and forecast, trends, growth drivers, and challenges, as well as vendor analysis covering around 25 vendors.
The report offers an up-to-date analysis regarding the current market scenario, the latest trends and drivers, and the overall market environment. The market is driven by improvements in co2 extraction technologies for greenhouses, increasing relevance of led growth lights in commercial greenhouses, and rising population leading to increasing demand for food.
Technavio's commercial greenhouse market is segmented as below:
| Market Scope | |
|---|---|
| Base Year | 2024 |
| End Year | 2028 |
| Series Year | 2024-2028 |
| Growth Momentum | Accelerate |
| YOY 2024 | 10.45% |
| CAGR | 11.53% |
| Incremental Value | $12769.5 mn |
By Type
- Plastic greenhouse
- Glass greenhouse
By Product
- Fruits and vegetables
- Flowers and ornamentals
- Nursery crops
By Geographical Landscape
- North America
- Europe
- APAC
- South America
- Middle East and Africa
This study identifies the government support for commercial greenhouse in developing economies as one of the prime reasons driving the commercial greenhouse market growth during the next few years. Also, rapid urbanization accelerating adoption of modern farming techniques and innovation and investments in commercial greenhouse startups will lead to sizable demand in the market.
The report on the commercial greenhouse market covers the following areas:
- Commercial greenhouse market sizing
- Commercial greenhouse market forecast
- Commercial greenhouse market industry analysis
The robust vendor analysis is designed to help clients improve their market position, and in line with this, this report provides a detailed analysis of several leading commercial greenhouse market vendors that include Agra Tech Inc., Argus Control Systems Ltd., Berry Global Inc., Certhon Build B.V., DeCloet Greenhouse Mfg. Ltd., Europrogress Srl, Gibraltar Industries Inc., Heliospectra AB, International Greenhouse Contractors LLC , LOGIQS B.V., Ludy Greenhouse Mfg. Corp., Luiten Greenhouses BV, PLASTIKA KRITIS SA, Prospiant Inc, Richel Group SAS, Saveer Biotech Ltd., Signify NV, Stuppy Greenhouse, The Glasshouse Company Pty Ltd., and Top Greenhouses Ltd.. Also, the commercial greenhouse market analysis report includes information on upcoming trends and challenges that will influence market growth. This is to help companies strategize and leverage all forthcoming growth opportunities.
The study was conducted using an objective combination of primary and secondary information including inputs from key participants in the industry. The report contains a comprehensive market and vendor landscape in addition to an analysis of the key vendors.
The publisher presents a detailed picture of the market by the way of study, synthesis, and summation of data from multiple sources by an analysis of key parameters such as profit, pricing, competition, and promotions. It presents various market facets by identifying the key industry influencers. The data presented is comprehensive, reliable, and a result of extensive research - both primary and secondary. The market research reports provide a complete competitive landscape and an in-depth vendor selection methodology and analysis using qualitative and quantitative research to forecast the accurate market growth.
Table of Contents
1 Executive Summary
- 1.1 Market overview
- Executive Summary - Chart on Market Overview
- Executive Summary - Data Table on Market Overview
- Executive Summary - Chart on Global Market Characteristics
- Executive Summary - Chart on Market By Geographical Landscape
- Executive Summary - Chart on Market Segmentation by Type
- Executive Summary - Chart on Market Segmentation by Product
- Executive Summary - Chart on Incremental Growth
- Executive Summary - Data Table on Incremental Growth
- Executive Summary - Chart on Company Market Positioning
2 Market Landscape
- 2.1 Market ecosystem
- Parent Market
- Data Table on - Parent Market
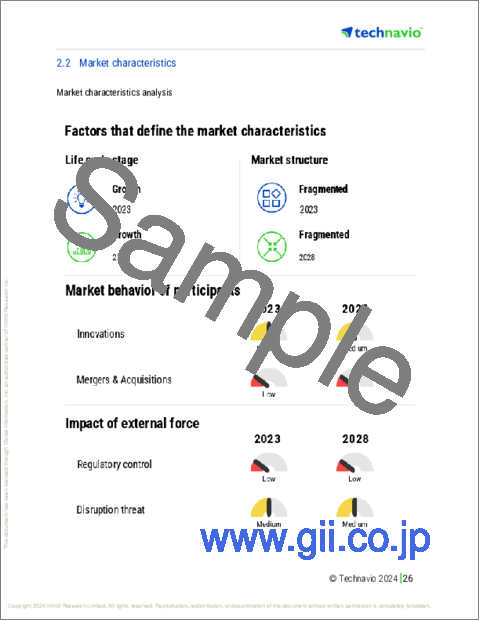
- 2.2 Market characteristics
- Market characteristics analysis
- 2.3 Value chain analysis
- Value Chain Analysis
3 Market Sizing
- 3.1 Market definition
- Offerings of companies included in the market definition
- 3.2 Market segment analysis
- Market segments
- 3.3 Market size 2023
- 3.4 Market outlook: Forecast for 2023-2028
- Chart on Global - Market size and forecast 2023-2028 ($ million)
- Data Table on Global - Market size and forecast 2023-2028 ($ million)
- Chart on Global Market: Year-over-year growth 2023-2028 (%)
- Data Table on Global Market: Year-over-year growth 2023-2028 (%)
4 Historic Market Size
- 4.1 Global Commercial Greenhouse Market 2018 - 2022
- Historic Market Size - Data Table on Global Commercial Greenhouse Market 2018 - 2022 ($ million)
- 4.2 Type segment analysis 2018 - 2022
- Historic Market Size - Type Segment 2018 - 2022 ($ million)
- 4.3 Product segment analysis 2018 - 2022
- Historic Market Size - Product Segment 2018 - 2022 ($ million)
- 4.4 Geography segment analysis 2018 - 2022
- Historic Market Size - Geography Segment 2018 - 2022 ($ million)
- 4.5 Country segment analysis 2018 - 2022
- Historic Market Size - Country Segment 2018 - 2022 ($ million)
5 Five Forces Analysis
- 5.1 Five forces summary
- Five forces analysis - Comparison between 2023 and 2028
- 5.2 Bargaining power of buyers
- Bargaining power of buyers - Impact of key factors 2023 and 2028
- 5.3 Bargaining power of suppliers
- Bargaining power of suppliers - Impact of key factors in 2023 and 2028
- 5.4 Threat of new entrants
- Threat of new entrants - Impact of key factors in 2023 and 2028
- 5.5 Threat of substitutes
- Threat of substitutes - Impact of key factors in 2023 and 2028
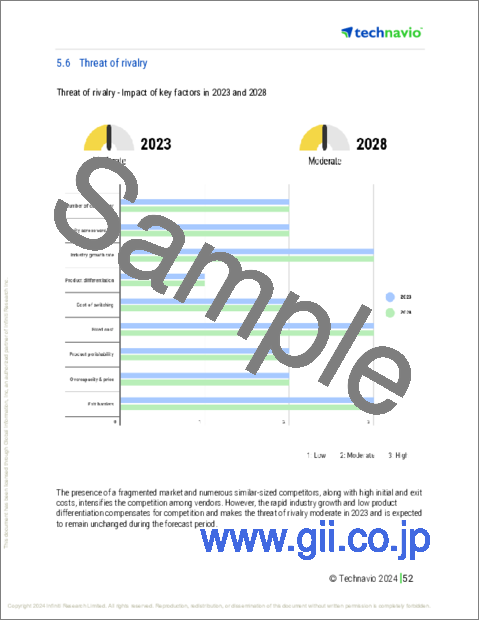
- 5.6 Threat of rivalry
- Threat of rivalry - Impact of key factors in 2023 and 2028
- 5.7 Market condition
- Chart on Market condition - Five forces 2023 and 2028
6 Market Segmentation by Type
- 6.1 Market segments
- Chart on Type - Market share 2023-2028 (%)
- Data Table on Type - Market share 2023-2028 (%)
- 6.2 Comparison by Type
- Chart on Comparison by Type
- Data Table on Comparison by Type
- 6.3 Plastic greenhouse - Market size and forecast 2023-2028
- Chart on Plastic greenhouse - Market size and forecast 2023-2028 ($ million)
- Data Table on Plastic greenhouse - Market size and forecast 2023-2028 ($ million)
- Chart on Plastic greenhouse - Year-over-year growth 2023-2028 (%)
- Data Table on Plastic greenhouse - Year-over-year growth 2023-2028 (%)
- 6.4 Glass greenhouse - Market size and forecast 2023-2028
- Chart on Glass greenhouse - Market size and forecast 2023-2028 ($ million)
- Data Table on Glass greenhouse - Market size and forecast 2023-2028 ($ million)
- Chart on Glass greenhouse - Year-over-year growth 2023-2028 (%)
- Data Table on Glass greenhouse - Year-over-year growth 2023-2028 (%)
- 6.5 Market opportunity by Type
- Market opportunity by Type ($ million)
- Data Table on Market opportunity by Type ($ million)
7 Market Segmentation by Product
- 7.1 Market segments
- Chart on Product - Market share 2023-2028 (%)
- Data Table on Product - Market share 2023-2028 (%)
- 7.2 Comparison by Product
- Chart on Comparison by Product
- Data Table on Comparison by Product
- 7.3 Fruits and vegetables - Market size and forecast 2023-2028
- Chart on Fruits and vegetables - Market size and forecast 2023-2028 ($ million)
- Data Table on Fruits and vegetables - Market size and forecast 2023-2028 ($ million)
- Chart on Fruits and vegetables - Year-over-year growth 2023-2028 (%)
- Data Table on Fruits and vegetables - Year-over-year growth 2023-2028 (%)
- 7.4 Flowers and ornamentals - Market size and forecast 2023-2028
- Chart on Flowers and ornamentals - Market size and forecast 2023-2028 ($ million)
- Data Table on Flowers and ornamentals - Market size and forecast 2023-2028 ($ million)
- Chart on Flowers and ornamentals - Year-over-year growth 2023-2028 (%)
- Data Table on Flowers and ornamentals - Year-over-year growth 2023-2028 (%)
- 7.5 Nursery crops - Market size and forecast 2023-2028
- Chart on Nursery crops - Market size and forecast 2023-2028 ($ million)
- Data Table on Nursery crops - Market size and forecast 2023-2028 ($ million)
- Chart on Nursery crops - Year-over-year growth 2023-2028 (%)
- Data Table on Nursery crops - Year-over-year growth 2023-2028 (%)
- 7.6 Market opportunity by Product
- Market opportunity by Product ($ million)
- Data Table on Market opportunity by Product ($ million)
8 Customer Landscape
- 8.1 Customer landscape overview
- Analysis of price sensitivity, lifecycle, customer purchase basket, adoption rates, and purchase criteria
9 Geographic Landscape
- 9.1 Geographic segmentation
- Chart on Market share By Geographical Landscape 2023-2028 (%)
- Data Table on Market share By Geographical Landscape 2023-2028 (%)
- 9.2 Geographic comparison
- Chart on Geographic comparison
- Data Table on Geographic comparison
- 9.3 North America - Market size and forecast 2023-2028
- Chart on North America - Market size and forecast 2023-2028 ($ million)
- Data Table on North America - Market size and forecast 2023-2028 ($ million)
- Chart on North America - Year-over-year growth 2023-2028 (%)
- Data Table on North America - Year-over-year growth 2023-2028 (%)
- 9.4 Europe - Market size and forecast 2023-2028
- Chart on Europe - Market size and forecast 2023-2028 ($ million)
- Data Table on Europe - Market size and forecast 2023-2028 ($ million)
- Chart on Europe - Year-over-year growth 2023-2028 (%)
- Data Table on Europe - Year-over-year growth 2023-2028 (%)
- 9.5 APAC - Market size and forecast 2023-2028
- Chart on APAC - Market size and forecast 2023-2028 ($ million)
- Data Table on APAC - Market size and forecast 2023-2028 ($ million)
- Chart on APAC - Year-over-year growth 2023-2028 (%)
- Data Table on APAC - Year-over-year growth 2023-2028 (%)
- 9.6 South America - Market size and forecast 2023-2028
- Chart on South America - Market size and forecast 2023-2028 ($ million)
- Data Table on South America - Market size and forecast 2023-2028 ($ million)
- Chart on South America - Year-over-year growth 2023-2028 (%)
- Data Table on South America - Year-over-year growth 2023-2028 (%)
- 9.7 Middle East and Africa - Market size and forecast 2023-2028
- Chart on Middle East and Africa - Market size and forecast 2023-2028 ($ million)
- Data Table on Middle East and Africa - Market size and forecast 2023-2028 ($ million)
- Chart on Middle East and Africa - Year-over-year growth 2023-2028 (%)
- Data Table on Middle East and Africa - Year-over-year growth 2023-2028 (%)
- 9.8 US - Market size and forecast 2023-2028
- Chart on US - Market size and forecast 2023-2028 ($ million)
- Data Table on US - Market size and forecast 2023-2028 ($ million)
- Chart on US - Year-over-year growth 2023-2028 (%)
- Data Table on US - Year-over-year growth 2023-2028 (%)
- 9.9 The Netherlands - Market size and forecast 2023-2028
- Chart on The Netherlands - Market size and forecast 2023-2028 ($ million)
- Data Table on The Netherlands - Market size and forecast 2023-2028 ($ million)
- Chart on The Netherlands - Year-over-year growth 2023-2028 (%)
- Data Table on The Netherlands - Year-over-year growth 2023-2028 (%)
- 9.10 China - Market size and forecast 2023-2028
- Chart on China - Market size and forecast 2023-2028 ($ million)
- Data Table on China - Market size and forecast 2023-2028 ($ million)
- Chart on China - Year-over-year growth 2023-2028 (%)
- Data Table on China - Year-over-year growth 2023-2028 (%)
- 9.11 Germany - Market size and forecast 2023-2028
- Chart on Germany - Market size and forecast 2023-2028 ($ million)
- Data Table on Germany - Market size and forecast 2023-2028 ($ million)
- Chart on Germany - Year-over-year growth 2023-2028 (%)
- Data Table on Germany - Year-over-year growth 2023-2028 (%)
- 9.12 Spain - Market size and forecast 2023-2028
- Chart on Spain - Market size and forecast 2023-2028 ($ million)
- Data Table on Spain - Market size and forecast 2023-2028 ($ million)
- Chart on Spain - Year-over-year growth 2023-2028 (%)
- Data Table on Spain - Year-over-year growth 2023-2028 (%)
- 9.13 Market opportunity By Geographical Landscape
- Market opportunity By Geographical Landscape ($ million)
- Data Tables on Market opportunity By Geographical Landscape ($ million)
10 Drivers, Challenges, and Opportunity/Restraints
- 10.1 Market drivers
- 10.2 Market challenges
- 10.3 Impact of drivers and challenges
- Impact of drivers and challenges in 2023 and 2028
- 10.4 Market opportunities/restraints
11 Competitive Landscape
- 11.1 Overview
- 11.2 Competitive Landscape
- Overview on criticality of inputs and factors of differentiation
- 11.3 Landscape disruption
- Overview on factors of disruption
- 11.4 Industry risks
- Impact of key risks on business
12 Competitive Analysis
- 12.1 Companies profiled
- Companies covered
- 12.2 Market positioning of companies
- Matrix on companies position and classification
- 12.3 Agra Tech Inc.
- Agra Tech Inc. - Overview
- Agra Tech Inc. - Product / Service
- Agra Tech Inc. - Key offerings
- 12.4 Argus Control Systems Ltd.
- Argus Control Systems Ltd. - Overview
- Argus Control Systems Ltd. - Product / Service
- Argus Control Systems Ltd. - Key offerings
- 12.5 Berry Global Inc.
- Berry Global Inc. - Overview
- Berry Global Inc. - Business segments
- Berry Global Inc. - Key news
- Berry Global Inc. - Key offerings
- Berry Global Inc. - Segment focus
- 12.6 Certhon Build B.V.
- Certhon Build B.V. - Overview
- Certhon Build B.V. - Product / Service
- Certhon Build B.V. - Key offerings
- 12.7 Gibraltar Industries Inc.
- Gibraltar Industries Inc. - Overview
- Gibraltar Industries Inc. - Business segments
- Gibraltar Industries Inc. - Key offerings
- Gibraltar Industries Inc. - Segment focus
- 12.8 Heliospectra AB
- Heliospectra AB - Overview
- Heliospectra AB - Product / Service
- Heliospectra AB - Key offerings
- 12.9 International Greenhouse Contractors LLC
- International Greenhouse Contractors LLC - Overview
- International Greenhouse Contractors LLC - Product / Service
- International Greenhouse Contractors LLC - Key offerings
- 12.10 LOGIQS B.V.
- LOGIQS B.V. - Overview
- LOGIQS B.V. - Product / Service
- LOGIQS B.V. - Key offerings
- 12.11 PLASTIKA KRITIS SA
- PLASTIKA KRITIS SA - Overview
- PLASTIKA KRITIS SA - Product / Service
- PLASTIKA KRITIS SA - Key offerings
- 12.12 Prospiant Inc
- Prospiant Inc - Overview
- Prospiant Inc - Product / Service
- Prospiant Inc - Key offerings
- 12.13 Richel Group SAS
- Richel Group SAS - Overview
- Richel Group SAS - Product / Service
- Richel Group SAS - Key offerings
- 12.14 Signify NV
- Signify NV - Overview
- Signify NV - Business segments
- Signify NV - Key news
- Signify NV - Key offerings
- Signify NV - Segment focus
- 12.15 Stuppy Greenhouse
- Stuppy Greenhouse - Overview
- Stuppy Greenhouse - Product / Service
- Stuppy Greenhouse - Key offerings
- 12.16 The Glasshouse Company Pty Ltd.
- The Glasshouse Company Pty Ltd. - Overview
- The Glasshouse Company Pty Ltd. - Product / Service
- The Glasshouse Company Pty Ltd. - Key offerings
- 12.17 Top Greenhouses Ltd.
- Top Greenhouses Ltd. - Overview
- Top Greenhouses Ltd. - Product / Service
- Top Greenhouses Ltd. - Key offerings
13 Appendix
- 13.1 Scope of the report
- 13.2 Inclusions and exclusions checklist
- Inclusions checklist
- Exclusions checklist
- 13.3 Currency conversion rates for US$
- Currency conversion rates for US$
- 13.4 Research methodology
- Research methodology
- 13.5 Data procurement
- Information sources
- 13.6 Data validation
- Data validation
- 13.7 Validation techniques employed for market sizing
- Validation techniques employed for market sizing
- 13.8 Data synthesis
- Data synthesis
- 360 degree market analysis
- 360 degree market analysis
- 13.10 List of abbreviations
- List of abbreviations

