|
|
市場調査レポート
商品コード
1525097
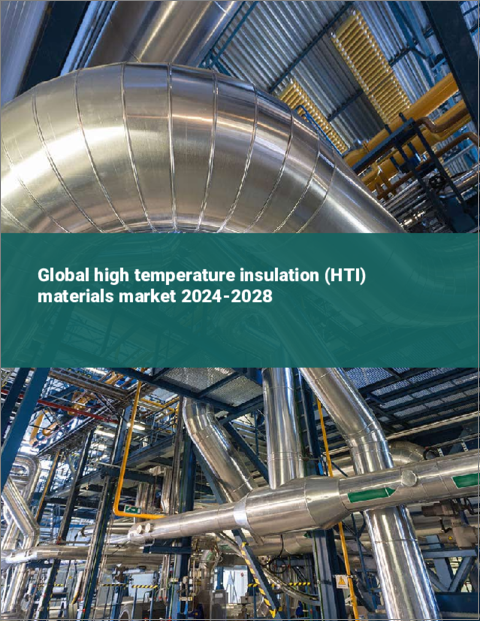
高温断熱材(HTI)の世界市場 2024-2028Global high temperature insulation (HTI) materials market 2024-2028 |
||||||
|
|||||||
カスタマイズ可能
|
|||||||


| 高温断熱材(HTI)の世界市場 2024-2028 |
|
出版日: 2024年07月12日
発行: TechNavio
ページ情報: 英文 177 Pages
納期: 即納可能
|

全表示
- 概要
- 図表
- 目次
高温断熱材(HTI)市場は2023-2028年に40億5,560万米ドル、予測期間中のCAGRは10.44%で成長すると予測されます。
当レポートでは、高温断熱材(HTI)市場の全体的な分析、市場規模・予測、動向、成長促進要因、課題、約25のベンダーを網羅したベンダー分析などを掲載しています。
現在の市場シナリオ、最新動向と促進要因、市場環境全体に関する最新分析を提供しています。市場は、セラミック使用の増加、アルミニウム需要の増加、鉄鋼生産能力の拡大によって牽引されています。
| 市場範囲 | |
|---|---|
| 基準年 | 2024 |
| 終了年 | 2028 |
| 予測期間 | 2024-2028 |
| 成長モメンタム | 加速 |
| 前年比2024年 | 8.64% |
| CAGR | 10.44% |
| 増分額 | 40億5,560万米ドル |
本調査では、今後数年間の高温断熱材(HTI)市場成長を牽引する主な要因の1つとして、環境に優しいHTI材料の採用が増加していることを挙げています。また、ベンダーによるM&A活動の増加や、軽量で高性能なHTI材料への需要の高まりも、市場の大きな需要につながると思われます。
目次
第1章 エグゼクティブサマリー
- 市場概要
第2章 市場情勢
- 市場エコシステム
- 市場の特徴
- バリューチェーン分析
第3章 市場規模の評価
- 市場の定義
- 市場セグメント分析
- 市場規模 2023
- 市場の見通し 2023-2028
第4章 市場規模実績
- 世界高温断熱材(HTI)市場 2018-2022
- エンドユーザー別セグメント分析 2018-2022
- 製品別セグメント分析 2018-2022
- 地域別セグメント分析 2018-2022
- 国別セグメント分析 2018-2022
第5章 ファイブフォース分析
- ファイブフォースの要約
- 買い手の交渉力
- 供給企業の交渉力
- 新規参入業者の脅威
- 代替品の脅威
- 競争の脅威
- 市況
第6章 市場セグメンテーション:エンドユーザー別
- 市場セグメンテーション
- 比較:エンドユーザー別
- 石油化学部門:市場規模と予測 2023-2028
- セラミックス部門:市場規模と予測 2023-2028
- アルミニウム産業:市場規模と予測 2023-2028
- その他:市場規模と予測 2023-2028
- 市場機会:エンドユーザー別
第7章 市場セグメンテーション:製品別
- 市場セグメンテーション
- 比較:製品別
- セラミック繊維:市場規模と予測 2023-2028
- 断熱耐火レンガ:市場規模と予測 2023-2028
- その他:市場規模と予測 2023-2028
- 市場機会:製品別
第8章 顧客情勢
- 顧客情勢の概要
第9章 地域別情勢
- 地域別セグメンテーション
- 地域別比較
- 欧州:市場規模と予測 2023-2028
- 北米:市場規模と予測 2023-2028
- アジア太平洋:市場規模と予測 2023-2028
- 南米:市場規模と予測 2023-2028
- 中東・アフリカ:市場規模と予測 2023-2028
- 米国:市場規模と予測 2023-2028
- ドイツ:市場規模と予測 2023-2028
- 中国:市場規模と予測 2023-2028
- フランス:市場規模と予測 2023-2028
- 日本:市場規模と予測 2023-2028
- 市場機会:地域情勢別
第10章 促進要因・課題・機会・抑制要因
- 市場促進要因
- 市場の課題
- 促進要因と課題の影響
- 市場の機会・抑制要因
第11章 競合情勢
- 概要
- 競合情勢
- 混乱の状況
- 業界のリスク
第12章 競合分析
- 企業プロファイル
- 企業の市場ポジショニング
- Almatis BV
- Armacell International SA
- Aspen Aerogels Inc.
- Etex NV
- IPCOM NV
- Luyang Energy saving Materials Co. Ltd.
- M.E. SCHUPP INDUSTRIEKERAMIK GMBH
- Mitsubishi Heavy Industries Ltd.
- Morgan Advanced Materials Plc
- Owens Corning
- Pyrotek Inc.
- Rath Aktiengesellschaft
- RHI Magnesita GmbH
- Unifrax I LLC
第13章 付録
Exhibits:
- Exhibits1: Executive Summary - Chart on Market Overview
- Exhibits2: Executive Summary - Data Table on Market Overview
- Exhibits3: Executive Summary - Chart on Global Market Characteristics
- Exhibits4: Executive Summary - Chart on Market By Geographical Landscape
- Exhibits5: Executive Summary - Chart on Market Segmentation by End-user
- Exhibits6: Executive Summary - Chart on Market Segmentation by Product
- Exhibits7: Executive Summary - Chart on Incremental Growth
- Exhibits8: Executive Summary - Data Table on Incremental Growth
- Exhibits9: Executive Summary - Chart on Company Market Positioning
- Exhibits10: Parent Market
- Exhibits11: Data Table on - Parent Market
- Exhibits12: Market characteristics analysis
- Exhibits13: Value Chain Analysis
- Exhibits14: Offerings of companies included in the market definition
- Exhibits15: Market segments
- Exhibits16: Chart on Global - Market size and forecast 2023-2028 ($ million)
- Exhibits17: Data Table on Global - Market size and forecast 2023-2028 ($ million)
- Exhibits18: Chart on Global Market: Year-over-year growth 2023-2028 (%)
- Exhibits19: Data Table on Global Market: Year-over-year growth 2023-2028 (%)
- Exhibits20: Historic Market Size - Data Table on Global High Temperature Insulation (HTI) Materials Market 2018 - 2022 ($ million)
- Exhibits21: Historic Market Size - End-user Segment 2018 - 2022 ($ million)
- Exhibits22: Historic Market Size - Product Segment 2018 - 2022 ($ million)
- Exhibits23: Historic Market Size - Geography Segment 2018 - 2022 ($ million)
- Exhibits24: Historic Market Size - Country Segment 2018 - 2022 ($ million)
- Exhibits25: Five forces analysis - Comparison between 2023 and 2028
- Exhibits26: Bargaining power of buyers - Impact of key factors 2023 and 2028
- Exhibits27: Bargaining power of suppliers - Impact of key factors in 2023 and 2028
- Exhibits28: Threat of new entrants - Impact of key factors in 2023 and 2028
- Exhibits29: Threat of substitutes - Impact of key factors in 2023 and 2028
- Exhibits30: Threat of rivalry - Impact of key factors in 2023 and 2028
- Exhibits31: Chart on Market condition - Five forces 2023 and 2028
- Exhibits32: Chart on End-user - Market share 2023-2028 (%)
- Exhibits33: Data Table on End-user - Market share 2023-2028 (%)
- Exhibits34: Chart on Comparison by End-user
- Exhibits35: Data Table on Comparison by End-user
- Exhibits36: Chart on Petrochemicals sector - Market size and forecast 2023-2028 ($ million)
- Exhibits37: Data Table on Petrochemicals sector - Market size and forecast 2023-2028 ($ million)
- Exhibits38: Chart on Petrochemicals sector - Year-over-year growth 2023-2028 (%)
- Exhibits39: Data Table on Petrochemicals sector - Year-over-year growth 2023-2028 (%)
- Exhibits40: Chart on Ceramics sector - Market size and forecast 2023-2028 ($ million)
- Exhibits41: Data Table on Ceramics sector - Market size and forecast 2023-2028 ($ million)
- Exhibits42: Chart on Ceramics sector - Year-over-year growth 2023-2028 (%)
- Exhibits43: Data Table on Ceramics sector - Year-over-year growth 2023-2028 (%)
- Exhibits44: Chart on Aluminum industry - Market size and forecast 2023-2028 ($ million)
- Exhibits45: Data Table on Aluminum industry - Market size and forecast 2023-2028 ($ million)
- Exhibits46: Chart on Aluminum industry - Year-over-year growth 2023-2028 (%)
- Exhibits47: Data Table on Aluminum industry - Year-over-year growth 2023-2028 (%)
- Exhibits48: Chart on Others - Market size and forecast 2023-2028 ($ million)
- Exhibits49: Data Table on Others - Market size and forecast 2023-2028 ($ million)
- Exhibits50: Chart on Others - Year-over-year growth 2023-2028 (%)
- Exhibits51: Data Table on Others - Year-over-year growth 2023-2028 (%)
- Exhibits52: Market opportunity by End-user ($ million)
- Exhibits53: Data Table on Market opportunity by End-user ($ million)
- Exhibits54: Chart on Product - Market share 2023-2028 (%)
- Exhibits55: Data Table on Product - Market share 2023-2028 (%)
- Exhibits56: Chart on Comparison by Product
- Exhibits57: Data Table on Comparison by Product
- Exhibits58: Chart on Ceramic fibers - Market size and forecast 2023-2028 ($ million)
- Exhibits59: Data Table on Ceramic fibers - Market size and forecast 2023-2028 ($ million)
- Exhibits60: Chart on Ceramic fibers - Year-over-year growth 2023-2028 (%)
- Exhibits61: Data Table on Ceramic fibers - Year-over-year growth 2023-2028 (%)
- Exhibits62: Chart on Insulating firebricks - Market size and forecast 2023-2028 ($ million)
- Exhibits63: Data Table on Insulating firebricks - Market size and forecast 2023-2028 ($ million)
- Exhibits64: Chart on Insulating firebricks - Year-over-year growth 2023-2028 (%)
- Exhibits65: Data Table on Insulating firebricks - Year-over-year growth 2023-2028 (%)
- Exhibits66: Chart on Others - Market size and forecast 2023-2028 ($ million)
- Exhibits67: Data Table on Others - Market size and forecast 2023-2028 ($ million)
- Exhibits68: Chart on Others - Year-over-year growth 2023-2028 (%)
- Exhibits69: Data Table on Others - Year-over-year growth 2023-2028 (%)
- Exhibits70: Market opportunity by Product ($ million)
- Exhibits71: Data Table on Market opportunity by Product ($ million)
- Exhibits72: Analysis of price sensitivity, lifecycle, customer purchase basket, adoption rates, and purchase criteria
- Exhibits73: Chart on Market share By Geographical Landscape 2023-2028 (%)
- Exhibits74: Data Table on Market share By Geographical Landscape 2023-2028 (%)
- Exhibits75: Chart on Geographic comparison
- Exhibits76: Data Table on Geographic comparison
- Exhibits77: Chart on Europe - Market size and forecast 2023-2028 ($ million)
- Exhibits78: Data Table on Europe - Market size and forecast 2023-2028 ($ million)
- Exhibits79: Chart on Europe - Year-over-year growth 2023-2028 (%)
- Exhibits80: Data Table on Europe - Year-over-year growth 2023-2028 (%)
- Exhibits81: Chart on North America - Market size and forecast 2023-2028 ($ million)
- Exhibits82: Data Table on North America - Market size and forecast 2023-2028 ($ million)
- Exhibits83: Chart on North America - Year-over-year growth 2023-2028 (%)
- Exhibits84: Data Table on North America - Year-over-year growth 2023-2028 (%)
- Exhibits85: Chart on APAC - Market size and forecast 2023-2028 ($ million)
- Exhibits86: Data Table on APAC - Market size and forecast 2023-2028 ($ million)
- Exhibits87: Chart on APAC - Year-over-year growth 2023-2028 (%)
- Exhibits88: Data Table on APAC - Year-over-year growth 2023-2028 (%)
- Exhibits89: Chart on South America - Market size and forecast 2023-2028 ($ million)
- Exhibits90: Data Table on South America - Market size and forecast 2023-2028 ($ million)
- Exhibits91: Chart on South America - Year-over-year growth 2023-2028 (%)
- Exhibits92: Data Table on South America - Year-over-year growth 2023-2028 (%)
- Exhibits93: Chart on Middle East and Africa - Market size and forecast 2023-2028 ($ million)
- Exhibits94: Data Table on Middle East and Africa - Market size and forecast 2023-2028 ($ million)
- Exhibits95: Chart on Middle East and Africa - Year-over-year growth 2023-2028 (%)
- Exhibits96: Data Table on Middle East and Africa - Year-over-year growth 2023-2028 (%)
- Exhibits97: Chart on US - Market size and forecast 2023-2028 ($ million)
- Exhibits98: Data Table on US - Market size and forecast 2023-2028 ($ million)
- Exhibits99: Chart on US - Year-over-year growth 2023-2028 (%)
- Exhibits100: Data Table on US - Year-over-year growth 2023-2028 (%)
- Exhibits101: Chart on Germany - Market size and forecast 2023-2028 ($ million)
- Exhibits102: Data Table on Germany - Market size and forecast 2023-2028 ($ million)
- Exhibits103: Chart on Germany - Year-over-year growth 2023-2028 (%)
- Exhibits104: Data Table on Germany - Year-over-year growth 2023-2028 (%)
- Exhibits105: Chart on China - Market size and forecast 2023-2028 ($ million)
- Exhibits106: Data Table on China - Market size and forecast 2023-2028 ($ million)
- Exhibits107: Chart on China - Year-over-year growth 2023-2028 (%)
- Exhibits108: Data Table on China - Year-over-year growth 2023-2028 (%)
- Exhibits109: Chart on France - Market size and forecast 2023-2028 ($ million)
- Exhibits110: Data Table on France - Market size and forecast 2023-2028 ($ million)
- Exhibits111: Chart on France - Year-over-year growth 2023-2028 (%)
- Exhibits112: Data Table on France - Year-over-year growth 2023-2028 (%)
- Exhibits113: Chart on Japan - Market size and forecast 2023-2028 ($ million)
- Exhibits114: Data Table on Japan - Market size and forecast 2023-2028 ($ million)
- Exhibits115: Chart on Japan - Year-over-year growth 2023-2028 (%)
- Exhibits116: Data Table on Japan - Year-over-year growth 2023-2028 (%)
- Exhibits117: Market opportunity By Geographical Landscape ($ million)
- Exhibits118: Data Tables on Market opportunity By Geographical Landscape ($ million)
- Exhibits119: Impact of drivers and challenges in 2023 and 2028
- Exhibits120: Overview on criticality of inputs and factors of differentiation
- Exhibits121: Overview on factors of disruption
- Exhibits122: Impact of key risks on business
- Exhibits123: Companies covered
- Exhibits124: Matrix on companies position and classification
- Exhibits125: 3M Co. - Overview
- Exhibits126: 3M Co. - Business segments
- Exhibits127: 3M Co. - Key news
- Exhibits128: 3M Co. - Key offerings
- Exhibits129: 3M Co. - Segment focus
- Exhibits130: Almatis BV - Overview
- Exhibits131: Almatis BV - Product / Service
- Exhibits132: Almatis BV - Key offerings
- Exhibits133: Armacell International SA - Overview
- Exhibits134: Armacell International SA - Product / Service
- Exhibits135: Armacell International SA - Key offerings
- Exhibits136: Aspen Aerogels Inc. - Overview
- Exhibits137: Aspen Aerogels Inc. - Product / Service
- Exhibits138: Aspen Aerogels Inc. - Key offerings
- Exhibits139: Etex NV - Overview
- Exhibits140: Etex NV - Business segments
- Exhibits141: Etex NV - Key offerings
- Exhibits142: Etex NV - Segment focus
- Exhibits143: IPCOM NV - Overview
- Exhibits144: IPCOM NV - Product / Service
- Exhibits145: IPCOM NV - Key offerings
- Exhibits146: Luyang Energy saving Materials Co. Ltd. - Overview
- Exhibits147: Luyang Energy saving Materials Co. Ltd. - Product / Service
- Exhibits148: Luyang Energy saving Materials Co. Ltd. - Key offerings
- Exhibits149: M.E. SCHUPP INDUSTRIEKERAMIK GMBH - Overview
- Exhibits150: M.E. SCHUPP INDUSTRIEKERAMIK GMBH - Product / Service
- Exhibits151: M.E. SCHUPP INDUSTRIEKERAMIK GMBH - Key offerings
- Exhibits152: Mitsubishi Heavy Industries Ltd. - Overview
- Exhibits153: Mitsubishi Heavy Industries Ltd. - Business segments
- Exhibits154: Mitsubishi Heavy Industries Ltd. - Key news
- Exhibits155: Mitsubishi Heavy Industries Ltd. - Key offerings
- Exhibits156: Mitsubishi Heavy Industries Ltd. - Segment focus
- Exhibits157: Morgan Advanced Materials Plc - Overview
- Exhibits158: Morgan Advanced Materials Plc - Product / Service
- Exhibits159: Morgan Advanced Materials Plc - Key offerings
- Exhibits160: Owens Corning - Overview
- Exhibits161: Owens Corning - Business segments
- Exhibits162: Owens Corning - Key news
- Exhibits163: Owens Corning - Key offerings
- Exhibits164: Owens Corning - Segment focus
- Exhibits165: Pyrotek Inc. - Overview
- Exhibits166: Pyrotek Inc. - Product / Service
- Exhibits167: Pyrotek Inc. - Key offerings
- Exhibits168: Rath Aktiengesellschaft - Overview
- Exhibits169: Rath Aktiengesellschaft - Product / Service
- Exhibits170: Rath Aktiengesellschaft - Key offerings
- Exhibits171: RHI Magnesita GmbH - Overview
- Exhibits172: RHI Magnesita GmbH - Business segments
- Exhibits173: RHI Magnesita GmbH - Key news
- Exhibits174: RHI Magnesita GmbH - Key offerings
- Exhibits175: RHI Magnesita GmbH - Segment focus
- Exhibits176: Unifrax I LLC - Overview
- Exhibits177: Unifrax I LLC - Product / Service
- Exhibits178: Unifrax I LLC - Key offerings
- Exhibits179: Inclusions checklist
- Exhibits180: Exclusions checklist
- Exhibits181: Currency conversion rates for US$
- Exhibits182: Research methodology
- Exhibits183: Information sources
- Exhibits184: Data validation
- Exhibits185: Validation techniques employed for market sizing
- Exhibits186: Data synthesis
- Exhibits187: 360 degree market analysis
- Exhibits188: List of abbreviations
The high temperature insulation (HTI) materials market is forecasted to grow by USD 4055.6 mn during 2023-2028, accelerating at a CAGR of 10.44% during the forecast period. The report on the high temperature insulation (HTI) materials market provides a holistic analysis, market size and forecast, trends, growth drivers, and challenges, as well as vendor analysis covering around 25 vendors.
The report offers an up-to-date analysis regarding the current market scenario, the latest trends and drivers, and the overall market environment. The market is driven by increasing use of ceramic, increasing demand for aluminum, and expansion of steel production capacity.
Technavio's high temperature insulation (HTI) materials market is segmented as below:
| Market Scope | |
|---|---|
| Base Year | 2024 |
| End Year | 2028 |
| Series Year | 2024-2028 |
| Growth Momentum | Accelerate |
| YOY 2024 | 8.64% |
| CAGR | 10.44% |
| Incremental Value | $4055.6mn |
By End-user
- Petrochemicals sector
- Ceramics sector
- Aluminum industry
- Others
By Product
- Ceramic fibers
- Insulating firebricks
- Others
By Geographical Landscape
- Europe
- North America
- APAC
- South America
- Middle East and Africa
This study identifies the increasing adoption of eco-friendly HTI materials as one of the prime reasons driving the high temperature insulation (HTI) materials market growth during the next few years. Also, increasing m and a activities by vendors and increasing demand for lightweight and high-performance HTI materials will lead to sizable demand in the market.
The report on the high temperature insulation (HTI) materials market covers the following areas:
- High temperature insulation (HTI) materials market sizing
- High temperature insulation (HTI) materials market forecast
- High temperature insulation (HTI) materials market industry analysis
The robust vendor analysis is designed to help clients improve their market position, and in line with this, this report provides a detailed analysis of several leading high temperature insulation (HTI) materials market vendors that include 3M Co., Almatis BV, Armacell International SA, Aspen Aerogels Inc., CARCO PRECISION RUBBER PRODUCTS S.P.A, Etex NV, Firwin Corp., Hi Temp Insulation Inc., IPCOM NV, James Walker Group Ltd., Luyang Energy saving Materials Co. Ltd., M.E. SCHUPP INDUSTRIEKERAMIK GMBH, Mitsubishi Heavy Industries Ltd., Morgan Advanced Materials PLC, Owens Corning, Pyrotek Inc., Rath Aktiengesellschaft, RHI Magnesita GmbH, Shinagawa Refractories Co. Ltd., and Unifrax I LLC. Also, the high temperature insulation (HTI) materials market analysis report includes information on upcoming trends and challenges that will influence market growth. This is to help companies strategize and leverage all forthcoming growth opportunities.
The study was conducted using an objective combination of primary and secondary information including inputs from key participants in the industry. The report contains a comprehensive market and vendor landscape in addition to an analysis of the key vendors.
The publisher presents a detailed picture of the market by the way of study, synthesis, and summation of data from multiple sources by an analysis of key parameters such as profit, pricing, competition, and promotions. It presents various market facets by identifying the key industry influencers. The data presented is comprehensive, reliable, and a result of extensive research - both primary and secondary. The market research reports provide a complete competitive landscape and an in-depth vendor selection methodology and analysis using qualitative and quantitative research to forecast the accurate market growth.
Table of Contents
1 Executive Summary
- 1.1 Market overview
- Executive Summary - Chart on Market Overview
- Executive Summary - Data Table on Market Overview
- Executive Summary - Chart on Global Market Characteristics
- Executive Summary - Chart on Market By Geographical Landscape
- Executive Summary - Chart on Market Segmentation by End-user
- Executive Summary - Chart on Market Segmentation by Product
- Executive Summary - Chart on Incremental Growth
- Executive Summary - Data Table on Incremental Growth
- Executive Summary - Chart on Company Market Positioning
2 Market Landscape
- 2.1 Market ecosystem
- Parent Market
- Data Table on - Parent Market
- 2.2 Market characteristics
- Market characteristics analysis
- 2.3 Value chain analysis
- Value Chain Analysis
3 Market Sizing
- 3.1 Market definition
- Offerings of companies included in the market definition
- 3.2 Market segment analysis
- Market segments
- 3.3 Market size 2023
- 3.4 Market outlook: Forecast for 2023-2028
- Chart on Global - Market size and forecast 2023-2028 ($ million)
- Data Table on Global - Market size and forecast 2023-2028 ($ million)
- Chart on Global Market: Year-over-year growth 2023-2028 (%)
- Data Table on Global Market: Year-over-year growth 2023-2028 (%)
4 Historic Market Size
- 4.1 Global High Temperature Insulation (HTI) Materials Market 2018 - 2022
- Historic Market Size - Data Table on Global High Temperature Insulation (HTI) Materials Market 2018 - 2022 ($ million)
- 4.2 End-user segment analysis 2018 - 2022
- Historic Market Size - End-user Segment 2018 - 2022 ($ million)
- 4.3 Product segment analysis 2018 - 2022
- Historic Market Size - Product Segment 2018 - 2022 ($ million)
- 4.4 Geography segment analysis 2018 - 2022
- Historic Market Size - Geography Segment 2018 - 2022 ($ million)
- 4.5 Country segment analysis 2018 - 2022
- Historic Market Size - Country Segment 2018 - 2022 ($ million)
5 Five Forces Analysis
- 5.1 Five forces summary
- Five forces analysis - Comparison between 2023 and 2028
- 5.2 Bargaining power of buyers
- Bargaining power of buyers - Impact of key factors 2023 and 2028
- 5.3 Bargaining power of suppliers
- Bargaining power of suppliers - Impact of key factors in 2023 and 2028
- 5.4 Threat of new entrants
- Threat of new entrants - Impact of key factors in 2023 and 2028
- 5.5 Threat of substitutes
- Threat of substitutes - Impact of key factors in 2023 and 2028
- 5.6 Threat of rivalry
- Threat of rivalry - Impact of key factors in 2023 and 2028
- 5.7 Market condition
- Chart on Market condition - Five forces 2023 and 2028
6 Market Segmentation by End-user
- 6.1 Market segments
- Chart on End-user - Market share 2023-2028 (%)
- Data Table on End-user - Market share 2023-2028 (%)
- 6.2 Comparison by End-user
- Chart on Comparison by End-user
- Data Table on Comparison by End-user
- 6.3 Petrochemicals sector - Market size and forecast 2023-2028
- Chart on Petrochemicals sector - Market size and forecast 2023-2028 ($ million)
- Data Table on Petrochemicals sector - Market size and forecast 2023-2028 ($ million)
- Chart on Petrochemicals sector - Year-over-year growth 2023-2028 (%)
- Data Table on Petrochemicals sector - Year-over-year growth 2023-2028 (%)
- 6.4 Ceramics sector - Market size and forecast 2023-2028
- Chart on Ceramics sector - Market size and forecast 2023-2028 ($ million)
- Data Table on Ceramics sector - Market size and forecast 2023-2028 ($ million)
- Chart on Ceramics sector - Year-over-year growth 2023-2028 (%)
- Data Table on Ceramics sector - Year-over-year growth 2023-2028 (%)
- 6.5 Aluminum industry - Market size and forecast 2023-2028
- Chart on Aluminum industry - Market size and forecast 2023-2028 ($ million)
- Data Table on Aluminum industry - Market size and forecast 2023-2028 ($ million)
- Chart on Aluminum industry - Year-over-year growth 2023-2028 (%)
- Data Table on Aluminum industry - Year-over-year growth 2023-2028 (%)
- 6.6 Others - Market size and forecast 2023-2028
- Chart on Others - Market size and forecast 2023-2028 ($ million)
- Data Table on Others - Market size and forecast 2023-2028 ($ million)
- Chart on Others - Year-over-year growth 2023-2028 (%)
- Data Table on Others - Year-over-year growth 2023-2028 (%)
- 6.7 Market opportunity by End-user
- Market opportunity by End-user ($ million)
- Data Table on Market opportunity by End-user ($ million)
7 Market Segmentation by Product
- 7.1 Market segments
- Chart on Product - Market share 2023-2028 (%)
- Data Table on Product - Market share 2023-2028 (%)
- 7.2 Comparison by Product
- Chart on Comparison by Product
- Data Table on Comparison by Product
- 7.3 Ceramic fibers - Market size and forecast 2023-2028
- Chart on Ceramic fibers - Market size and forecast 2023-2028 ($ million)
- Data Table on Ceramic fibers - Market size and forecast 2023-2028 ($ million)
- Chart on Ceramic fibers - Year-over-year growth 2023-2028 (%)
- Data Table on Ceramic fibers - Year-over-year growth 2023-2028 (%)
- 7.4 Insulating firebricks - Market size and forecast 2023-2028
- Chart on Insulating firebricks - Market size and forecast 2023-2028 ($ million)
- Data Table on Insulating firebricks - Market size and forecast 2023-2028 ($ million)
- Chart on Insulating firebricks - Year-over-year growth 2023-2028 (%)
- Data Table on Insulating firebricks - Year-over-year growth 2023-2028 (%)
- 7.5 Others - Market size and forecast 2023-2028
- Chart on Others - Market size and forecast 2023-2028 ($ million)
- Data Table on Others - Market size and forecast 2023-2028 ($ million)
- Chart on Others - Year-over-year growth 2023-2028 (%)
- Data Table on Others - Year-over-year growth 2023-2028 (%)
- 7.6 Market opportunity by Product
- Market opportunity by Product ($ million)
- Data Table on Market opportunity by Product ($ million)
8 Customer Landscape
- 8.1 Customer landscape overview
- Analysis of price sensitivity, lifecycle, customer purchase basket, adoption rates, and purchase criteria
9 Geographic Landscape
- 9.1 Geographic segmentation
- Chart on Market share By Geographical Landscape 2023-2028 (%)
- Data Table on Market share By Geographical Landscape 2023-2028 (%)
- 9.2 Geographic comparison
- Chart on Geographic comparison
- Data Table on Geographic comparison
- 9.3 Europe - Market size and forecast 2023-2028
- Chart on Europe - Market size and forecast 2023-2028 ($ million)
- Data Table on Europe - Market size and forecast 2023-2028 ($ million)
- Chart on Europe - Year-over-year growth 2023-2028 (%)
- Data Table on Europe - Year-over-year growth 2023-2028 (%)
- 9.4 North America - Market size and forecast 2023-2028
- Chart on North America - Market size and forecast 2023-2028 ($ million)
- Data Table on North America - Market size and forecast 2023-2028 ($ million)
- Chart on North America - Year-over-year growth 2023-2028 (%)
- Data Table on North America - Year-over-year growth 2023-2028 (%)
- 9.5 APAC - Market size and forecast 2023-2028
- Chart on APAC - Market size and forecast 2023-2028 ($ million)
- Data Table on APAC - Market size and forecast 2023-2028 ($ million)
- Chart on APAC - Year-over-year growth 2023-2028 (%)
- Data Table on APAC - Year-over-year growth 2023-2028 (%)
- 9.6 South America - Market size and forecast 2023-2028
- Chart on South America - Market size and forecast 2023-2028 ($ million)
- Data Table on South America - Market size and forecast 2023-2028 ($ million)
- Chart on South America - Year-over-year growth 2023-2028 (%)
- Data Table on South America - Year-over-year growth 2023-2028 (%)
- 9.7 Middle East and Africa - Market size and forecast 2023-2028
- Chart on Middle East and Africa - Market size and forecast 2023-2028 ($ million)
- Data Table on Middle East and Africa - Market size and forecast 2023-2028 ($ million)
- Chart on Middle East and Africa - Year-over-year growth 2023-2028 (%)
- Data Table on Middle East and Africa - Year-over-year growth 2023-2028 (%)
- 9.8 US - Market size and forecast 2023-2028
- Chart on US - Market size and forecast 2023-2028 ($ million)
- Data Table on US - Market size and forecast 2023-2028 ($ million)
- Chart on US - Year-over-year growth 2023-2028 (%)
- Data Table on US - Year-over-year growth 2023-2028 (%)
- 9.9 Germany - Market size and forecast 2023-2028
- Chart on Germany - Market size and forecast 2023-2028 ($ million)
- Data Table on Germany - Market size and forecast 2023-2028 ($ million)
- Chart on Germany - Year-over-year growth 2023-2028 (%)
- Data Table on Germany - Year-over-year growth 2023-2028 (%)
- 9.10 China - Market size and forecast 2023-2028
- Chart on China - Market size and forecast 2023-2028 ($ million)
- Data Table on China - Market size and forecast 2023-2028 ($ million)
- Chart on China - Year-over-year growth 2023-2028 (%)
- Data Table on China - Year-over-year growth 2023-2028 (%)
- 9.11 France - Market size and forecast 2023-2028
- Chart on France - Market size and forecast 2023-2028 ($ million)
- Data Table on France - Market size and forecast 2023-2028 ($ million)
- Chart on France - Year-over-year growth 2023-2028 (%)
- Data Table on France - Year-over-year growth 2023-2028 (%)
- 9.12 Japan - Market size and forecast 2023-2028
- Chart on Japan - Market size and forecast 2023-2028 ($ million)
- Data Table on Japan - Market size and forecast 2023-2028 ($ million)
- Chart on Japan - Year-over-year growth 2023-2028 (%)
- Data Table on Japan - Year-over-year growth 2023-2028 (%)
- 9.13 Market opportunity By Geographical Landscape
- Market opportunity By Geographical Landscape ($ million)
- Data Tables on Market opportunity By Geographical Landscape ($ million)
10 Drivers, Challenges, and Opportunity/Restraints
- 10.1 Market drivers
- 10.2 Market challenges
- 10.3 Impact of drivers and challenges
- Impact of drivers and challenges in 2023 and 2028
- 10.4 Market opportunities/restraints
11 Competitive Landscape
- 11.1 Overview
- 11.2 Competitive Landscape
- Overview on criticality of inputs and factors of differentiation
- 11.3 Landscape disruption
- Overview on factors of disruption
- 11.4 Industry risks
- Impact of key risks on business
12 Competitive Analysis
- 12.1 Companies profiled
- Companies covered
- 12.2 Market positioning of companies
- Matrix on companies position and classification
- 3M Co.
- 3M Co. - Overview
- 3M Co. - Business segments
- 3M Co. - Key news
- 3M Co. - Key offerings
- 3M Co. - Segment focus
- 12.4 Almatis BV
- Almatis BV - Overview
- Almatis BV - Product / Service
- Almatis BV - Key offerings
- 12.5 Armacell International SA
- Armacell International SA - Overview
- Armacell International SA - Product / Service
- Armacell International SA - Key offerings
- 12.6 Aspen Aerogels Inc.
- Aspen Aerogels Inc. - Overview
- Aspen Aerogels Inc. - Product / Service
- Aspen Aerogels Inc. - Key offerings
- 12.7 Etex NV
- Etex NV - Overview
- Etex NV - Business segments
- Etex NV - Key offerings
- Etex NV - Segment focus
- 12.8 IPCOM NV
- IPCOM NV - Overview
- IPCOM NV - Product / Service
- IPCOM NV - Key offerings
- 12.9 Luyang Energy saving Materials Co. Ltd.
- Luyang Energy saving Materials Co. Ltd. - Overview
- Luyang Energy saving Materials Co. Ltd. - Product / Service
- Luyang Energy saving Materials Co. Ltd. - Key offerings
- 12.10 M.E. SCHUPP INDUSTRIEKERAMIK GMBH
- M.E. SCHUPP INDUSTRIEKERAMIK GMBH - Overview
- M.E. SCHUPP INDUSTRIEKERAMIK GMBH - Product / Service
- M.E. SCHUPP INDUSTRIEKERAMIK GMBH - Key offerings
- 12.11 Mitsubishi Heavy Industries Ltd.
- Mitsubishi Heavy Industries Ltd. - Overview
- Mitsubishi Heavy Industries Ltd. - Business segments
- Mitsubishi Heavy Industries Ltd. - Key news
- Mitsubishi Heavy Industries Ltd. - Key offerings
- Mitsubishi Heavy Industries Ltd. - Segment focus
- 12.12 Morgan Advanced Materials Plc
- Morgan Advanced Materials Plc - Overview
- Morgan Advanced Materials Plc - Product / Service
- Morgan Advanced Materials Plc - Key offerings
- 12.13 Owens Corning
- Owens Corning - Overview
- Owens Corning - Business segments
- Owens Corning - Key news
- Owens Corning - Key offerings
- Owens Corning - Segment focus
- 12.14 Pyrotek Inc.
- Pyrotek Inc. - Overview
- Pyrotek Inc. - Product / Service
- Pyrotek Inc. - Key offerings
- 12.15 Rath Aktiengesellschaft
- Rath Aktiengesellschaft - Overview
- Rath Aktiengesellschaft - Product / Service
- Rath Aktiengesellschaft - Key offerings
- 12.16 RHI Magnesita GmbH
- RHI Magnesita GmbH - Overview
- RHI Magnesita GmbH - Business segments
- RHI Magnesita GmbH - Key news
- RHI Magnesita GmbH - Key offerings
- RHI Magnesita GmbH - Segment focus
- 12.17 Unifrax I LLC
- Unifrax I LLC - Overview
- Unifrax I LLC - Product / Service
- Unifrax I LLC - Key offerings
13 Appendix
- 13.1 Scope of the report
- 13.2 Inclusions and exclusions checklist
- Inclusions checklist
- Exclusions checklist
- 13.3 Currency conversion rates for US$
- Currency conversion rates for US$
- 13.4 Research methodology
- Research methodology
- 13.5 Data procurement
- Information sources
- 13.6 Data validation
- Data validation
- 13.7 Validation techniques employed for market sizing
- Validation techniques employed for market sizing
- 13.8 Data synthesis
- Data synthesis
- 13.9 360 degree market analysis
- 360 degree market analysis
- 13.10 List of abbreviations
- List of abbreviations
