|
|
市場調査レポート
商品コード
1524901
医薬品ろ過の世界市場 2024-2028Global pharmaceutical filtration market 2024-2028 |
||||||

|
|||||||
カスタマイズ可能
|
|||||||

| 医薬品ろ過の世界市場 2024-2028 |
|
出版日: 2024年07月09日
発行: TechNavio
ページ情報: 英文 168 Pages
納期: 即納可能
|

全表示
- 概要
- 図表
- 目次
医薬品ろ過市場は、2023-2028年に116億1,420万米ドル、予測期間中のCAGRは10.87%で成長すると予測されています。
当レポートでは、医薬品ろ過市場の全体的な分析、市場規模・予測、動向、成長促進要因、課題、約25のベンダーを網羅したベンダー分析などを掲載しています。
現在の市場シナリオ、最新動向と促進要因、市場環境全体に関する最新分析を提供しています。市場は、政府のヘルスケア支出による研究開発需要の増加、医薬品の上市数の増加、慢性疾患の有病率の増加が牽引しています。
| 市場範囲 | |
|---|---|
| 基準年 | 2024 |
| 終了年 | 2028 |
| 予測期間 | 2024-2028 |
| 成長モメンタム | 加速 |
| 前年比2024年 | 9.53% |
| CAGR | 10.87% |
| 増分額 | 116億1,420万米ドル |
本調査では、今後数年間の医薬品ろ過市場成長を牽引する主な要因の一つとして、米国FDA認可製造施設の増加を挙げています。また、製薬企業数の増加、製薬産業の成長、新興経済諸国が提供する高いポテンシャルが市場の大きな需要につながります。
目次
第1章 エグゼクティブサマリー
- 市場概要
第2章 市場情勢
- 市場エコシステム
- 市場の特徴
- バリューチェーン分析
第3章 市場規模の評価
- 市場の定義
- 市場セグメント分析
- 市場規模 2023
- 市場の見通し 2023-2028
第4章 市場規模実績
- 世界医薬品ろ過市場 2018-2022
- タイプ別セグメント分析 2018-2022
- 技術別セグメント分析 2018-2022
- 地域別セグメント分析 2018-2022
- 国別セグメント分析 2018-2022
第5章 ファイブフォース分析
- ファイブフォースの要約
- 買い手の交渉力
- 供給企業の交渉力
- 新規参入業者の脅威
- 代替品の脅威
- 競争の脅威
- 市況
第6章 市場セグメンテーション:タイプ別
- 市場セグメンテーション
- 比較:タイプ別
- 滅菌済み:市場規模と予測 2023-2028
- 非滅菌:市場規模と予測 2023-2028
- 市場機会:タイプ別
第7章 市場セグメンテーション:技術別
- 市場セグメンテーション
- 比較:技術別
- 精密濾過:市場規模と予測 2023-2028
- 限外濾過:市場規模と予測 2023-2028
- ナノ濾過:市場規模と予測 2023-2028
- その他:市場規模と予測 2023-2028
- 市場機会:技術別
第8章 顧客情勢
- 顧客情勢の概要
第9章 地域別情勢
- 地域別セグメンテーション
- 地域別比較
- 北米:市場規模と予測 2023-2028
- 欧州:市場規模と予測 2023-2028
- アジア:市場規模と予測 2023-2028
- 世界のその他の地域:市場規模と予測 2023-2028
- 米国:市場規模と予測 2023-2028
- ドイツ:市場規模と予測 2023-2028
- 中国:市場規模と予測 2023-2028
- 日本:市場規模と予測 2023-2028
- カナダ:市場規模と予測 2023-2028
- 市場機会:地域情勢別
第10章 促進要因・課題・機会・抑制要因
- 市場促進要因
- 市場の課題
- 促進要因と課題の影響
- 市場の機会・抑制要因
第11章 競合情勢
- 概要
- 競合情勢
- 混乱の状況
- 業界のリスク
第12章 競合分析
- 企業プロファイル
- 企業の市場ポジショニング
- Amazon Filters Ltd.
- Danaher Corp.
- Donaldson Co. Inc.
- Eaton Corp. Plc
- General Electric Co.
- Graver Technologies LLC
- Meissner Filtration Products Inc.
- Merck KGaA
- Parker Hannifin Corp.
- Porvair Plc
- Repligen Corp.
- Samsung Electronics Co. Ltd.
- Sartorius AG
- Tetra Laval SA
- Thermo Fisher Scientific Inc.
第13章 付録
Exhibits:
- Exhibits1: Executive Summary - Chart on Market Overview
- Exhibits2: Executive Summary - Data Table on Market Overview
- Exhibits3: Executive Summary - Chart on Global Market Characteristics
- Exhibits4: Executive Summary - Chart on Market By Geographical Landscape
- Exhibits5: Executive Summary - Chart on Market Segmentation by Type
- Exhibits6: Executive Summary - Chart on Market Segmentation by Technique
- Exhibits7: Executive Summary - Chart on Incremental Growth
- Exhibits8: Executive Summary - Data Table on Incremental Growth
- Exhibits9: Executive Summary - Chart on Company Market Positioning
- Exhibits10: Parent Market
- Exhibits11: Data Table on - Parent Market
- Exhibits12: Market characteristics analysis
- Exhibits13: Value Chain Analysis
- Exhibits14: Offerings of companies included in the market definition
- Exhibits15: Market segments
- Exhibits16: Chart on Global - Market size and forecast 2023-2028 ($ million)
- Exhibits17: Data Table on Global - Market size and forecast 2023-2028 ($ million)
- Exhibits18: Chart on Global Market: Year-over-year growth 2023-2028 (%)
- Exhibits19: Data Table on Global Market: Year-over-year growth 2023-2028 (%)
- Exhibits20: Historic Market Size - Data Table on Global Pharmaceutical Filtration Market 2018 - 2022 ($ million)
- Exhibits21: Historic Market Size - Type Segment 2018 - 2022 ($ million)
- Exhibits22: Historic Market Size - Technique Segment 2018 - 2022 ($ million)
- Exhibits23: Historic Market Size - Geography Segment 2018 - 2022 ($ million)
- Exhibits24: Historic Market Size - Country Segment 2018 - 2022 ($ million)
- Exhibits25: Five forces analysis - Comparison between 2023 and 2028
- Exhibits26: Bargaining power of buyers - Impact of key factors 2023 and 2028
- Exhibits27: Bargaining power of suppliers - Impact of key factors in 2023 and 2028
- Exhibits28: Threat of new entrants - Impact of key factors in 2023 and 2028
- Exhibits29: Threat of substitutes - Impact of key factors in 2023 and 2028
- Exhibits30: Threat of rivalry - Impact of key factors in 2023 and 2028
- Exhibits31: Chart on Market condition - Five forces 2023 and 2028
- Exhibits32: Chart on Type - Market share 2023-2028 (%)
- Exhibits33: Data Table on Type - Market share 2023-2028 (%)
- Exhibits34: Chart on Comparison by Type
- Exhibits35: Data Table on Comparison by Type
- Exhibits36: Chart on Sterile - Market size and forecast 2023-2028 ($ million)
- Exhibits37: Data Table on Sterile - Market size and forecast 2023-2028 ($ million)
- Exhibits38: Chart on Sterile - Year-over-year growth 2023-2028 (%)
- Exhibits39: Data Table on Sterile - Year-over-year growth 2023-2028 (%)
- Exhibits40: Chart on Non-sterile - Market size and forecast 2023-2028 ($ million)
- Exhibits41: Data Table on Non-sterile - Market size and forecast 2023-2028 ($ million)
- Exhibits42: Chart on Non-sterile - Year-over-year growth 2023-2028 (%)
- Exhibits43: Data Table on Non-sterile - Year-over-year growth 2023-2028 (%)
- Exhibits44: Market opportunity by Type ($ million)
- Exhibits45: Data Table on Market opportunity by Type ($ million)
- Exhibits46: Chart on Technique - Market share 2023-2028 (%)
- Exhibits47: Data Table on Technique - Market share 2023-2028 (%)
- Exhibits48: Chart on Comparison by Technique
- Exhibits49: Data Table on Comparison by Technique
- Exhibits50: Chart on Microfiltration - Market size and forecast 2023-2028 ($ million)
- Exhibits51: Data Table on Microfiltration - Market size and forecast 2023-2028 ($ million)
- Exhibits52: Chart on Microfiltration - Year-over-year growth 2023-2028 (%)
- Exhibits53: Data Table on Microfiltration - Year-over-year growth 2023-2028 (%)
- Exhibits54: Chart on Ultrafiltration - Market size and forecast 2023-2028 ($ million)
- Exhibits55: Data Table on Ultrafiltration - Market size and forecast 2023-2028 ($ million)
- Exhibits56: Chart on Ultrafiltration - Year-over-year growth 2023-2028 (%)
- Exhibits57: Data Table on Ultrafiltration - Year-over-year growth 2023-2028 (%)
- Exhibits58: Chart on Nanofiltration - Market size and forecast 2023-2028 ($ million)
- Exhibits59: Data Table on Nanofiltration - Market size and forecast 2023-2028 ($ million)
- Exhibits60: Chart on Nanofiltration - Year-over-year growth 2023-2028 (%)
- Exhibits61: Data Table on Nanofiltration - Year-over-year growth 2023-2028 (%)
- Exhibits62: Chart on Others - Market size and forecast 2023-2028 ($ million)
- Exhibits63: Data Table on Others - Market size and forecast 2023-2028 ($ million)
- Exhibits64: Chart on Others - Year-over-year growth 2023-2028 (%)
- Exhibits65: Data Table on Others - Year-over-year growth 2023-2028 (%)
- Exhibits66: Market opportunity by Technique ($ million)
- Exhibits67: Data Table on Market opportunity by Technique ($ million)
- Exhibits68: Analysis of price sensitivity, lifecycle, customer purchase basket, adoption rates, and purchase criteria
- Exhibits69: Chart on Market share By Geographical Landscape 2023-2028 (%)
- Exhibits70: Data Table on Market share By Geographical Landscape 2023-2028 (%)
- Exhibits71: Chart on Geographic comparison
- Exhibits72: Data Table on Geographic comparison
- Exhibits73: Chart on North America - Market size and forecast 2023-2028 ($ million)
- Exhibits74: Data Table on North America - Market size and forecast 2023-2028 ($ million)
- Exhibits75: Chart on North America - Year-over-year growth 2023-2028 (%)
- Exhibits76: Data Table on North America - Year-over-year growth 2023-2028 (%)
- Exhibits77: Chart on Europe - Market size and forecast 2023-2028 ($ million)
- Exhibits78: Data Table on Europe - Market size and forecast 2023-2028 ($ million)
- Exhibits79: Chart on Europe - Year-over-year growth 2023-2028 (%)
- Exhibits80: Data Table on Europe - Year-over-year growth 2023-2028 (%)
- Exhibits81: Chart on Asia - Market size and forecast 2023-2028 ($ million)
- Exhibits82: Data Table on Asia - Market size and forecast 2023-2028 ($ million)
- Exhibits83: Chart on Asia - Year-over-year growth 2023-2028 (%)
- Exhibits84: Data Table on Asia - Year-over-year growth 2023-2028 (%)
- Exhibits85: Chart on Rest of World (ROW) - Market size and forecast 2023-2028 ($ million)
- Exhibits86: Data Table on Rest of World (ROW) - Market size and forecast 2023-2028 ($ million)
- Exhibits87: Chart on Rest of World (ROW) - Year-over-year growth 2023-2028 (%)
- Exhibits88: Data Table on Rest of World (ROW) - Year-over-year growth 2023-2028 (%)
- Exhibits89: Chart on US - Market size and forecast 2023-2028 ($ million)
- Exhibits90: Data Table on US - Market size and forecast 2023-2028 ($ million)
- Exhibits91: Chart on US - Year-over-year growth 2023-2028 (%)
- Exhibits92: Data Table on US - Year-over-year growth 2023-2028 (%)
- Exhibits93: Chart on Germany - Market size and forecast 2023-2028 ($ million)
- Exhibits94: Data Table on Germany - Market size and forecast 2023-2028 ($ million)
- Exhibits95: Chart on Germany - Year-over-year growth 2023-2028 (%)
- Exhibits96: Data Table on Germany - Year-over-year growth 2023-2028 (%)
- Exhibits97: Chart on China - Market size and forecast 2023-2028 ($ million)
- Exhibits98: Data Table on China - Market size and forecast 2023-2028 ($ million)
- Exhibits99: Chart on China - Year-over-year growth 2023-2028 (%)
- Exhibits100: Data Table on China - Year-over-year growth 2023-2028 (%)
- Exhibits101: Chart on Japan - Market size and forecast 2023-2028 ($ million)
- Exhibits102: Data Table on Japan - Market size and forecast 2023-2028 ($ million)
- Exhibits103: Chart on Japan - Year-over-year growth 2023-2028 (%)
- Exhibits104: Data Table on Japan - Year-over-year growth 2023-2028 (%)
- Exhibits105: Chart on Canada - Market size and forecast 2023-2028 ($ million)
- Exhibits106: Data Table on Canada - Market size and forecast 2023-2028 ($ million)
- Exhibits107: Chart on Canada - Year-over-year growth 2023-2028 (%)
- Exhibits108: Data Table on Canada - Year-over-year growth 2023-2028 (%)
- Exhibits109: Market opportunity By Geographical Landscape ($ million)
- Exhibits110: Data Tables on Market opportunity By Geographical Landscape ($ million)
- Exhibits111: Impact of drivers and challenges in 2023 and 2028
- Exhibits112: Overview on criticality of inputs and factors of differentiation
- Exhibits113: Overview on factors of disruption
- Exhibits114: Impact of key risks on business
- Exhibits115: Companies covered
- Exhibits116: Matrix on companies position and classification
- Exhibits117: Amazon Filters Ltd. - Overview
- Exhibits118: Amazon Filters Ltd. - Product / Service
- Exhibits119: Amazon Filters Ltd. - Key offerings
- Exhibits120: Danaher Corp. - Overview
- Exhibits121: Danaher Corp. - Business segments
- Exhibits122: Danaher Corp. - Key news
- Exhibits123: Danaher Corp. - Key offerings
- Exhibits124: Danaher Corp. - Segment focus
- Exhibits125: Donaldson Co. Inc. - Overview
- Exhibits126: Donaldson Co. Inc. - Business segments
- Exhibits127: Donaldson Co. Inc. - Key news
- Exhibits128: Donaldson Co. Inc. - Key offerings
- Exhibits129: Donaldson Co. Inc. - Segment focus
- Exhibits130: Eaton Corp. Plc - Overview
- Exhibits131: Eaton Corp. Plc - Business segments
- Exhibits132: Eaton Corp. Plc - Key news
- Exhibits133: Eaton Corp. Plc - Key offerings
- Exhibits134: Eaton Corp. Plc - Segment focus
- Exhibits135: General Electric Co. - Overview
- Exhibits136: General Electric Co. - Business segments
- Exhibits137: General Electric Co. - Key news
- Exhibits138: General Electric Co. - Key offerings
- Exhibits139: General Electric Co. - Segment focus
- Exhibits140: Graver Technologies LLC - Overview
- Exhibits141: Graver Technologies LLC - Product / Service
- Exhibits142: Graver Technologies LLC - Key offerings
- Exhibits143: Meissner Filtration Products Inc. - Overview
- Exhibits144: Meissner Filtration Products Inc. - Product / Service
- Exhibits145: Meissner Filtration Products Inc. - Key offerings
- Exhibits146: Merck KGaA - Overview
- Exhibits147: Merck KGaA - Business segments
- Exhibits148: Merck KGaA - Key news
- Exhibits149: Merck KGaA - Key offerings
- Exhibits150: Merck KGaA - Segment focus
- Exhibits151: Parker Hannifin Corp. - Overview
- Exhibits152: Parker Hannifin Corp. - Business segments
- Exhibits153: Parker Hannifin Corp. - Key news
- Exhibits154: Parker Hannifin Corp. - Key offerings
- Exhibits155: Parker Hannifin Corp. - Segment focus
- Exhibits156: Porvair Plc - Overview
- Exhibits157: Porvair Plc - Product / Service
- Exhibits158: Porvair Plc - Key offerings
- Exhibits159: Repligen Corp. - Overview
- Exhibits160: Repligen Corp. - Product / Service
- Exhibits161: Repligen Corp. - Key offerings
- Exhibits162: Samsung Electronics Co. Ltd. - Overview
- Exhibits163: Samsung Electronics Co. Ltd. - Business segments
- Exhibits164: Samsung Electronics Co. Ltd. - Key news
- Exhibits165: Samsung Electronics Co. Ltd. - Key offerings
- Exhibits166: Samsung Electronics Co. Ltd. - Segment focus
- Exhibits167: Sartorius AG - Overview
- Exhibits168: Sartorius AG - Business segments
- Exhibits169: Sartorius AG - Key news
- Exhibits170: Sartorius AG - Key offerings
- Exhibits171: Sartorius AG - Segment focus
- Exhibits172: Tetra Laval SA - Overview
- Exhibits173: Tetra Laval SA - Product / Service
- Exhibits174: Tetra Laval SA - Key news
- Exhibits175: Tetra Laval SA - Key offerings
- Exhibits176: Thermo Fisher Scientific Inc. - Overview
- Exhibits177: Thermo Fisher Scientific Inc. - Business segments
- Exhibits178: Thermo Fisher Scientific Inc. - Key news
- Exhibits179: Thermo Fisher Scientific Inc. - Key offerings
- Exhibits180: Thermo Fisher Scientific Inc. - Segment focus
- Exhibits181: Inclusions checklist
- Exhibits182: Exclusions checklist
- Exhibits183: Currency conversion rates for US$
- Exhibits184: Research methodology
- Exhibits185: Information sources
- Exhibits186: Data validation
- Exhibits187: Validation techniques employed for market sizing
- Exhibits188: Data synthesis
- Exhibits189: 360 degree market analysis
- Exhibits190: List of abbreviations
The pharmaceutical filtration market is forecasted to grow by USD 11614.2 mn during 2023-2028, accelerating at a CAGR of 10.87% during the forecast period. The report on the pharmaceutical filtration market provides a holistic analysis, market size and forecast, trends, growth drivers, and challenges, as well as vendor analysis covering around 25 vendors.
The report offers an up-to-date analysis regarding the current market scenario, the latest trends and drivers, and the overall market environment. The market is driven by increasing demand for r and d due to government healthcare expenditure, increasing number of drug launches for medicines, and increase in prevalence of chronic diseases.
Technavio's pharmaceutical filtration market is segmented as below:
| Market Scope | |
|---|---|
| Base Year | 2024 |
| End Year | 2028 |
| Series Year | 2024-2028 |
| Growth Momentum | Accelerate |
| YOY 2024 | 9.53% |
| CAGR | 10.87% |
| Incremental Value | $11614.2mn |
By Type
- Sterile
- Non-sterile
By Technique
- Microfiltration
- Ultrafiltration
- Nanofiltration
- Others
By Geographical Landscape
- North America
- Europe
- Asia
- Rest of World (ROW)
This study identifies the increasing number of usfda-approved manufacturing facilities as one of the prime reasons driving the pharmaceutical filtration market growth during the next few years. Also, increase in number of pharmaceutical companies and growing pharmaceutical industry and high potential offered by developing economies will lead to sizable demand in the market.
The report on the pharmaceutical filtration market covers the following areas:
- Pharmaceutical filtration market sizing
- Pharmaceutical filtration market forecast
- Pharmaceutical filtration market industry analysis
The robust vendor analysis is designed to help clients improve their market position, and in line with this, this report provides a detailed analysis of several leading pharmaceutical filtration market vendors that include Amazon Filters Ltd., Danaher Corp., Donaldson Co. Inc., Eaton Corp. Plc, ErtelAlsop, Freudenberg Filtration Technologies GmbH and Co. KG, General Electric Co., Graver Technologies LLC, KASAG Swiss AG, MANN HUMMEL International GmbH and Co. KG, Meissner Filtration Products Inc., Merck KGaA, MMS AG, Parker Hannifin Corp., Porvair Plc, Repligen Corp., Samsung Electronics Co. Ltd., Sartorius AG, Tetra Laval SA, and Thermo Fisher Scientific Inc.. Also, the pharmaceutical filtration market analysis report includes information on upcoming trends and challenges that will influence market growth. This is to help companies strategize and leverage all forthcoming growth opportunities.
The study was conducted using an objective combination of primary and secondary information including inputs from key participants in the industry. The report contains a comprehensive market and vendor landscape in addition to an analysis of the key vendors.
The publisher presents a detailed picture of the market by the way of study, synthesis, and summation of data from multiple sources by an analysis of key parameters such as profit, pricing, competition, and promotions. It presents various market facets by identifying the key industry influencers. The data presented is comprehensive, reliable, and a result of extensive research - both primary and secondary. The market research reports provide a complete competitive landscape and an in-depth vendor selection methodology and analysis using qualitative and quantitative research to forecast the accurate market growth.
Table of Contents
1 Executive Summary
- 1.1 Market overview
- Executive Summary - Chart on Market Overview
- Executive Summary - Data Table on Market Overview
- Executive Summary - Chart on Global Market Characteristics
- Executive Summary - Chart on Market By Geographical Landscape
- Executive Summary - Chart on Market Segmentation by Type
- Executive Summary - Chart on Market Segmentation by Technique
- Executive Summary - Chart on Incremental Growth
- Executive Summary - Data Table on Incremental Growth
- Executive Summary - Chart on Company Market Positioning
2 Market Landscape
- 2.1 Market ecosystem
- Parent Market
- Data Table on - Parent Market
- 2.2 Market characteristics
- Market characteristics analysis
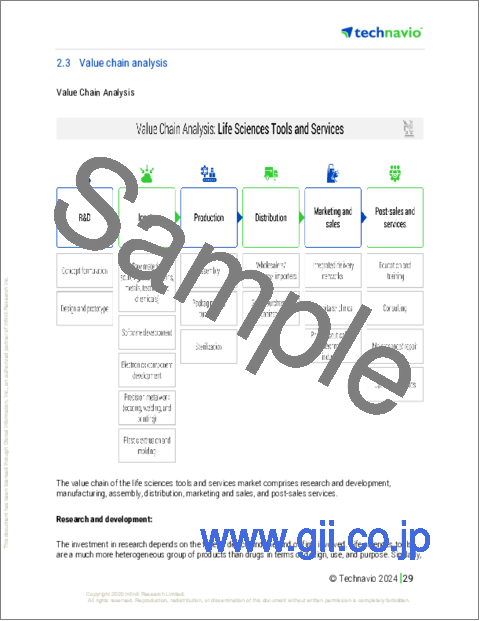
- 2.3 Value chain analysis
- Value Chain Analysis
3 Market Sizing
- 3.1 Market definition
- Offerings of companies included in the market definition
- 3.2 Market segment analysis
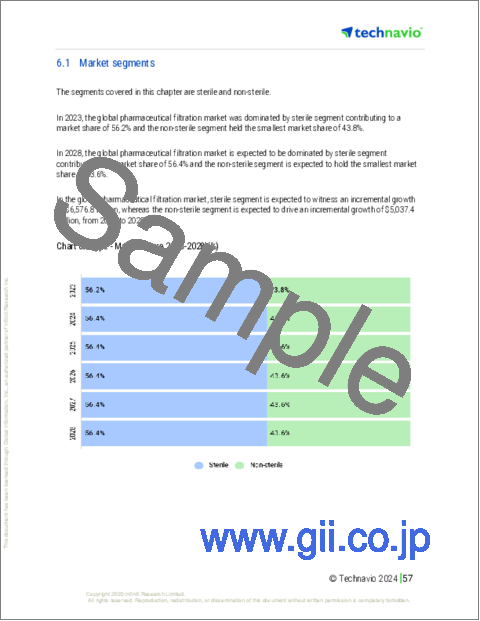
- Market segments
- 3.3 Market size 2023
- 3.4 Market outlook: Forecast for 2023-2028
- Chart on Global - Market size and forecast 2023-2028 ($ million)
- Data Table on Global - Market size and forecast 2023-2028 ($ million)
- Chart on Global Market: Year-over-year growth 2023-2028 (%)
- Data Table on Global Market: Year-over-year growth 2023-2028 (%)
4 Historic Market Size
- 4.1 Global Pharmaceutical Filtration Market 2018 - 2022
- Historic Market Size - Data Table on Global Pharmaceutical Filtration Market 2018 - 2022 ($ million)
- 4.2 Type segment analysis 2018 - 2022
- Historic Market Size - Type Segment 2018 - 2022 ($ million)
- 4.3 Technique segment analysis 2018 - 2022
- Historic Market Size - Technique Segment 2018 - 2022 ($ million)
- 4.4 Geography segment analysis 2018 - 2022
- Historic Market Size - Geography Segment 2018 - 2022 ($ million)
- 4.5 Country segment analysis 2018 - 2022
- Historic Market Size - Country Segment 2018 - 2022 ($ million)
5 Five Forces Analysis
- 5.1 Five forces summary
- Five forces analysis - Comparison between 2023 and 2028
- 5.2 Bargaining power of buyers
- Bargaining power of buyers - Impact of key factors 2023 and 2028
- 5.3 Bargaining power of suppliers
- Bargaining power of suppliers - Impact of key factors in 2023 and 2028
- 5.4 Threat of new entrants
- Threat of new entrants - Impact of key factors in 2023 and 2028
- 5.5 Threat of substitutes
- Threat of substitutes - Impact of key factors in 2023 and 2028
- 5.6 Threat of rivalry
- Threat of rivalry - Impact of key factors in 2023 and 2028
- 5.7 Market condition
- Chart on Market condition - Five forces 2023 and 2028
6 Market Segmentation by Type
- 6.1 Market segments
- Chart on Type - Market share 2023-2028 (%)
- Data Table on Type - Market share 2023-2028 (%)
- 6.2 Comparison by Type
- Chart on Comparison by Type
- Data Table on Comparison by Type
- 6.3 Sterile - Market size and forecast 2023-2028
- Chart on Sterile - Market size and forecast 2023-2028 ($ million)
- Data Table on Sterile - Market size and forecast 2023-2028 ($ million)
- Chart on Sterile - Year-over-year growth 2023-2028 (%)
- Data Table on Sterile - Year-over-year growth 2023-2028 (%)
- 6.4 Non-sterile - Market size and forecast 2023-2028
- Chart on Non-sterile - Market size and forecast 2023-2028 ($ million)
- Data Table on Non-sterile - Market size and forecast 2023-2028 ($ million)
- Chart on Non-sterile - Year-over-year growth 2023-2028 (%)
- Data Table on Non-sterile - Year-over-year growth 2023-2028 (%)
- 6.5 Market opportunity by Type
- Market opportunity by Type ($ million)
- Data Table on Market opportunity by Type ($ million)
7 Market Segmentation by Technique
- 7.1 Market segments
- Chart on Technique - Market share 2023-2028 (%)
- Data Table on Technique - Market share 2023-2028 (%)
- 7.2 Comparison by Technique
- Chart on Comparison by Technique
- Data Table on Comparison by Technique
- 7.3 Microfiltration - Market size and forecast 2023-2028
- Chart on Microfiltration - Market size and forecast 2023-2028 ($ million)
- Data Table on Microfiltration - Market size and forecast 2023-2028 ($ million)
- Chart on Microfiltration - Year-over-year growth 2023-2028 (%)
- Data Table on Microfiltration - Year-over-year growth 2023-2028 (%)
- 7.4 Ultrafiltration - Market size and forecast 2023-2028
- Chart on Ultrafiltration - Market size and forecast 2023-2028 ($ million)
- Data Table on Ultrafiltration - Market size and forecast 2023-2028 ($ million)
- Chart on Ultrafiltration - Year-over-year growth 2023-2028 (%)
- Data Table on Ultrafiltration - Year-over-year growth 2023-2028 (%)
- 7.5 Nanofiltration - Market size and forecast 2023-2028
- Chart on Nanofiltration - Market size and forecast 2023-2028 ($ million)
- Data Table on Nanofiltration - Market size and forecast 2023-2028 ($ million)
- Chart on Nanofiltration - Year-over-year growth 2023-2028 (%)
- Data Table on Nanofiltration - Year-over-year growth 2023-2028 (%)
- 7.6 Others - Market size and forecast 2023-2028
- Chart on Others - Market size and forecast 2023-2028 ($ million)
- Data Table on Others - Market size and forecast 2023-2028 ($ million)
- Chart on Others - Year-over-year growth 2023-2028 (%)
- Data Table on Others - Year-over-year growth 2023-2028 (%)
- 7.7 Market opportunity by Technique
- Market opportunity by Technique ($ million)
- Data Table on Market opportunity by Technique ($ million)
8 Customer Landscape
- 8.1 Customer landscape overview
- Analysis of price sensitivity, lifecycle, customer purchase basket, adoption rates, and purchase criteria
9 Geographic Landscape
- 9.1 Geographic segmentation
- Chart on Market share By Geographical Landscape 2023-2028 (%)
- Data Table on Market share By Geographical Landscape 2023-2028 (%)
- 9.2 Geographic comparison
- Chart on Geographic comparison
- Data Table on Geographic comparison
- 9.3 North America - Market size and forecast 2023-2028
- Chart on North America - Market size and forecast 2023-2028 ($ million)
- Data Table on North America - Market size and forecast 2023-2028 ($ million)
- Chart on North America - Year-over-year growth 2023-2028 (%)
- Data Table on North America - Year-over-year growth 2023-2028 (%)
- 9.4 Europe - Market size and forecast 2023-2028
- Chart on Europe - Market size and forecast 2023-2028 ($ million)
- Data Table on Europe - Market size and forecast 2023-2028 ($ million)
- Chart on Europe - Year-over-year growth 2023-2028 (%)
- Data Table on Europe - Year-over-year growth 2023-2028 (%)
- 9.5 Asia - Market size and forecast 2023-2028
- Chart on Asia - Market size and forecast 2023-2028 ($ million)
- Data Table on Asia - Market size and forecast 2023-2028 ($ million)
- Chart on Asia - Year-over-year growth 2023-2028 (%)
- Data Table on Asia - Year-over-year growth 2023-2028 (%)
- 9.6 Rest of World (ROW) - Market size and forecast 2023-2028
- Chart on Rest of World (ROW) - Market size and forecast 2023-2028 ($ million)
- Data Table on Rest of World (ROW) - Market size and forecast 2023-2028 ($ million)
- Chart on Rest of World (ROW) - Year-over-year growth 2023-2028 (%)
- Data Table on Rest of World (ROW) - Year-over-year growth 2023-2028 (%)
- 9.7 US - Market size and forecast 2023-2028
- Chart on US - Market size and forecast 2023-2028 ($ million)
- Data Table on US - Market size and forecast 2023-2028 ($ million)
- Chart on US - Year-over-year growth 2023-2028 (%)
- Data Table on US - Year-over-year growth 2023-2028 (%)
- 9.8 Germany - Market size and forecast 2023-2028
- Chart on Germany - Market size and forecast 2023-2028 ($ million)
- Data Table on Germany - Market size and forecast 2023-2028 ($ million)
- Chart on Germany - Year-over-year growth 2023-2028 (%)
- Data Table on Germany - Year-over-year growth 2023-2028 (%)
- 9.9 China - Market size and forecast 2023-2028
- Chart on China - Market size and forecast 2023-2028 ($ million)
- Data Table on China - Market size and forecast 2023-2028 ($ million)
- Chart on China - Year-over-year growth 2023-2028 (%)
- Data Table on China - Year-over-year growth 2023-2028 (%)
- 9.10 Japan - Market size and forecast 2023-2028
- Chart on Japan - Market size and forecast 2023-2028 ($ million)
- Data Table on Japan - Market size and forecast 2023-2028 ($ million)
- Chart on Japan - Year-over-year growth 2023-2028 (%)
- Data Table on Japan - Year-over-year growth 2023-2028 (%)
- 9.11 Canada - Market size and forecast 2023-2028
- Chart on Canada - Market size and forecast 2023-2028 ($ million)
- Data Table on Canada - Market size and forecast 2023-2028 ($ million)
- Chart on Canada - Year-over-year growth 2023-2028 (%)
- Data Table on Canada - Year-over-year growth 2023-2028 (%)
- 9.12 Market opportunity By Geographical Landscape
- Market opportunity By Geographical Landscape ($ million)
- Data Tables on Market opportunity By Geographical Landscape ($ million)
10 Drivers, Challenges, and Opportunity/Restraints
- 10.1 Market drivers
- 10.2 Market challenges
- 10.3 Impact of drivers and challenges
- Impact of drivers and challenges in 2023 and 2028
- 10.4 Market opportunities/restraints
11 Competitive Landscape
- 11.1 Overview
- 11.2 Competitive Landscape
- Overview on criticality of inputs and factors of differentiation
- 11.3 Landscape disruption
- Overview on factors of disruption
- 11.4 Industry risks
- Impact of key risks on business
12 Competitive Analysis
- 12.1 Companies profiled
- Companies covered
- 12.2 Market positioning of companies
- Matrix on companies position and classification
- 12.3 Amazon Filters Ltd.
- Amazon Filters Ltd. - Overview
- Amazon Filters Ltd. - Product / Service
- Amazon Filters Ltd. - Key offerings
- 12.4 Danaher Corp.
- Danaher Corp. - Overview
- Danaher Corp. - Business segments
- Danaher Corp. - Key news
- Danaher Corp. - Key offerings
- Danaher Corp. - Segment focus
- 12.5 Donaldson Co. Inc.
- Donaldson Co. Inc. - Overview
- Donaldson Co. Inc. - Business segments
- Donaldson Co. Inc. - Key news
- Donaldson Co. Inc. - Key offerings
- Donaldson Co. Inc. - Segment focus
- 12.6 Eaton Corp. Plc
- Eaton Corp. Plc - Overview
- Eaton Corp. Plc - Business segments
- Eaton Corp. Plc - Key news
- Eaton Corp. Plc - Key offerings
- Eaton Corp. Plc - Segment focus
- 12.7 General Electric Co.
- General Electric Co. - Overview
- General Electric Co. - Business segments
- General Electric Co. - Key news
- General Electric Co. - Key offerings
- General Electric Co. - Segment focus
- 12.8 Graver Technologies LLC
- Graver Technologies LLC - Overview
- Graver Technologies LLC - Product / Service
- Graver Technologies LLC - Key offerings
- 12.9 Meissner Filtration Products Inc.
- Meissner Filtration Products Inc. - Overview
- Meissner Filtration Products Inc. - Product / Service
- Meissner Filtration Products Inc. - Key offerings
- 12.10 Merck KGaA
- Merck KGaA - Overview
- Merck KGaA - Business segments
- Merck KGaA - Key news
- Merck KGaA - Key offerings
- Merck KGaA - Segment focus
- 12.11 Parker Hannifin Corp.
- Parker Hannifin Corp. - Overview
- Parker Hannifin Corp. - Business segments
- Parker Hannifin Corp. - Key news
- Parker Hannifin Corp. - Key offerings
- Parker Hannifin Corp. - Segment focus
- 12.12 Porvair Plc
- Porvair Plc - Overview
- Porvair Plc - Product / Service
- Porvair Plc - Key offerings
- 12.13 Repligen Corp.
- Repligen Corp. - Overview
- Repligen Corp. - Product / Service
- Repligen Corp. - Key offerings
- 12.14 Samsung Electronics Co. Ltd.
- Samsung Electronics Co. Ltd. - Overview
- Samsung Electronics Co. Ltd. - Business segments
- Samsung Electronics Co. Ltd. - Key news
- Samsung Electronics Co. Ltd. - Key offerings
- Samsung Electronics Co. Ltd. - Segment focus
- 12.15 Sartorius AG
- Sartorius AG - Overview
- Sartorius AG - Business segments
- Sartorius AG - Key news
- Sartorius AG - Key offerings
- Sartorius AG - Segment focus
- 12.16 Tetra Laval SA
- Tetra Laval SA - Overview
- Tetra Laval SA - Product / Service
- Tetra Laval SA - Key news
- Tetra Laval SA - Key offerings
- 12.17 Thermo Fisher Scientific Inc.
- Thermo Fisher Scientific Inc. - Overview
- Thermo Fisher Scientific Inc. - Business segments
- Thermo Fisher Scientific Inc. - Key news
- Thermo Fisher Scientific Inc. - Key offerings
- Thermo Fisher Scientific Inc. - Segment focus
13 Appendix
- 13.1 Scope of the report
- 13.2 Inclusions and exclusions checklist
- Inclusions checklist
- Exclusions checklist
- 13.3 Currency conversion rates for US$
- Currency conversion rates for US$
- 13.4 Research methodology
- Research methodology
- 13.5 Data procurement
- Information sources
- 13.6 Data validation
- Data validation
- 13.7 Validation techniques employed for market sizing
- Validation techniques employed for market sizing
- 13.8 Data synthesis
- Data synthesis
- 13.9 360 degree market analysis
- 360 degree market analysis
- 13.10 List of abbreviations
- List of abbreviations

