|
|
市場調査レポート
商品コード
1769508
冷蔵輸送の世界市場 2025年~2029年Global Refrigerated Transportation Market 2025-2029 |
||||||

|
|||||||
カスタマイズ可能
|
|||||||


| 冷蔵輸送の世界市場 2025年~2029年 |
|
出版日: 2025年07月08日
発行: TechNavio
ページ情報: 英文 210 Pages
納期: 即納可能
|

全表示
- 概要
- 図表
- 目次
冷蔵輸送市場は2024年~2029年に451億4,490万米ドル、予測期間中のCAGRは8.3%で成長すると予測されます。
当レポートでは、冷蔵輸送市場の全体的な分析、市場規模・予測、動向、成長促進要因、課題、約25のベンダーを網羅したベンダー分析などを掲載しています。
現在の市場シナリオ、最新動向と促進要因、市場環境全体に関する最新分析を提供しています。冷凍食品の消費拡大、新鮮で高品質な製品に対する消費者の意識と嗜好の高まり、国際貿易の拡大とサプライチェーンの世界化などが市場を牽引しています。
| 市場範囲 | |
|---|---|
| 基準年 | 2025年 |
| 終了年 | 2029年 |
| 予測期間 | 2025年~2029年 |
| 成長モメンタム | 加速 |
| 前年比 | 7.6% |
| CAGR | 8.3% |
| 増分額 | 451億4,490万米ドル |
本調査は、業界の主要参加者からのインプットを含め、一次情報と二次情報を客観的に組み合わせて実施しました。レポートには、主要企業の分析に加え、包括的な市場規模データ、地域別分析によるセグメント、ベンダー情勢が含まれています。レポートは過去データと予測データを掲載しています。
本調査では、今後数年間の冷蔵輸送市場の成長を促進する主な理由の一つとして、電動化トレーラー技術を挙げています。また、食品廃棄に関する意識の高まり、リアルタイムモニタリングと遠隔温度制御のためのテレマティクスとiotの統合は、市場の大きな需要につながります。
目次
第1章 エグゼクティブサマリー
- 市場概要
第2章 Technavio分析
- 価格・ライフサイクル・顧客購入バスケット・採用率・購入基準の分析
- インプットの重要性と差別化の要因
- 混乱の要因
- 促進要因と課題の影響
第3章 市場情勢
- 市場エコシステム
- 市場の特徴
- バリューチェーン分析
第4章 市場規模
- 市場の定義
- 市場セグメント分析
- 市場規模 2024年
- 市場の見通し 2024年~2029年
第5章 市場規模実績
- 冷蔵輸送の世界市場 2019年~2023年
- 輸送別セグメント分析 2019年~2023年
- 用途別セグメント分析 2019年~2023年
- 技術別セグメント分析 2019年~2023年
- 地域別セグメント分析 2019年~2023年
- 国別セグメント分析 2019年~2023年
第6章 定性分析
- AIの影響:冷蔵輸送の世界市場
第7章 ファイブフォース分析
- ファイブフォースの要約
- 買い手の交渉力
- 供給企業の交渉力
- 新規参入業者の脅威
- 代替品の脅威
- 競争の脅威
- 市況
第8章 市場セグメンテーション:輸送別
- 市場セグメント
- 比較:交通手段別
- 道路:市場規模と予測 2024年~2029年
- 水路:市場規模と予測 2024年~2029年
- 航空:市場規模と予測 2024年~2029年
- 市場機会:交通手段別
第9章 市場セグメンテーション:用途別
- 市場セグメント
- 比較:用途別
- 冷蔵食品:市場規模と予測 2024年~2029年
- 冷凍食品:市場規模と予測 2024年~2029年
- 市場機会:用途別
第10章 市場セグメンテーション:技術別
- 市場セグメント
- 比較:技術別
- 空気吹き蒸発器:市場規模と予測 2024年~2029年
- ハイブリッドシステム:市場規模と予測 2024年~2029年
- 共晶デバイス:市場規模と予測 2024年~2029年
- 完全電化:市場規模と予測 2024年~2029年
- 市場機会:技術別
第11章 顧客情勢
- 顧客情勢の概要
第12章 地域別情勢
- 地域別セグメンテーション
- 地域別比較
- アジア太平洋:市場規模と予測 2024年~2029年
- 北米:市場規模と予測 2024年~2029年
- 欧州:市場規模と予測 2024年~2029年
- 南米:市場規模と予測 2024年~2029年
- 中東・アフリカ:市場規模と予測 2024年~2029年
- 米国:市場規模と予測 2024年~2029年
- 中国:市場規模と予測 2024年~2029年
- インド:市場規模と予測 2024年~2029年
- 日本:市場規模と予測 2024年~2029年
- ドイツ:市場規模と予測 2024年~2029年
- カナダ:市場規模と予測 2024年~2029年
- フランス:市場規模と予測 2024年~2029年
- 韓国:市場規模と予測 2024年~2029年
- 英国:市場規模と予測 2024年~2029年
- ブラジル:市場規模と予測 2024年~2029年
- 市場機会:地域情勢別
第13章 促進要因・課題・機会・抑制要因
- 市場促進要因
- 市場の課題
- 促進要因と課題の影響
- 市場の機会・抑制要因
第14章 競合情勢
- 概要
- 競合情勢
- 混乱の状況
- 業界のリスク
第15章 競合分析
- 企業プロファイル
- 企業ランキング指数
- 企業の市場ポジショニング
- Allen Lund Co.
- Bernard KRONE Holding SE and Co. KG
- Birkett Freight Solutions
- COSCO SHIPPING Holdings Co. Ltd.
- Daikin Industries Ltd.
- Envirotainer AB
- Hapag Lloyd AG
- Hyundai Motor Co.
- Knight Swift Transportation Holdings Inc.
- Rinac India Ltd.
- Sartorius AG
- Schmitz Cargobull AG
- Singamas Container Holdings Ltd.
- Tata Motors Ltd.
- Utility Trailer Manufacturing Co.
第16章 付録
Exhibits:
- Exhibits1: Executive Summary - Chart on Market Overview
- Exhibits2: Executive Summary - Data Table on Market Overview
- Exhibits3: Executive Summary - Chart on Global Market Characteristics
- Exhibits4: Executive Summary - Chart on Market By Geographical Landscape
- Exhibits5: Executive Summary - Chart on Market Segmentation by Mode of Transportation
- Exhibits6: Executive Summary - Chart on Market Segmentation by Application
- Exhibits7: Executive Summary - Chart on Market Segmentation by Technology
- Exhibits8: Executive Summary - Chart on Incremental Growth
- Exhibits9: Executive Summary - Data Table on Incremental Growth
- Exhibits10: Executive Summary - Chart on Company Market Positioning
- Exhibits11: Analysis of price sensitivity, lifecycle, customer purchase basket, adoption rates, and purchase criteria
- Exhibits12: Overview on criticality of inputs and factors of differentiation
- Exhibits13: Overview on factors of disruption
- Exhibits14: Impact of drivers and challenges in 2024 and 2029
- Exhibits15: Parent Market
- Exhibits16: Data Table on - Parent Market
- Exhibits17: Market characteristics analysis
- Exhibits18: Value chain analysis
- Exhibits19: Offerings of companies included in the market definition
- Exhibits20: Market segments
- Exhibits21: Chart on Global - Market size and forecast 2024-2029 ($ million)
- Exhibits22: Data Table on Global - Market size and forecast 2024-2029 ($ million)
- Exhibits23: Chart on Global Market: Year-over-year growth 2024-2029 (%)
- Exhibits24: Data Table on Global Market: Year-over-year growth 2024-2029 (%)
- Exhibits25: Historic Market Size - Data Table on Global Refrigerated Transportation Market 2019 - 2023 ($ million)
- Exhibits26: Historic Market Size - Mode of Transportation Segment 2019 - 2023 ($ million)
- Exhibits27: Historic Market Size - Application Segment 2019 - 2023 ($ million)
- Exhibits28: Historic Market Size - Technology Segment 2019 - 2023 ($ million)
- Exhibits29: Historic Market Size - Geography Segment 2019 - 2023 ($ million)
- Exhibits30: Historic Market Size - Country Segment 2019 - 2023 ($ million)
- Exhibits31: Five forces analysis - Comparison between 2024 and 2029
- Exhibits32: Bargaining power of buyers - Impact of key factors 2024 and 2029
- Exhibits33: Bargaining power of suppliers - Impact of key factors in 2024 and 2029
- Exhibits34: Threat of new entrants - Impact of key factors in 2024 and 2029
- Exhibits35: Threat of substitutes - Impact of key factors in 2024 and 2029
- Exhibits36: Threat of rivalry - Impact of key factors in 2024 and 2029
- Exhibits37: Chart on Market condition - Five forces 2024 and 2029
- Exhibits38: Chart on Mode of Transportation - Market share 2024-2029 (%)
- Exhibits39: Data Table on Mode of Transportation - Market share 2024-2029 (%)
- Exhibits40: Chart on Comparison by Mode of Transportation
- Exhibits41: Data Table on Comparison by Mode of Transportation
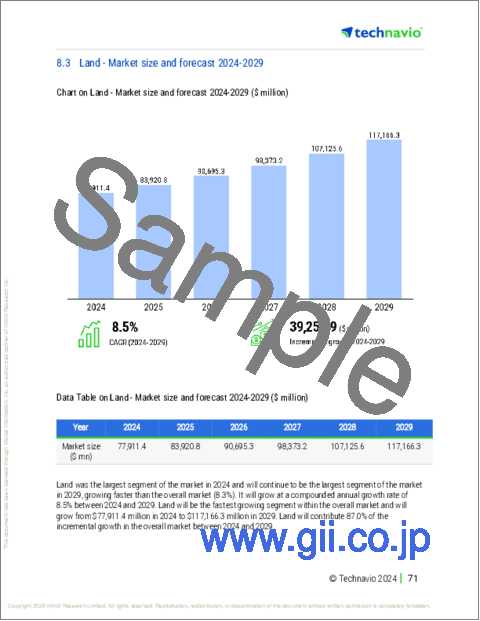
- Exhibits42: Chart on Land - Market size and forecast 2024-2029 ($ million)
- Exhibits43: Data Table on Land - Market size and forecast 2024-2029 ($ million)
- Exhibits44: Chart on Land - Year-over-year growth 2024-2029 (%)
- Exhibits45: Data Table on Land - Year-over-year growth 2024-2029 (%)
- Exhibits46: Chart on Waterways - Market size and forecast 2024-2029 ($ million)
- Exhibits47: Data Table on Waterways - Market size and forecast 2024-2029 ($ million)
- Exhibits48: Chart on Waterways - Year-over-year growth 2024-2029 (%)
- Exhibits49: Data Table on Waterways - Year-over-year growth 2024-2029 (%)
- Exhibits50: Chart on Airways - Market size and forecast 2024-2029 ($ million)
- Exhibits51: Data Table on Airways - Market size and forecast 2024-2029 ($ million)
- Exhibits52: Chart on Airways - Year-over-year growth 2024-2029 (%)
- Exhibits53: Data Table on Airways - Year-over-year growth 2024-2029 (%)
- Exhibits54: Market opportunity by Mode of Transportation ($ million)
- Exhibits55: Data Table on Market opportunity by Mode of Transportation ($ million)
- Exhibits56: Chart on Application - Market share 2024-2029 (%)
- Exhibits57: Data Table on Application - Market share 2024-2029 (%)
- Exhibits58: Chart on Comparison by Application
- Exhibits59: Data Table on Comparison by Application
- Exhibits60: Chart on Chilled food - Market size and forecast 2024-2029 ($ million)
- Exhibits61: Data Table on Chilled food - Market size and forecast 2024-2029 ($ million)
- Exhibits62: Chart on Chilled food - Year-over-year growth 2024-2029 (%)
- Exhibits63: Data Table on Chilled food - Year-over-year growth 2024-2029 (%)
- Exhibits64: Chart on Frozen food - Market size and forecast 2024-2029 ($ million)
- Exhibits65: Data Table on Frozen food - Market size and forecast 2024-2029 ($ million)
- Exhibits66: Chart on Frozen food - Year-over-year growth 2024-2029 (%)
- Exhibits67: Data Table on Frozen food - Year-over-year growth 2024-2029 (%)
- Exhibits68: Market opportunity by Application ($ million)
- Exhibits69: Data Table on Market opportunity by Application ($ million)
- Exhibits70: Chart on Technology - Market share 2024-2029 (%)
- Exhibits71: Data Table on Technology - Market share 2024-2029 (%)
- Exhibits72: Chart on Comparison by Technology
- Exhibits73: Data Table on Comparison by Technology
- Exhibits74: Chart on Air-blown evaporators - Market size and forecast 2024-2029 ($ million)
- Exhibits75: Data Table on Air-blown evaporators - Market size and forecast 2024-2029 ($ million)
- Exhibits76: Chart on Air-blown evaporators - Year-over-year growth 2024-2029 (%)
- Exhibits77: Data Table on Air-blown evaporators - Year-over-year growth 2024-2029 (%)
- Exhibits78: Chart on Hybrid system - Market size and forecast 2024-2029 ($ million)
- Exhibits79: Data Table on Hybrid system - Market size and forecast 2024-2029 ($ million)
- Exhibits80: Chart on Hybrid system - Year-over-year growth 2024-2029 (%)
- Exhibits81: Data Table on Hybrid system - Year-over-year growth 2024-2029 (%)
- Exhibits82: Chart on Eutectic devices - Market size and forecast 2024-2029 ($ million)
- Exhibits83: Data Table on Eutectic devices - Market size and forecast 2024-2029 ($ million)
- Exhibits84: Chart on Eutectic devices - Year-over-year growth 2024-2029 (%)
- Exhibits85: Data Table on Eutectic devices - Year-over-year growth 2024-2029 (%)
- Exhibits86: Chart on Fully electrified - Market size and forecast 2024-2029 ($ million)
- Exhibits87: Data Table on Fully electrified - Market size and forecast 2024-2029 ($ million)
- Exhibits88: Chart on Fully electrified - Year-over-year growth 2024-2029 (%)
- Exhibits89: Data Table on Fully electrified - Year-over-year growth 2024-2029 (%)
- Exhibits90: Market opportunity by Technology ($ million)
- Exhibits91: Data Table on Market opportunity by Technology ($ million)
- Exhibits92: Analysis of price sensitivity, lifecycle, customer purchase basket, adoption rates, and purchase criteria
- Exhibits93: Chart on Market share By Geographical Landscape 2024-2029 (%)
- Exhibits94: Data Table on Market share By Geographical Landscape 2024-2029 (%)
- Exhibits95: Chart on Geographic comparison
- Exhibits96: Data Table on Geographic comparison
- Exhibits97: Chart on APAC - Market size and forecast 2024-2029 ($ million)
- Exhibits98: Data Table on APAC - Market size and forecast 2024-2029 ($ million)
- Exhibits99: Chart on APAC - Year-over-year growth 2024-2029 (%)
- Exhibits100: Data Table on APAC - Year-over-year growth 2024-2029 (%)
- Exhibits101: Chart on North America - Market size and forecast 2024-2029 ($ million)
- Exhibits102: Data Table on North America - Market size and forecast 2024-2029 ($ million)
- Exhibits103: Chart on North America - Year-over-year growth 2024-2029 (%)
- Exhibits104: Data Table on North America - Year-over-year growth 2024-2029 (%)
- Exhibits105: Chart on Europe - Market size and forecast 2024-2029 ($ million)
- Exhibits106: Data Table on Europe - Market size and forecast 2024-2029 ($ million)
- Exhibits107: Chart on Europe - Year-over-year growth 2024-2029 (%)
- Exhibits108: Data Table on Europe - Year-over-year growth 2024-2029 (%)
- Exhibits109: Chart on South America - Market size and forecast 2024-2029 ($ million)
- Exhibits110: Data Table on South America - Market size and forecast 2024-2029 ($ million)
- Exhibits111: Chart on South America - Year-over-year growth 2024-2029 (%)
- Exhibits112: Data Table on South America - Year-over-year growth 2024-2029 (%)
- Exhibits113: Chart on Middle East and Africa - Market size and forecast 2024-2029 ($ million)
- Exhibits114: Data Table on Middle East and Africa - Market size and forecast 2024-2029 ($ million)
- Exhibits115: Chart on Middle East and Africa - Year-over-year growth 2024-2029 (%)
- Exhibits116: Data Table on Middle East and Africa - Year-over-year growth 2024-2029 (%)
- Exhibits117: Chart on US - Market size and forecast 2024-2029 ($ million)
- Exhibits118: Data Table on US - Market size and forecast 2024-2029 ($ million)
- Exhibits119: Chart on US - Year-over-year growth 2024-2029 (%)
- Exhibits120: Data Table on US - Year-over-year growth 2024-2029 (%)
- Exhibits121: Chart on China - Market size and forecast 2024-2029 ($ million)
- Exhibits122: Data Table on China - Market size and forecast 2024-2029 ($ million)
- Exhibits123: Chart on China - Year-over-year growth 2024-2029 (%)
- Exhibits124: Data Table on China - Year-over-year growth 2024-2029 (%)
- Exhibits125: Chart on India - Market size and forecast 2024-2029 ($ million)
- Exhibits126: Data Table on India - Market size and forecast 2024-2029 ($ million)
- Exhibits127: Chart on India - Year-over-year growth 2024-2029 (%)
- Exhibits128: Data Table on India - Year-over-year growth 2024-2029 (%)
- Exhibits129: Chart on Japan - Market size and forecast 2024-2029 ($ million)
- Exhibits130: Data Table on Japan - Market size and forecast 2024-2029 ($ million)
- Exhibits131: Chart on Japan - Year-over-year growth 2024-2029 (%)
- Exhibits132: Data Table on Japan - Year-over-year growth 2024-2029 (%)
- Exhibits133: Chart on Germany - Market size and forecast 2024-2029 ($ million)
- Exhibits134: Data Table on Germany - Market size and forecast 2024-2029 ($ million)
- Exhibits135: Chart on Germany - Year-over-year growth 2024-2029 (%)
- Exhibits136: Data Table on Germany - Year-over-year growth 2024-2029 (%)
- Exhibits137: Chart on Canada - Market size and forecast 2024-2029 ($ million)
- Exhibits138: Data Table on Canada - Market size and forecast 2024-2029 ($ million)
- Exhibits139: Chart on Canada - Year-over-year growth 2024-2029 (%)
- Exhibits140: Data Table on Canada - Year-over-year growth 2024-2029 (%)
- Exhibits141: Chart on France - Market size and forecast 2024-2029 ($ million)
- Exhibits142: Data Table on France - Market size and forecast 2024-2029 ($ million)
- Exhibits143: Chart on France - Year-over-year growth 2024-2029 (%)
- Exhibits144: Data Table on France - Year-over-year growth 2024-2029 (%)
- Exhibits145: Chart on South Korea - Market size and forecast 2024-2029 ($ million)
- Exhibits146: Data Table on South Korea - Market size and forecast 2024-2029 ($ million)
- Exhibits147: Chart on South Korea - Year-over-year growth 2024-2029 (%)
- Exhibits148: Data Table on South Korea - Year-over-year growth 2024-2029 (%)
- Exhibits149: Chart on UK - Market size and forecast 2024-2029 ($ million)
- Exhibits150: Data Table on UK - Market size and forecast 2024-2029 ($ million)
- Exhibits151: Chart on UK - Year-over-year growth 2024-2029 (%)
- Exhibits152: Data Table on UK - Year-over-year growth 2024-2029 (%)
- Exhibits153: Chart on Brazil - Market size and forecast 2024-2029 ($ million)
- Exhibits154: Data Table on Brazil - Market size and forecast 2024-2029 ($ million)
- Exhibits155: Chart on Brazil - Year-over-year growth 2024-2029 (%)
- Exhibits156: Data Table on Brazil - Year-over-year growth 2024-2029 (%)
- Exhibits157: Market opportunity By Geographical Landscape ($ million)
- Exhibits158: Data Tables on Market opportunity By Geographical Landscape ($ million)
- Exhibits159: Impact of drivers and challenges in 2024 and 2029
- Exhibits160: Overview on criticality of inputs and factors of differentiation
- Exhibits161: Overview on factors of disruption
- Exhibits162: Impact of key risks on business
- Exhibits163: Companies covered
- Exhibits164: Company ranking index
- Exhibits165: Matrix on companies position and classification
- Exhibits166: Allen Lund Co. - Overview
- Exhibits167: Allen Lund Co. - Product / Service
- Exhibits168: Allen Lund Co. - Key offerings
- Exhibits169: SWOT
- Exhibits170: Bernard KRONE Holding SE and Co. KG - Overview
- Exhibits171: Bernard KRONE Holding SE and Co. KG - Product / Service
- Exhibits172: Bernard KRONE Holding SE and Co. KG - Key offerings
- Exhibits173: SWOT
- Exhibits174: Birkett Freight Solutions - Overview
- Exhibits175: Birkett Freight Solutions - Product / Service
- Exhibits176: Birkett Freight Solutions - Key offerings
- Exhibits177: SWOT
- Exhibits178: COSCO SHIPPING Holdings Co. Ltd. - Overview
- Exhibits179: COSCO SHIPPING Holdings Co. Ltd. - Business segments
- Exhibits180: COSCO SHIPPING Holdings Co. Ltd. - Key offerings
- Exhibits181: COSCO SHIPPING Holdings Co. Ltd. - Segment focus
- Exhibits182: SWOT
- Exhibits183: Daikin Industries Ltd. - Overview
- Exhibits184: Daikin Industries Ltd. - Business segments
- Exhibits185: Daikin Industries Ltd. - Key news
- Exhibits186: Daikin Industries Ltd. - Key offerings
- Exhibits187: Daikin Industries Ltd. - Segment focus
- Exhibits188: SWOT
- Exhibits189: Envirotainer AB - Overview
- Exhibits190: Envirotainer AB - Product / Service
- Exhibits191: Envirotainer AB - Key offerings
- Exhibits192: SWOT
- Exhibits193: Hapag Lloyd AG - Overview
- Exhibits194: Hapag Lloyd AG - Product / Service
- Exhibits195: Hapag Lloyd AG - Key offerings
- Exhibits196: SWOT
- Exhibits197: Hyundai Motor Co. - Overview
- Exhibits198: Hyundai Motor Co. - Business segments
- Exhibits199: Hyundai Motor Co. - Key news
- Exhibits200: Hyundai Motor Co. - Key offerings
- Exhibits201: Hyundai Motor Co. - Segment focus
- Exhibits202: SWOT
- Exhibits203: Knight Swift Transportation Holdings Inc. - Overview
- Exhibits204: Knight Swift Transportation Holdings Inc. - Business segments
- Exhibits205: Knight Swift Transportation Holdings Inc. - Key offerings
- Exhibits206: Knight Swift Transportation Holdings Inc. - Segment focus
- Exhibits207: SWOT
- Exhibits208: Rinac India Ltd. - Overview
- Exhibits209: Rinac India Ltd. - Product / Service
- Exhibits210: Rinac India Ltd. - Key offerings
- Exhibits211: SWOT
- Exhibits212: Sartorius AG - Overview
- Exhibits213: Sartorius AG - Business segments
- Exhibits214: Sartorius AG - Key news
- Exhibits215: Sartorius AG - Key offerings
- Exhibits216: Sartorius AG - Segment focus
- Exhibits217: SWOT
- Exhibits218: Schmitz Cargobull AG - Overview
- Exhibits219: Schmitz Cargobull AG - Product / Service
- Exhibits220: Schmitz Cargobull AG - Key offerings
- Exhibits221: SWOT
- Exhibits222: Singamas Container Holdings Ltd. - Overview
- Exhibits223: Singamas Container Holdings Ltd. - Business segments
- Exhibits224: Singamas Container Holdings Ltd. - Key offerings
- Exhibits225: Singamas Container Holdings Ltd. - Segment focus
- Exhibits226: SWOT
- Exhibits227: Tata Motors Ltd. - Overview
- Exhibits228: Tata Motors Ltd. - Business segments
- Exhibits229: Tata Motors Ltd. - Key news
- Exhibits230: Tata Motors Ltd. - Key offerings
- Exhibits231: Tata Motors Ltd. - Segment focus
- Exhibits232: SWOT
- Exhibits233: Utility Trailer Manufacturing Co. - Overview
- Exhibits234: Utility Trailer Manufacturing Co. - Product / Service
- Exhibits235: Utility Trailer Manufacturing Co. - Key offerings
- Exhibits236: SWOT
- Exhibits237: Inclusions checklist
- Exhibits238: Exclusions checklist
- Exhibits239: Currency conversion rates for US$
- Exhibits240: Research methodology
- Exhibits241: Information sources
- Exhibits242: Data validation
- Exhibits243: Validation techniques employed for market sizing
- Exhibits244: Data synthesis
- Exhibits245: 360 degree market analysis
- Exhibits246: List of abbreviations
The refrigerated transportation market is forecasted to grow by USD 45,144.9 mn during 2024-2029, accelerating at a CAGR of 8.3% during the forecast period. The report on the refrigerated transportation market provides a holistic analysis, market size and forecast, trends, growth drivers, and challenges, as well as vendor analysis covering around 25 vendors.
The report offers an up-to-date analysis regarding the current market scenario, the latest trends and drivers, and the overall market environment. The market is driven by rising consumption of frozen food, growing consumer awareness and preference for fresh and high-quality products, and expansion of international trade and globalization of supply chains.
| Market Scope | |
|---|---|
| Base Year | 2025 |
| End Year | 2029 |
| Series Year | 2025-2029 |
| Growth Momentum | Accelerate |
| YOY 2025 | 7.6% |
| CAGR | 8.3% |
| Incremental Value | $45,144.9 mn |
The study was conducted using an objective combination of primary and secondary information including inputs from key participants in the industry. The report contains a comprehensive market size data, segment with regional analysis and vendor landscape in addition to an analysis of the key companies. Reports have historic and forecast data.
Technavio's refrigerated transportation market is segmented as below:
By Mode Of Transportation
- Land
- Waterways
- Airways
By Application
- Chilled food
- Frozen food
By Technology
- Air-blown evaporators
- Hybrid system
- Eutectic devices
- Fully electrified
By Geographical Landscape
- APAC
- North America
- Europe
- South America
- Middle East and Africa
This study identifies the electrified trailer technologies as one of the prime reasons driving the refrigerated transportation market growth during the next few years. Also, increasing awareness about food wastage and integration of telematics and iot for real-time monitoring and remote temperature control will lead to sizable demand in the market.
The report on the refrigerated transportation market covers the following areas:
- Refrigerated Transportation Market sizing
- Refrigerated Transportation Market forecast
- Refrigerated Transportation Market industry analysis
The robust vendor analysis is designed to help clients improve their market position, and in line with this, this report provides a detailed analysis of several leading refrigerated transportation market vendors that include Allen Lund Co., Bernard KRONE Holding SE and Co. KG, Birkett Freight Solutions, Carrier Global Corp., COSCO SHIPPING Holdings Co. Ltd., Daikin Industries Ltd., Envirotainer AB, Great Dane LLC, Hapag Lloyd AG, Hyundai Motor Co., Knight Swift Transportation Holdings Inc., LAMBERET SAS, Rinac India Ltd., Sartorius AG, Schmitz Cargobull AG, Sdiptech AB, Singamas Container Holdings Ltd., Tata Motors Ltd., Utility Trailer Manufacturing Co., and Wabash National Corp.. Also, the refrigerated transportation market analysis report includes information on upcoming trends and challenges that will influence market growth. This is to help companies strategize and leverage all forthcoming growth opportunities.
The publisher presents a detailed picture of the market by the way of study, synthesis, and summation of data from multiple sources by an analysis of key parameters such as profit, pricing, competition, and promotions. It presents various market facets by identifying the key industry influencers. The data presented is comprehensive, reliable, and a result of extensive primary and secondary research. The market research reports provide a complete competitive landscape and an in-depth vendor selection methodology and analysis using qualitative and quantitative research to forecast accurate market growth.
Table of Contents
1 Executive Summary
- 1.1 Market overview
- Executive Summary - Chart on Market Overview
- Executive Summary - Data Table on Market Overview
- Executive Summary - Chart on Global Market Characteristics
- Executive Summary - Chart on Market By Geographical Landscape
- Executive Summary - Chart on Market Segmentation by Mode of Transportation
- Executive Summary - Chart on Market Segmentation by Application
- Executive Summary - Chart on Market Segmentation by Technology
- Executive Summary - Chart on Incremental Growth
- Executive Summary - Data Table on Incremental Growth
- Executive Summary - Chart on Company Market Positioning
2 Technavio Analysis
- 2.1 Analysis of price sensitivity, lifecycle, customer purchase basket, adoption rates, and purchase criteria
- Analysis of price sensitivity, lifecycle, customer purchase basket, adoption rates, and purchase criteria
- 2.2 Criticality of inputs and Factors of differentiation
- Overview on criticality of inputs and factors of differentiation
- 2.3 Factors of disruption
- Overview on factors of disruption
- 2.4 Impact of drivers and challenges
- Impact of drivers and challenges in 2024 and 2029
3 Market Landscape
- 3.1 Market ecosystem
- Parent Market
- Data Table on - Parent Market
- 3.2 Market characteristics
- Market characteristics analysis
- 3.3 Value chain analysis
- Value chain analysis
4 Market Sizing
- 4.1 Market definition
- Offerings of companies included in the market definition
- 4.2 Market segment analysis
- Market segments
- 4.3 Market size 2024
- 4.4 Market outlook: Forecast for 2024-2029
- Chart on Global - Market size and forecast 2024-2029 ($ million)
- Data Table on Global - Market size and forecast 2024-2029 ($ million)
- Chart on Global Market: Year-over-year growth 2024-2029 (%)
- Data Table on Global Market: Year-over-year growth 2024-2029 (%)
5 Historic Market Size
- 5.1 Global Refrigerated Transportation Market 2019 - 2023
- Historic Market Size - Data Table on Global Refrigerated Transportation Market 2019 - 2023 ($ million)
- 5.2 Mode of Transportation segment analysis 2019 - 2023
- Historic Market Size - Mode of Transportation Segment 2019 - 2023 ($ million)
- 5.3 Application segment analysis 2019 - 2023
- Historic Market Size - Application Segment 2019 - 2023 ($ million)
- 5.4 Technology segment analysis 2019 - 2023
- Historic Market Size - Technology Segment 2019 - 2023 ($ million)
- 5.5 Geography segment analysis 2019 - 2023
- Historic Market Size - Geography Segment 2019 - 2023 ($ million)
- 5.6 Country segment analysis 2019 - 2023
- Historic Market Size - Country Segment 2019 - 2023 ($ million)
6 Qualitative Analysis
- 6.1 The impact of AI in the global refrigerated transportation market
7 Five Forces Analysis
- 7.1 Five forces summary
- Five forces analysis - Comparison between 2024 and 2029
- 7.2 Bargaining power of buyers
- Bargaining power of buyers - Impact of key factors 2024 and 2029
- 7.3 Bargaining power of suppliers
- Bargaining power of suppliers - Impact of key factors in 2024 and 2029
- 7.4 Threat of new entrants
- Threat of new entrants - Impact of key factors in 2024 and 2029
- 7.5 Threat of substitutes
- Threat of substitutes - Impact of key factors in 2024 and 2029
- 7.6 Threat of rivalry
- Threat of rivalry - Impact of key factors in 2024 and 2029
- 7.7 Market condition
- Chart on Market condition - Five forces 2024 and 2029
8 Market Segmentation by Mode of Transportation
- 8.1 Market segments
- Chart on Mode of Transportation - Market share 2024-2029 (%)
- Data Table on Mode of Transportation - Market share 2024-2029 (%)
- 8.2 Comparison by Mode of Transportation
- Chart on Comparison by Mode of Transportation
- Data Table on Comparison by Mode of Transportation
- 8.3 Land - Market size and forecast 2024-2029
- Chart on Land - Market size and forecast 2024-2029 ($ million)
- Data Table on Land - Market size and forecast 2024-2029 ($ million)
- Chart on Land - Year-over-year growth 2024-2029 (%)
- Data Table on Land - Year-over-year growth 2024-2029 (%)
- 8.4 Waterways - Market size and forecast 2024-2029
- Chart on Waterways - Market size and forecast 2024-2029 ($ million)
- Data Table on Waterways - Market size and forecast 2024-2029 ($ million)
- Chart on Waterways - Year-over-year growth 2024-2029 (%)
- Data Table on Waterways - Year-over-year growth 2024-2029 (%)
- 8.5 Airways - Market size and forecast 2024-2029
- Chart on Airways - Market size and forecast 2024-2029 ($ million)
- Data Table on Airways - Market size and forecast 2024-2029 ($ million)
- Chart on Airways - Year-over-year growth 2024-2029 (%)
- Data Table on Airways - Year-over-year growth 2024-2029 (%)
- 8.6 Market opportunity by Mode of Transportation
- Market opportunity by Mode of Transportation ($ million)
- Data Table on Market opportunity by Mode of Transportation ($ million)
9 Market Segmentation by Application
- 9.1 Market segments
- Chart on Application - Market share 2024-2029 (%)
- Data Table on Application - Market share 2024-2029 (%)
- 9.2 Comparison by Application
- Chart on Comparison by Application
- Data Table on Comparison by Application
- 9.3 Chilled food - Market size and forecast 2024-2029
- Chart on Chilled food - Market size and forecast 2024-2029 ($ million)
- Data Table on Chilled food - Market size and forecast 2024-2029 ($ million)
- Chart on Chilled food - Year-over-year growth 2024-2029 (%)
- Data Table on Chilled food - Year-over-year growth 2024-2029 (%)
- 9.4 Frozen food - Market size and forecast 2024-2029
- Chart on Frozen food - Market size and forecast 2024-2029 ($ million)
- Data Table on Frozen food - Market size and forecast 2024-2029 ($ million)
- Chart on Frozen food - Year-over-year growth 2024-2029 (%)
- Data Table on Frozen food - Year-over-year growth 2024-2029 (%)
- 9.5 Market opportunity by Application
- Market opportunity by Application ($ million)
- Data Table on Market opportunity by Application ($ million)
10 Market Segmentation by Technology
- 10.1 Market segments
- Chart on Technology - Market share 2024-2029 (%)
- Data Table on Technology - Market share 2024-2029 (%)
- 10.2 Comparison by Technology
- Chart on Comparison by Technology
- Data Table on Comparison by Technology
- 10.3 Air-blown evaporators - Market size and forecast 2024-2029
- Chart on Air-blown evaporators - Market size and forecast 2024-2029 ($ million)
- Data Table on Air-blown evaporators - Market size and forecast 2024-2029 ($ million)
- Chart on Air-blown evaporators - Year-over-year growth 2024-2029 (%)
- Data Table on Air-blown evaporators - Year-over-year growth 2024-2029 (%)
- 10.4 Hybrid system - Market size and forecast 2024-2029
- Chart on Hybrid system - Market size and forecast 2024-2029 ($ million)
- Data Table on Hybrid system - Market size and forecast 2024-2029 ($ million)
- Chart on Hybrid system - Year-over-year growth 2024-2029 (%)
- Data Table on Hybrid system - Year-over-year growth 2024-2029 (%)
- 10.5 Eutectic devices - Market size and forecast 2024-2029
- Chart on Eutectic devices - Market size and forecast 2024-2029 ($ million)
- Data Table on Eutectic devices - Market size and forecast 2024-2029 ($ million)
- Chart on Eutectic devices - Year-over-year growth 2024-2029 (%)
- Data Table on Eutectic devices - Year-over-year growth 2024-2029 (%)
- 10.6 Fully electrified - Market size and forecast 2024-2029
- Chart on Fully electrified - Market size and forecast 2024-2029 ($ million)
- Data Table on Fully electrified - Market size and forecast 2024-2029 ($ million)
- Chart on Fully electrified - Year-over-year growth 2024-2029 (%)
- Data Table on Fully electrified - Year-over-year growth 2024-2029 (%)
- 10.7 Market opportunity by Technology
- Market opportunity by Technology ($ million)
- Data Table on Market opportunity by Technology ($ million)
11 Customer Landscape
- 11.1 Customer landscape overview
- Analysis of price sensitivity, lifecycle, customer purchase basket, adoption rates, and purchase criteria
12 Geographic Landscape
- 12.1 Geographic segmentation
- Chart on Market share By Geographical Landscape 2024-2029 (%)
- Data Table on Market share By Geographical Landscape 2024-2029 (%)
- 12.2 Geographic comparison
- Chart on Geographic comparison
- Data Table on Geographic comparison
- 12.3 APAC - Market size and forecast 2024-2029
- Chart on APAC - Market size and forecast 2024-2029 ($ million)
- Data Table on APAC - Market size and forecast 2024-2029 ($ million)
- Chart on APAC - Year-over-year growth 2024-2029 (%)
- Data Table on APAC - Year-over-year growth 2024-2029 (%)
- 12.4 North America - Market size and forecast 2024-2029
- Chart on North America - Market size and forecast 2024-2029 ($ million)
- Data Table on North America - Market size and forecast 2024-2029 ($ million)
- Chart on North America - Year-over-year growth 2024-2029 (%)
- Data Table on North America - Year-over-year growth 2024-2029 (%)
- 12.5 Europe - Market size and forecast 2024-2029
- Chart on Europe - Market size and forecast 2024-2029 ($ million)
- Data Table on Europe - Market size and forecast 2024-2029 ($ million)
- Chart on Europe - Year-over-year growth 2024-2029 (%)
- Data Table on Europe - Year-over-year growth 2024-2029 (%)
- 12.6 South America - Market size and forecast 2024-2029
- Chart on South America - Market size and forecast 2024-2029 ($ million)
- Data Table on South America - Market size and forecast 2024-2029 ($ million)
- Chart on South America - Year-over-year growth 2024-2029 (%)
- Data Table on South America - Year-over-year growth 2024-2029 (%)
- 12.7 Middle East and Africa - Market size and forecast 2024-2029
- Chart on Middle East and Africa - Market size and forecast 2024-2029 ($ million)
- Data Table on Middle East and Africa - Market size and forecast 2024-2029 ($ million)
- Chart on Middle East and Africa - Year-over-year growth 2024-2029 (%)
- Data Table on Middle East and Africa - Year-over-year growth 2024-2029 (%)
- 12.8 US - Market size and forecast 2024-2029
- Chart on US - Market size and forecast 2024-2029 ($ million)
- Data Table on US - Market size and forecast 2024-2029 ($ million)
- Chart on US - Year-over-year growth 2024-2029 (%)
- Data Table on US - Year-over-year growth 2024-2029 (%)
- 12.9 China - Market size and forecast 2024-2029
- Chart on China - Market size and forecast 2024-2029 ($ million)
- Data Table on China - Market size and forecast 2024-2029 ($ million)
- Chart on China - Year-over-year growth 2024-2029 (%)
- Data Table on China - Year-over-year growth 2024-2029 (%)
- 12.10 India - Market size and forecast 2024-2029
- Chart on India - Market size and forecast 2024-2029 ($ million)
- Data Table on India - Market size and forecast 2024-2029 ($ million)
- Chart on India - Year-over-year growth 2024-2029 (%)
- Data Table on India - Year-over-year growth 2024-2029 (%)
- 12.11 Japan - Market size and forecast 2024-2029
- Chart on Japan - Market size and forecast 2024-2029 ($ million)
- Data Table on Japan - Market size and forecast 2024-2029 ($ million)
- Chart on Japan - Year-over-year growth 2024-2029 (%)
- Data Table on Japan - Year-over-year growth 2024-2029 (%)
- 12.12 Germany - Market size and forecast 2024-2029
- Chart on Germany - Market size and forecast 2024-2029 ($ million)
- Data Table on Germany - Market size and forecast 2024-2029 ($ million)
- Chart on Germany - Year-over-year growth 2024-2029 (%)
- Data Table on Germany - Year-over-year growth 2024-2029 (%)
- 12.13 Canada - Market size and forecast 2024-2029
- Chart on Canada - Market size and forecast 2024-2029 ($ million)
- Data Table on Canada - Market size and forecast 2024-2029 ($ million)
- Chart on Canada - Year-over-year growth 2024-2029 (%)
- Data Table on Canada - Year-over-year growth 2024-2029 (%)
- 12.14 France - Market size and forecast 2024-2029
- Chart on France - Market size and forecast 2024-2029 ($ million)
- Data Table on France - Market size and forecast 2024-2029 ($ million)
- Chart on France - Year-over-year growth 2024-2029 (%)
- Data Table on France - Year-over-year growth 2024-2029 (%)
- 12.15 South Korea - Market size and forecast 2024-2029
- Chart on South Korea - Market size and forecast 2024-2029 ($ million)
- Data Table on South Korea - Market size and forecast 2024-2029 ($ million)
- Chart on South Korea - Year-over-year growth 2024-2029 (%)
- Data Table on South Korea - Year-over-year growth 2024-2029 (%)
- 12.16 UK - Market size and forecast 2024-2029
- Chart on UK - Market size and forecast 2024-2029 ($ million)
- Data Table on UK - Market size and forecast 2024-2029 ($ million)
- Chart on UK - Year-over-year growth 2024-2029 (%)
- Data Table on UK - Year-over-year growth 2024-2029 (%)
- 12.17 Brazil - Market size and forecast 2024-2029
- Chart on Brazil - Market size and forecast 2024-2029 ($ million)
- Data Table on Brazil - Market size and forecast 2024-2029 ($ million)
- Chart on Brazil - Year-over-year growth 2024-2029 (%)
- Data Table on Brazil - Year-over-year growth 2024-2029 (%)
- 12.18 Market opportunity By Geographical Landscape
- Market opportunity By Geographical Landscape ($ million)
- Data Tables on Market opportunity By Geographical Landscape ($ million)
13 Drivers, Challenges, and Opportunity/Restraints
- 13.1 Market drivers
- 13.2 Market challenges
- 13.3 Impact of drivers and challenges
- Impact of drivers and challenges in 2024 and 2029
- 13.4 Market opportunities/restraints
14 Competitive Landscape
- 14.1 Overview
- 14.2 Competitive Landscape
- Overview on criticality of inputs and factors of differentiation
- 14.3 Landscape disruption
- Overview on factors of disruption
- 14.4 Industry risks
- Impact of key risks on business
15 Competitive Analysis
- 15.1 Companies profiled
- Companies covered
- 15.2 Company ranking index
- Company ranking index
- 15.3 Market positioning of companies
- Matrix on companies position and classification
- 15.4 Allen Lund Co.
- Allen Lund Co. - Overview
- Allen Lund Co. - Product / Service
- Allen Lund Co. - Key offerings
- SWOT
- 15.5 Bernard KRONE Holding SE and Co. KG
- Bernard KRONE Holding SE and Co. KG - Overview
- Bernard KRONE Holding SE and Co. KG - Product / Service
- Bernard KRONE Holding SE and Co. KG - Key offerings
- SWOT
- 15.6 Birkett Freight Solutions
- Birkett Freight Solutions - Overview
- Birkett Freight Solutions - Product / Service
- Birkett Freight Solutions - Key offerings
- SWOT
- 15.7 COSCO SHIPPING Holdings Co. Ltd.
- COSCO SHIPPING Holdings Co. Ltd. - Overview
- COSCO SHIPPING Holdings Co. Ltd. - Business segments
- COSCO SHIPPING Holdings Co. Ltd. - Key offerings
- COSCO SHIPPING Holdings Co. Ltd. - Segment focus
- SWOT
- 15.8 Daikin Industries Ltd.
- Daikin Industries Ltd. - Overview
- Daikin Industries Ltd. - Business segments
- Daikin Industries Ltd. - Key news
- Daikin Industries Ltd. - Key offerings
- Daikin Industries Ltd. - Segment focus
- SWOT
- 15.9 Envirotainer AB
- Envirotainer AB - Overview
- Envirotainer AB - Product / Service
- Envirotainer AB - Key offerings
- SWOT
- 15.10 Hapag Lloyd AG
- Hapag Lloyd AG - Overview
- Hapag Lloyd AG - Product / Service
- Hapag Lloyd AG - Key offerings
- SWOT
- 15.11 Hyundai Motor Co.
- Hyundai Motor Co. - Overview
- Hyundai Motor Co. - Business segments
- Hyundai Motor Co. - Key news
- Hyundai Motor Co. - Key offerings
- Hyundai Motor Co. - Segment focus
- SWOT
- 15.12 Knight Swift Transportation Holdings Inc.
- Knight Swift Transportation Holdings Inc. - Overview
- Knight Swift Transportation Holdings Inc. - Business segments
- Knight Swift Transportation Holdings Inc. - Key offerings
- Knight Swift Transportation Holdings Inc. - Segment focus
- SWOT
- 15.13 Rinac India Ltd.
- Rinac India Ltd. - Overview
- Rinac India Ltd. - Product / Service
- Rinac India Ltd. - Key offerings
- SWOT
- 15.14 Sartorius AG
- Sartorius AG - Overview
- Sartorius AG - Business segments
- Sartorius AG - Key news
- Sartorius AG - Key offerings
- Sartorius AG - Segment focus
- SWOT
- 15.15 Schmitz Cargobull AG
- Schmitz Cargobull AG - Overview
- Schmitz Cargobull AG - Product / Service
- Schmitz Cargobull AG - Key offerings
- SWOT
- 15.16 Singamas Container Holdings Ltd.
- Singamas Container Holdings Ltd. - Overview
- Singamas Container Holdings Ltd. - Business segments
- Singamas Container Holdings Ltd. - Key offerings
- Singamas Container Holdings Ltd. - Segment focus
- SWOT
- 15.17 Tata Motors Ltd.
- Tata Motors Ltd. - Overview
- Tata Motors Ltd. - Business segments
- Tata Motors Ltd. - Key news
- Tata Motors Ltd. - Key offerings
- Tata Motors Ltd. - Segment focus
- SWOT
- 15.18 Utility Trailer Manufacturing Co.
- Utility Trailer Manufacturing Co. - Overview
- Utility Trailer Manufacturing Co. - Product / Service
- Utility Trailer Manufacturing Co. - Key offerings
- SWOT
16 Appendix
- 16.1 Scope of the report
- 16.2 Inclusions and exclusions checklist
- Inclusions checklist
- Exclusions checklist
- 16.3 Currency conversion rates for US$
- Currency conversion rates for US$
- 16.4 Research methodology
- Research methodology
- 16.5 Data procurement
- Information sources
- 16.6 Data validation
- Data validation
- 16.7 Validation techniques employed for market sizing
- Validation techniques employed for market sizing
- 16.8 Data synthesis
- Data synthesis
- 16.9 360 degree market analysis
- 360 degree market analysis
- 16.10 List of abbreviations
- List of abbreviations

