|
|
市場調査レポート
商品コード
1626425
ポータブル発電機の世界市場(2025年~2029年)Global Portable Generator Market 2025-2029 |
||||||

|
|||||||
カスタマイズ可能
|
|||||||


| ポータブル発電機の世界市場(2025年~2029年) |
|
出版日: 2024年12月17日
発行: TechNavio
ページ情報: 英文 206 Pages
納期: 即納可能
|

全表示
- 概要
- 図表
- 目次
ポータブル発電機市場(2025年~2029年)
世界のポータブル発電機の市場規模は、2024年~2029年に17億5,180万米ドル、予測期間中のCAGRは6%で成長すると予測されます。当レポートでは、ポータブル発電機市場の全体的な分析、市場規模・予測、動向、成長促進要因、課題、約25のベンダーを網羅したベンダー分析などを掲載しています。
本レポートは、現在の市場シナリオ、最新動向と促進要因、市場環境全体に関する最新分析を提供しています。急速な都市化と工業化、送電網の故障事例の増加、停電につながる自然災害の増加などが市場を牽引しています。
| 市場範囲 | |
|---|---|
| 基準年 | 2025年 |
| 終了年 | 2029年 |
| 予測期間 | 2025年~2029年 |
| 成長モメンタム | 加速 |
| 前年比2025年 | 5.4% |
| CAGR | 6% |
| 増分額 | 17億5,180万米ドル |
本調査では、今後数年間のポータブル発電機市場の成長を促進する主な理由の1つとして、デュアル燃料発電機技術の出現を挙げています。また、発電機の燃料源としてのガスへの嗜好の高まりと、Bluetooth対応発電機の登場は、市場の大きな需要につながります。
目次
第1章 エグゼクティブサマリー
- 市場概要
第2章 Technavioの分析
- 価格感度・ライフサイクル・顧客購入バスケット・採用率・購入基準の分析
- インプットの重要性と差別化の要因
- ディスラプションの要因
- 促進要因と課題の影響
第3章 市場情勢
- 市場エコシステム
- 市場の特徴
- バリューチェーン分析
第4章 市場規模
- 市場の定義
- 市場セグメント分析
- 市場規模(2024年)
- 市場の見通し(2024年~2029年)
第5章 市場規模実績
- ポータブル発電機の世界市場(2019年~2023年)
- タイプセグメント分析(2019年~2023年)
- エンドユーザーセグメント分析(2019年~2023年)
- 地域セグメント分析(2019年~2023年)
- 国セグメント分析(2019年~2023年)
第6章 定性分析
- AIの影響:ポータブル発電機の世界市場
第7章 ファイブフォース分析
- ファイブフォースの要約
- 買い手の交渉力
- 供給企業の交渉力
- 新規参入業者の脅威
- 代替品の脅威
- 競争の脅威
- 市況
第8章 市場セグメンテーション:タイプ別
- 市場セグメント
- 比較:タイプ別
- ガソリン:市場規模と予測(2024年~2029年)
- ディーゼル:市場規模と予測(2024年~2029年)
- ガス:市場規模と予測(2024年~2029年)
- 市場機会:タイプ別
第9章 市場セグメンテーション:エンドユーザー別
- 市場セグメント
- 比較:エンドユーザー別
- 住宅:市場規模と予測(2024年~2029年)
- 産業とインフラ:市場規模と予測(2024年~2029年)
- 商業:市場規模と予測(2024年~2029年)
- 市場機会:エンドユーザー別
第10章 顧客情勢
- 顧客情勢の概要
第11章 地域別情勢
- 地域別セグメンテーション
- 地域別比較
- アジア太平洋:市場規模と予測(2024年~2029年)
- 欧州:市場規模と予測(2024年~2029年)
- 北米:市場規模と予測(2024年~2029年)
- 南米:市場規模と予測(2024年~2029年)
- 中東・アフリカ:市場規模と予測(2024年~2029年)
- 米国:市場規模と予測(2024年~2029年)
- 中国:市場規模と予測(2024年~2029年)
- インド:市場規模と予測(2024年~2029年)
- ドイツ:市場規模と予測(2024年~2029年)
- 英国:市場規模と予測(2024年~2029年)
- 日本:市場規模と予測(2024年~2029年)
- カナダ:市場規模と予測(2024年~2029年)
- フランス:市場規模と予測(2024年~2029年)
- オーストラリア:市場規模と予測(2024年~2029年)
- ブラジル:市場規模と予測(2024年~2029年)
- 市場機会:地域情勢別
第12章 促進要因・課題・機会・抑制要因
- 市場促進要因
- 市場の課題
- 促進要因と課題の影響
- 市場の機会・抑制要因
第13章 競合情勢
- 概要
- 競合情勢
- ディスラプションの状況
- 業界のリスク
第14章 競合分析
- 企業プロファイル
- 企業ランキング指数
- 企業の市場ポジショニング
- Atlas Copco AB
- Briggs and Stratton LLC
- Caterpillar Inc.
- Cummins Inc.
- Deere and Co.
- Doosan Corp.
- Generac Holdings Inc.
- Honda Motor Co. Ltd.
- ITOCHU Corp.
- KAZANCI HOLDING
- Kirloskar Oil Engines Ltd.
- Siemens AG
- Wacker Neuson SE
- Yamaha Motor Co. Ltd.
- Yanmar Holdings Co. Ltd.
第15章 付録
Exhibits:
- Exhibits1: Executive Summary - Chart on Market Overview
- Exhibits2: Executive Summary - Data Table on Market Overview
- Exhibits3: Executive Summary - Chart on Global Market Characteristics
- Exhibits4: Executive Summary - Chart on Market By Geographical Landscape
- Exhibits5: Executive Summary - Chart on Market Segmentation by Type
- Exhibits6: Executive Summary - Chart on Market Segmentation by End-user
- Exhibits7: Executive Summary - Chart on Incremental Growth
- Exhibits8: Executive Summary - Data Table on Incremental Growth
- Exhibits9: Executive Summary - Chart on Company Market Positioning
- Exhibits10: Analysis of price sensitivity, lifecycle, customer purchase basket, adoption rates, and purchase criteria
- Exhibits11: Overview on criticality of inputs and factors of differentiation
- Exhibits12: Overview on factors of disruption
- Exhibits13: Impact of drivers and challenges in 2024 and 2029
- Exhibits14: Parent Market
- Exhibits15: Data Table on - Parent Market
- Exhibits16: Market characteristics analysis
- Exhibits17: Value chain analysis
- Exhibits18: Offerings of companies included in the market definition
- Exhibits19: Market segments
- Exhibits20: Chart on Global - Market size and forecast 2024-2029 ($ million)
- Exhibits21: Data Table on Global - Market size and forecast 2024-2029 ($ million)
- Exhibits22: Chart on Global Market: Year-over-year growth 2024-2029 (%)
- Exhibits23: Data Table on Global Market: Year-over-year growth 2024-2029 (%)
- Exhibits24: Historic Market Size - Data Table on Global Portable Generator Market 2019 - 2023 ($ million)
- Exhibits25: Historic Market Size - Type Segment 2019 - 2023 ($ million)
- Exhibits26: Historic Market Size - End-user Segment 2019 - 2023 ($ million)
- Exhibits27: Historic Market Size - Geography Segment 2019 - 2023 ($ million)
- Exhibits28: Historic Market Size - Country Segment 2019 - 2023 ($ million)
- Exhibits29: Five forces analysis - Comparison between 2024 and 2029
- Exhibits30: Bargaining power of buyers - Impact of key factors 2024 and 2029
- Exhibits31: Bargaining power of suppliers - Impact of key factors in 2024 and 2029
- Exhibits32: Threat of new entrants - Impact of key factors in 2024 and 2029
- Exhibits33: Threat of substitutes - Impact of key factors in 2024 and 2029
- Exhibits34: Threat of rivalry - Impact of key factors in 2024 and 2029
- Exhibits35: Chart on Market condition - Five forces 2024 and 2029
- Exhibits36: Chart on Type - Market share 2024-2029 (%)
- Exhibits37: Data Table on Type - Market share 2024-2029 (%)
- Exhibits38: Chart on Comparison by Type
- Exhibits39: Data Table on Comparison by Type
- Exhibits40: Chart on Gasoline - Market size and forecast 2024-2029 ($ million)
- Exhibits41: Data Table on Gasoline - Market size and forecast 2024-2029 ($ million)
- Exhibits42: Chart on Gasoline - Year-over-year growth 2024-2029 (%)
- Exhibits43: Data Table on Gasoline - Year-over-year growth 2024-2029 (%)
- Exhibits44: Chart on Diesel - Market size and forecast 2024-2029 ($ million)
- Exhibits45: Data Table on Diesel - Market size and forecast 2024-2029 ($ million)
- Exhibits46: Chart on Diesel - Year-over-year growth 2024-2029 (%)
- Exhibits47: Data Table on Diesel - Year-over-year growth 2024-2029 (%)
- Exhibits48: Chart on Gas - Market size and forecast 2024-2029 ($ million)
- Exhibits49: Data Table on Gas - Market size and forecast 2024-2029 ($ million)
- Exhibits50: Chart on Gas - Year-over-year growth 2024-2029 (%)
- Exhibits51: Data Table on Gas - Year-over-year growth 2024-2029 (%)
- Exhibits52: Market opportunity by Type ($ million)
- Exhibits53: Data Table on Market opportunity by Type ($ million)
- Exhibits54: Chart on End-user - Market share 2024-2029 (%)
- Exhibits55: Data Table on End-user - Market share 2024-2029 (%)
- Exhibits56: Chart on Comparison by End-user
- Exhibits57: Data Table on Comparison by End-user
- Exhibits58: Chart on Residential - Market size and forecast 2024-2029 ($ million)
- Exhibits59: Data Table on Residential - Market size and forecast 2024-2029 ($ million)
- Exhibits60: Chart on Residential - Year-over-year growth 2024-2029 (%)
- Exhibits61: Data Table on Residential - Year-over-year growth 2024-2029 (%)
- Exhibits62: Chart on Industrial and infrastructure - Market size and forecast 2024-2029 ($ million)
- Exhibits63: Data Table on Industrial and infrastructure - Market size and forecast 2024-2029 ($ million)
- Exhibits64: Chart on Industrial and infrastructure - Year-over-year growth 2024-2029 (%)
- Exhibits65: Data Table on Industrial and infrastructure - Year-over-year growth 2024-2029 (%)
- Exhibits66: Chart on Commercial - Market size and forecast 2024-2029 ($ million)
- Exhibits67: Data Table on Commercial - Market size and forecast 2024-2029 ($ million)
- Exhibits68: Chart on Commercial - Year-over-year growth 2024-2029 (%)
- Exhibits69: Data Table on Commercial - Year-over-year growth 2024-2029 (%)
- Exhibits70: Market opportunity by End-user ($ million)
- Exhibits71: Data Table on Market opportunity by End-user ($ million)
- Exhibits72: Analysis of price sensitivity, lifecycle, customer purchase basket, adoption rates, and purchase criteria
- Exhibits73: Chart on Market share By Geographical Landscape 2024-2029 (%)
- Exhibits74: Data Table on Market share By Geographical Landscape 2024-2029 (%)
- Exhibits75: Chart on Geographic comparison
- Exhibits76: Data Table on Geographic comparison
- Exhibits77: Chart on APAC - Market size and forecast 2024-2029 ($ million)
- Exhibits78: Data Table on APAC - Market size and forecast 2024-2029 ($ million)
- Exhibits79: Chart on APAC - Year-over-year growth 2024-2029 (%)
- Exhibits80: Data Table on APAC - Year-over-year growth 2024-2029 (%)
- Exhibits81: Chart on Europe - Market size and forecast 2024-2029 ($ million)
- Exhibits82: Data Table on Europe - Market size and forecast 2024-2029 ($ million)
- Exhibits83: Chart on Europe - Year-over-year growth 2024-2029 (%)
- Exhibits84: Data Table on Europe - Year-over-year growth 2024-2029 (%)
- Exhibits85: Chart on North America - Market size and forecast 2024-2029 ($ million)
- Exhibits86: Data Table on North America - Market size and forecast 2024-2029 ($ million)
- Exhibits87: Chart on North America - Year-over-year growth 2024-2029 (%)
- Exhibits88: Data Table on North America - Year-over-year growth 2024-2029 (%)
- Exhibits89: Chart on South America - Market size and forecast 2024-2029 ($ million)
- Exhibits90: Data Table on South America - Market size and forecast 2024-2029 ($ million)
- Exhibits91: Chart on South America - Year-over-year growth 2024-2029 (%)
- Exhibits92: Data Table on South America - Year-over-year growth 2024-2029 (%)
- Exhibits93: Chart on Middle East and Africa - Market size and forecast 2024-2029 ($ million)
- Exhibits94: Data Table on Middle East and Africa - Market size and forecast 2024-2029 ($ million)
- Exhibits95: Chart on Middle East and Africa - Year-over-year growth 2024-2029 (%)
- Exhibits96: Data Table on Middle East and Africa - Year-over-year growth 2024-2029 (%)
- Exhibits97: Chart on US - Market size and forecast 2024-2029 ($ million)
- Exhibits98: Data Table on US - Market size and forecast 2024-2029 ($ million)
- Exhibits99: Chart on US - Year-over-year growth 2024-2029 (%)
- Exhibits100: Data Table on US - Year-over-year growth 2024-2029 (%)
- Exhibits101: Chart on China - Market size and forecast 2024-2029 ($ million)
- Exhibits102: Data Table on China - Market size and forecast 2024-2029 ($ million)
- Exhibits103: Chart on China - Year-over-year growth 2024-2029 (%)
- Exhibits104: Data Table on China - Year-over-year growth 2024-2029 (%)
- Exhibits105: Chart on India - Market size and forecast 2024-2029 ($ million)
- Exhibits106: Data Table on India - Market size and forecast 2024-2029 ($ million)
- Exhibits107: Chart on India - Year-over-year growth 2024-2029 (%)
- Exhibits108: Data Table on India - Year-over-year growth 2024-2029 (%)
- Exhibits109: Chart on Germany - Market size and forecast 2024-2029 ($ million)
- Exhibits110: Data Table on Germany - Market size and forecast 2024-2029 ($ million)
- Exhibits111: Chart on Germany - Year-over-year growth 2024-2029 (%)
- Exhibits112: Data Table on Germany - Year-over-year growth 2024-2029 (%)
- Exhibits113: Chart on UK - Market size and forecast 2024-2029 ($ million)
- Exhibits114: Data Table on UK - Market size and forecast 2024-2029 ($ million)
- Exhibits115: Chart on UK - Year-over-year growth 2024-2029 (%)
- Exhibits116: Data Table on UK - Year-over-year growth 2024-2029 (%)
- Exhibits117: Chart on Japan - Market size and forecast 2024-2029 ($ million)
- Exhibits118: Data Table on Japan - Market size and forecast 2024-2029 ($ million)
- Exhibits119: Chart on Japan - Year-over-year growth 2024-2029 (%)
- Exhibits120: Data Table on Japan - Year-over-year growth 2024-2029 (%)
- Exhibits121: Chart on Canada - Market size and forecast 2024-2029 ($ million)
- Exhibits122: Data Table on Canada - Market size and forecast 2024-2029 ($ million)
- Exhibits123: Chart on Canada - Year-over-year growth 2024-2029 (%)
- Exhibits124: Data Table on Canada - Year-over-year growth 2024-2029 (%)
- Exhibits125: Chart on France - Market size and forecast 2024-2029 ($ million)
- Exhibits126: Data Table on France - Market size and forecast 2024-2029 ($ million)
- Exhibits127: Chart on France - Year-over-year growth 2024-2029 (%)
- Exhibits128: Data Table on France - Year-over-year growth 2024-2029 (%)
- Exhibits129: Chart on Australia - Market size and forecast 2024-2029 ($ million)
- Exhibits130: Data Table on Australia - Market size and forecast 2024-2029 ($ million)
- Exhibits131: Chart on Australia - Year-over-year growth 2024-2029 (%)
- Exhibits132: Data Table on Australia - Year-over-year growth 2024-2029 (%)
- Exhibits133: Chart on Brazil - Market size and forecast 2024-2029 ($ million)
- Exhibits134: Data Table on Brazil - Market size and forecast 2024-2029 ($ million)
- Exhibits135: Chart on Brazil - Year-over-year growth 2024-2029 (%)
- Exhibits136: Data Table on Brazil - Year-over-year growth 2024-2029 (%)
- Exhibits137: Market opportunity By Geographical Landscape ($ million)
- Exhibits138: Data Tables on Market opportunity By Geographical Landscape ($ million)
- Exhibits139: Impact of drivers and challenges in 2024 and 2029
- Exhibits140: Overview on criticality of inputs and factors of differentiation
- Exhibits141: Overview on factors of disruption
- Exhibits142: Impact of key risks on business
- Exhibits143: Companies covered
- Exhibits144: Company ranking index
- Exhibits145: Matrix on companies position and classification
- Exhibits146: Atlas Copco AB - Overview
- Exhibits147: Atlas Copco AB - Business segments
- Exhibits148: Atlas Copco AB - Key news
- Exhibits149: Atlas Copco AB - Key offerings
- Exhibits150: Atlas Copco AB - Segment focus
- Exhibits151: SWOT
- Exhibits152: Briggs and Stratton LLC - Overview
- Exhibits153: Briggs and Stratton LLC - Product / Service
- Exhibits154: Briggs and Stratton LLC - Key news
- Exhibits155: Briggs and Stratton LLC - Key offerings
- Exhibits156: SWOT
- Exhibits157: Caterpillar Inc. - Overview
- Exhibits158: Caterpillar Inc. - Business segments
- Exhibits159: Caterpillar Inc. - Key news
- Exhibits160: Caterpillar Inc. - Key offerings
- Exhibits161: Caterpillar Inc. - Segment focus
- Exhibits162: SWOT
- Exhibits163: Cummins Inc. - Overview
- Exhibits164: Cummins Inc. - Business segments
- Exhibits165: Cummins Inc. - Key news
- Exhibits166: Cummins Inc. - Key offerings
- Exhibits167: Cummins Inc. - Segment focus
- Exhibits168: SWOT
- Exhibits169: Deere and Co. - Overview
- Exhibits170: Deere and Co. - Business segments
- Exhibits171: Deere and Co. - Key news
- Exhibits172: Deere and Co. - Key offerings
- Exhibits173: Deere and Co. - Segment focus
- Exhibits174: SWOT
- Exhibits175: Doosan Corp. - Overview
- Exhibits176: Doosan Corp. - Business segments
- Exhibits177: Doosan Corp. - Key news
- Exhibits178: Doosan Corp. - Key offerings
- Exhibits179: Doosan Corp. - Segment focus
- Exhibits180: SWOT
- Exhibits181: Generac Holdings Inc. - Overview
- Exhibits182: Generac Holdings Inc. - Business segments
- Exhibits183: Generac Holdings Inc. - Key news
- Exhibits184: Generac Holdings Inc. - Key offerings
- Exhibits185: Generac Holdings Inc. - Segment focus
- Exhibits186: SWOT
- Exhibits187: Honda Motor Co. Ltd. - Overview
- Exhibits188: Honda Motor Co. Ltd. - Business segments
- Exhibits189: Honda Motor Co. Ltd. - Key news
- Exhibits190: Honda Motor Co. Ltd. - Key offerings
- Exhibits191: Honda Motor Co. Ltd. - Segment focus
- Exhibits192: SWOT
- Exhibits193: ITOCHU Corp. - Overview
- Exhibits194: ITOCHU Corp. - Business segments
- Exhibits195: ITOCHU Corp. - Key offerings
- Exhibits196: ITOCHU Corp. - Segment focus
- Exhibits197: SWOT
- Exhibits198: KAZANCI HOLDING - Overview
- Exhibits199: KAZANCI HOLDING - Product / Service
- Exhibits200: KAZANCI HOLDING - Key offerings
- Exhibits201: SWOT
- Exhibits202: Kirloskar Oil Engines Ltd. - Overview
- Exhibits203: Kirloskar Oil Engines Ltd. - Product / Service
- Exhibits204: Kirloskar Oil Engines Ltd. - Key news
- Exhibits205: Kirloskar Oil Engines Ltd. - Key offerings
- Exhibits206: SWOT
- Exhibits207: Siemens AG - Overview
- Exhibits208: Siemens AG - Business segments
- Exhibits209: Siemens AG - Key news
- Exhibits210: Siemens AG - Key offerings
- Exhibits211: Siemens AG - Segment focus
- Exhibits212: SWOT
- Exhibits213: Wacker Neuson SE - Overview
- Exhibits214: Wacker Neuson SE - Product / Service
- Exhibits215: Wacker Neuson SE - Key offerings
- Exhibits216: SWOT
- Exhibits217: Yamaha Motor Co. Ltd. - Overview
- Exhibits218: Yamaha Motor Co. Ltd. - Business segments
- Exhibits219: Yamaha Motor Co. Ltd. - Key offerings
- Exhibits220: Yamaha Motor Co. Ltd. - Segment focus
- Exhibits221: SWOT
- Exhibits222: Yanmar Holdings Co. Ltd. - Overview
- Exhibits223: Yanmar Holdings Co. Ltd. - Product / Service
- Exhibits224: Yanmar Holdings Co. Ltd. - Key news
- Exhibits225: Yanmar Holdings Co. Ltd. - Key offerings
- Exhibits226: SWOT
- Exhibits227: Inclusions checklist
- Exhibits228: Exclusions checklist
- Exhibits229: Currency conversion rates for US$
- Exhibits230: Research methodology
- Exhibits231: Information sources
- Exhibits232: Data validation
- Exhibits233: Validation techniques employed for market sizing
- Exhibits234: Data synthesis
- Exhibits235: 360 degree market analysis
- Exhibits236: List of abbreviations
Portable Generator Market 2025-2029
The portable generator market is forecasted to grow by USD 1751.8 mn during 2024-2029, accelerating at a CAGR of 6% during the forecast period. The report on the portable generator market provides a holistic analysis, market size and forecast, trends, growth drivers, and challenges, as well as vendor analysis covering around 25 vendors.
The report offers an up-to-date analysis regarding the current market scenario, the latest trends and drivers, and the overall market environment. The market is driven by rapid urbanization and industrialization, growing instances of power grid failure, and increasing incidents of natural calamities leading to power outages.
| Market Scope | |
|---|---|
| Base Year | 2025 |
| End Year | 2029 |
| Series Year | 2025-2029 |
| Growth Momentum | Accelerate |
| YOY 2025 | 5.4% |
| CAGR | 6% |
| Incremental Value | $1751.8 mn |
Technavio's portable generator market is segmented as below:
By Type
- Gasoline
- Diesel
- Gas
By End-user
- Residential
- Industrial and infrastructure
- Commercial
By Geographical Landscape
- APAC
- Europe
- North America
- South America
- Middle East and Africa
This study identifies the emergence of dual-fuel generator technology as one of the prime reasons driving the portable generator market growth during the next few years. Also, rising preference for gas as fuel source for generators and advent of bluetooth-enabled generators will lead to sizable demand in the market.
The report on the portable generator market covers the following areas:
- Portable Generator Market sizing
- Portable Generator Market forecast
- Portable Generator Market industry analysis
The robust vendor analysis is designed to help clients improve their market position, and in line with this, this report provides a detailed analysis of several leading portable generator market vendors that include Atlas Copco AB, Briggs and Stratton LLC, Caterpillar Inc., Cummins Inc., Deere and Co., Doosan Corp., Eaton Corp plc, Generac Holdings Inc., H.S. ENGINEERS, Himalayan Power Machines Co., Honda Motor Co. Ltd., Honeywell International Inc., ITOCHU Corp., KAZANCI HOLDING, Kirloskar Oil Engines Ltd., Siemens AG, Skyline Power Solutions, Wacker Neuson SE, Yamaha Motor Co. Ltd., and Yanmar Holdings Co. Ltd.. Also, the portable generator market analysis report includes information on upcoming trends and challenges that will influence market growth. This is to help companies strategize and leverage all forthcoming growth opportunities.
The study was conducted using an objective combination of primary and secondary information including inputs from key participants in the industry. The report contains a comprehensive market and vendor landscape in addition to an analysis of the key vendors.
The publisher presents a detailed picture of the market by the way of study, synthesis, and summation of data from multiple sources by an analysis of key parameters such as profit, pricing, competition, and promotions. It presents various market facets by identifying the key industry influencers. The data presented is comprehensive, reliable, and a result of extensive primary and secondary research. The market research reports provide a complete competitive landscape and an in-depth vendor selection methodology and analysis using qualitative and quantitative research to forecast accurate market growth.
Table of Contents
1 Executive Summary
- 1.1 Market overview
- Executive Summary - Chart on Market Overview
- Executive Summary - Data Table on Market Overview
- Executive Summary - Chart on Global Market Characteristics
- Executive Summary - Chart on Market By Geographical Landscape
- Executive Summary - Chart on Market Segmentation by Type
- Executive Summary - Chart on Market Segmentation by End-user
- Executive Summary - Chart on Incremental Growth
- Executive Summary - Data Table on Incremental Growth
- Executive Summary - Chart on Company Market Positioning
2 Technavio Analysis
- 2.1 Analysis of price sensitivity, lifecycle, customer purchase basket, adoption rates, and purchase criteria
- Analysis of price sensitivity, lifecycle, customer purchase basket, adoption rates, and purchase criteria
- 2.2 Criticality of inputs and Factors of differentiation
- Overview on criticality of inputs and factors of differentiation
- 2.3 Factors of disruption
- Overview on factors of disruption
- 2.4 Impact of drivers and challenges
- Impact of drivers and challenges in 2024 and 2029
3 Market Landscape
- 3.1 Market ecosystem
- Parent Market
- Data Table on - Parent Market
- 3.2 Market characteristics
- Market characteristics analysis
- 3.3 Value chain analysis
- Value chain analysis
4 Market Sizing
- 4.1 Market definition
- Offerings of companies included in the market definition
- 4.2 Market segment analysis
- Market segments
- 4.3 Market size 2024
- 4.4 Market outlook: Forecast for 2024-2029
- Chart on Global - Market size and forecast 2024-2029 ($ million)
- Data Table on Global - Market size and forecast 2024-2029 ($ million)
- Chart on Global Market: Year-over-year growth 2024-2029 (%)
- Data Table on Global Market: Year-over-year growth 2024-2029 (%)
5 Historic Market Size
- 5.1 Global Portable Generator Market 2019 - 2023
- Historic Market Size - Data Table on Global Portable Generator Market 2019 - 2023 ($ million)
- 5.2 Type segment analysis 2019 - 2023
- Historic Market Size - Type Segment 2019 - 2023 ($ million)
- 5.3 End-user segment analysis 2019 - 2023
- Historic Market Size - End-user Segment 2019 - 2023 ($ million)
- 5.4 Geography segment analysis 2019 - 2023
- Historic Market Size - Geography Segment 2019 - 2023 ($ million)
- 5.5 Country segment analysis 2019 - 2023
- Historic Market Size - Country Segment 2019 - 2023 ($ million)
6 Qualitative Analysis
- 6.1 Impact of AI on Global Portable Generator Market
7 Five Forces Analysis
- 7.1 Five forces summary
- Five forces analysis - Comparison between 2024 and 2029
- 7.2 Bargaining power of buyers
- Bargaining power of buyers - Impact of key factors 2024 and 2029
- 7.3 Bargaining power of suppliers
- Bargaining power of suppliers - Impact of key factors in 2024 and 2029
- 7.4 Threat of new entrants
- Threat of new entrants - Impact of key factors in 2024 and 2029
- 7.5 Threat of substitutes
- Threat of substitutes - Impact of key factors in 2024 and 2029
- 7.6 Threat of rivalry
- Threat of rivalry - Impact of key factors in 2024 and 2029
- 7.7 Market condition
- Chart on Market condition - Five forces 2024 and 2029
8 Market Segmentation by Type
- 8.1 Market segments
- Chart on Type - Market share 2024-2029 (%)
- Data Table on Type - Market share 2024-2029 (%)
- 8.2 Comparison by Type
- Chart on Comparison by Type
- Data Table on Comparison by Type
- 8.3 Gasoline - Market size and forecast 2024-2029
- Chart on Gasoline - Market size and forecast 2024-2029 ($ million)
- Data Table on Gasoline - Market size and forecast 2024-2029 ($ million)
- Chart on Gasoline - Year-over-year growth 2024-2029 (%)
- Data Table on Gasoline - Year-over-year growth 2024-2029 (%)
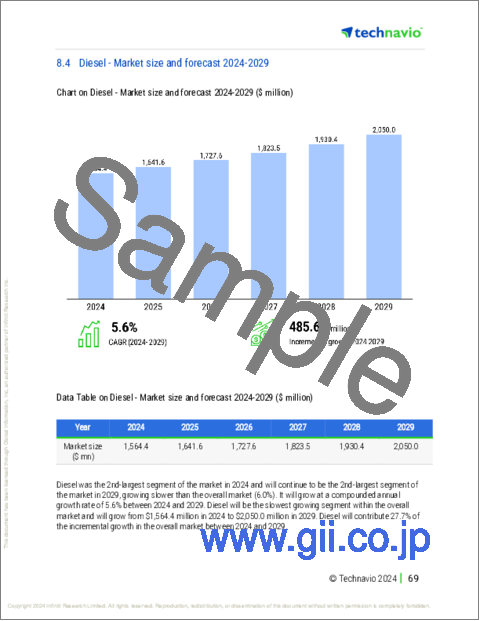
- 8.4 Diesel - Market size and forecast 2024-2029
- Chart on Diesel - Market size and forecast 2024-2029 ($ million)
- Data Table on Diesel - Market size and forecast 2024-2029 ($ million)
- Chart on Diesel - Year-over-year growth 2024-2029 (%)
- Data Table on Diesel - Year-over-year growth 2024-2029 (%)
- 8.5 Gas - Market size and forecast 2024-2029
- Chart on Gas - Market size and forecast 2024-2029 ($ million)
- Data Table on Gas - Market size and forecast 2024-2029 ($ million)
- Chart on Gas - Year-over-year growth 2024-2029 (%)
- Data Table on Gas - Year-over-year growth 2024-2029 (%)
- 8.6 Market opportunity by Type
- Market opportunity by Type ($ million)
- Data Table on Market opportunity by Type ($ million)
9 Market Segmentation by End-user
- 9.1 Market segments
- Chart on End-user - Market share 2024-2029 (%)
- Data Table on End-user - Market share 2024-2029 (%)
- 9.2 Comparison by End-user
- Chart on Comparison by End-user
- Data Table on Comparison by End-user
- 9.3 Residential - Market size and forecast 2024-2029
- Chart on Residential - Market size and forecast 2024-2029 ($ million)
- Data Table on Residential - Market size and forecast 2024-2029 ($ million)
- Chart on Residential - Year-over-year growth 2024-2029 (%)
- Data Table on Residential - Year-over-year growth 2024-2029 (%)
- 9.4 Industrial and infrastructure - Market size and forecast 2024-2029
- Chart on Industrial and infrastructure - Market size and forecast 2024-2029 ($ million)
- Data Table on Industrial and infrastructure - Market size and forecast 2024-2029 ($ million)
- Chart on Industrial and infrastructure - Year-over-year growth 2024-2029 (%)
- Data Table on Industrial and infrastructure - Year-over-year growth 2024-2029 (%)
- 9.5 Commercial - Market size and forecast 2024-2029
- Chart on Commercial - Market size and forecast 2024-2029 ($ million)
- Data Table on Commercial - Market size and forecast 2024-2029 ($ million)
- Chart on Commercial - Year-over-year growth 2024-2029 (%)
- Data Table on Commercial - Year-over-year growth 2024-2029 (%)
- 9.6 Market opportunity by End-user
- Market opportunity by End-user ($ million)
- Data Table on Market opportunity by End-user ($ million)
10 Customer Landscape
- 10.1 Customer landscape overview
- Analysis of price sensitivity, lifecycle, customer purchase basket, adoption rates, and purchase criteria
11 Geographic Landscape
- 11.1 Geographic segmentation
- Chart on Market share By Geographical Landscape 2024-2029 (%)
- Data Table on Market share By Geographical Landscape 2024-2029 (%)
- 11.2 Geographic comparison
- Chart on Geographic comparison
- Data Table on Geographic comparison
- 11.3 APAC - Market size and forecast 2024-2029
- Chart on APAC - Market size and forecast 2024-2029 ($ million)
- Data Table on APAC - Market size and forecast 2024-2029 ($ million)
- Chart on APAC - Year-over-year growth 2024-2029 (%)
- Data Table on APAC - Year-over-year growth 2024-2029 (%)
- 11.4 Europe - Market size and forecast 2024-2029
- Chart on Europe - Market size and forecast 2024-2029 ($ million)
- Data Table on Europe - Market size and forecast 2024-2029 ($ million)
- Chart on Europe - Year-over-year growth 2024-2029 (%)
- Data Table on Europe - Year-over-year growth 2024-2029 (%)
- 11.5 North America - Market size and forecast 2024-2029
- Chart on North America - Market size and forecast 2024-2029 ($ million)
- Data Table on North America - Market size and forecast 2024-2029 ($ million)
- Chart on North America - Year-over-year growth 2024-2029 (%)
- Data Table on North America - Year-over-year growth 2024-2029 (%)
- 11.6 South America - Market size and forecast 2024-2029
- Chart on South America - Market size and forecast 2024-2029 ($ million)
- Data Table on South America - Market size and forecast 2024-2029 ($ million)
- Chart on South America - Year-over-year growth 2024-2029 (%)
- Data Table on South America - Year-over-year growth 2024-2029 (%)
- 11.7 Middle East and Africa - Market size and forecast 2024-2029
- Chart on Middle East and Africa - Market size and forecast 2024-2029 ($ million)
- Data Table on Middle East and Africa - Market size and forecast 2024-2029 ($ million)
- Chart on Middle East and Africa - Year-over-year growth 2024-2029 (%)
- Data Table on Middle East and Africa - Year-over-year growth 2024-2029 (%)
- 11.8 US - Market size and forecast 2024-2029
- Chart on US - Market size and forecast 2024-2029 ($ million)
- Data Table on US - Market size and forecast 2024-2029 ($ million)
- Chart on US - Year-over-year growth 2024-2029 (%)
- Data Table on US - Year-over-year growth 2024-2029 (%)
- 11.9 China - Market size and forecast 2024-2029
- Chart on China - Market size and forecast 2024-2029 ($ million)
- Data Table on China - Market size and forecast 2024-2029 ($ million)
- Chart on China - Year-over-year growth 2024-2029 (%)
- Data Table on China - Year-over-year growth 2024-2029 (%)
- 11.10 India - Market size and forecast 2024-2029
- Chart on India - Market size and forecast 2024-2029 ($ million)
- Data Table on India - Market size and forecast 2024-2029 ($ million)
- Chart on India - Year-over-year growth 2024-2029 (%)
- Data Table on India - Year-over-year growth 2024-2029 (%)
- 11.11 Germany - Market size and forecast 2024-2029
- Chart on Germany - Market size and forecast 2024-2029 ($ million)
- Data Table on Germany - Market size and forecast 2024-2029 ($ million)
- Chart on Germany - Year-over-year growth 2024-2029 (%)
- Data Table on Germany - Year-over-year growth 2024-2029 (%)
- 11.12 UK - Market size and forecast 2024-2029
- Chart on UK - Market size and forecast 2024-2029 ($ million)
- Data Table on UK - Market size and forecast 2024-2029 ($ million)
- Chart on UK - Year-over-year growth 2024-2029 (%)
- Data Table on UK - Year-over-year growth 2024-2029 (%)
- 11.13 Japan - Market size and forecast 2024-2029
- Chart on Japan - Market size and forecast 2024-2029 ($ million)
- Data Table on Japan - Market size and forecast 2024-2029 ($ million)
- Chart on Japan - Year-over-year growth 2024-2029 (%)
- Data Table on Japan - Year-over-year growth 2024-2029 (%)
- 11.14 Canada - Market size and forecast 2024-2029
- Chart on Canada - Market size and forecast 2024-2029 ($ million)
- Data Table on Canada - Market size and forecast 2024-2029 ($ million)
- Chart on Canada - Year-over-year growth 2024-2029 (%)
- Data Table on Canada - Year-over-year growth 2024-2029 (%)
- 11.15 France - Market size and forecast 2024-2029
- Chart on France - Market size and forecast 2024-2029 ($ million)
- Data Table on France - Market size and forecast 2024-2029 ($ million)
- Chart on France - Year-over-year growth 2024-2029 (%)
- Data Table on France - Year-over-year growth 2024-2029 (%)
- 11.16 Australia - Market size and forecast 2024-2029
- Chart on Australia - Market size and forecast 2024-2029 ($ million)
- Data Table on Australia - Market size and forecast 2024-2029 ($ million)
- Chart on Australia - Year-over-year growth 2024-2029 (%)
- Data Table on Australia - Year-over-year growth 2024-2029 (%)
- 11.17 Brazil - Market size and forecast 2024-2029
- Chart on Brazil - Market size and forecast 2024-2029 ($ million)
- Data Table on Brazil - Market size and forecast 2024-2029 ($ million)
- Chart on Brazil - Year-over-year growth 2024-2029 (%)
- Data Table on Brazil - Year-over-year growth 2024-2029 (%)
- 11.18 Market opportunity By Geographical Landscape
- Market opportunity By Geographical Landscape ($ million)
- Data Tables on Market opportunity By Geographical Landscape ($ million)
12 Drivers, Challenges, and Opportunity/Restraints
- 12.1 Market drivers
- 12.2 Market challenges
- 12.3 Impact of drivers and challenges
- Impact of drivers and challenges in 2024 and 2029
- 12.4 Market opportunities/restraints
13 Competitive Landscape
- 13.1 Overview
- 13.2 Competitive Landscape
- Overview on criticality of inputs and factors of differentiation
- 13.3 Landscape disruption
- Overview on factors of disruption
- 13.4 Industry risks
- Impact of key risks on business
14 Competitive Analysis
- 14.1 Companies profiled
- Companies covered
- 14.2 Company ranking index
- Company ranking index
- 14.3 Market positioning of companies
- Matrix on companies position and classification
- 14.4 Atlas Copco AB
- Atlas Copco AB - Overview
- Atlas Copco AB - Business segments
- Atlas Copco AB - Key news
- Atlas Copco AB - Key offerings
- Atlas Copco AB - Segment focus
- SWOT
- 14.5 Briggs and Stratton LLC
- Briggs and Stratton LLC - Overview
- Briggs and Stratton LLC - Product / Service
- Briggs and Stratton LLC - Key news
- Briggs and Stratton LLC - Key offerings
- SWOT
- 14.6 Caterpillar Inc.
- Caterpillar Inc. - Overview
- Caterpillar Inc. - Business segments
- Caterpillar Inc. - Key news
- Caterpillar Inc. - Key offerings
- Caterpillar Inc. - Segment focus
- SWOT
- 14.7 Cummins Inc.
- Cummins Inc. - Overview
- Cummins Inc. - Business segments
- Cummins Inc. - Key news
- Cummins Inc. - Key offerings
- Cummins Inc. - Segment focus
- SWOT
- 14.8 Deere and Co.
- Deere and Co. - Overview
- Deere and Co. - Business segments
- Deere and Co. - Key news
- Deere and Co. - Key offerings
- Deere and Co. - Segment focus
- SWOT
- 14.9 Doosan Corp.
- Doosan Corp. - Overview
- Doosan Corp. - Business segments
- Doosan Corp. - Key news
- Doosan Corp. - Key offerings
- Doosan Corp. - Segment focus
- SWOT
- 14.10 Generac Holdings Inc.
- Generac Holdings Inc. - Overview
- Generac Holdings Inc. - Business segments
- Generac Holdings Inc. - Key news
- Generac Holdings Inc. - Key offerings
- Generac Holdings Inc. - Segment focus
- SWOT
- 14.11 Honda Motor Co. Ltd.
- Honda Motor Co. Ltd. - Overview
- Honda Motor Co. Ltd. - Business segments
- Honda Motor Co. Ltd. - Key news
- Honda Motor Co. Ltd. - Key offerings
- Honda Motor Co. Ltd. - Segment focus
- SWOT
- 14.12 ITOCHU Corp.
- ITOCHU Corp. - Overview
- ITOCHU Corp. - Business segments
- ITOCHU Corp. - Key offerings
- ITOCHU Corp. - Segment focus
- SWOT
- 14.13 KAZANCI HOLDING
- KAZANCI HOLDING - Overview
- KAZANCI HOLDING - Product / Service
- KAZANCI HOLDING - Key offerings
- SWOT
- 14.14 Kirloskar Oil Engines Ltd.
- Kirloskar Oil Engines Ltd. - Overview
- Kirloskar Oil Engines Ltd. - Product / Service
- Kirloskar Oil Engines Ltd. - Key news
- Kirloskar Oil Engines Ltd. - Key offerings
- SWOT
- 14.15 Siemens AG
- Siemens AG - Overview
- Siemens AG - Business segments
- Siemens AG - Key news
- Siemens AG - Key offerings
- Siemens AG - Segment focus
- SWOT
- 14.16 Wacker Neuson SE
- Wacker Neuson SE - Overview
- Wacker Neuson SE - Product / Service
- Wacker Neuson SE - Key offerings
- SWOT
- 14.17 Yamaha Motor Co. Ltd.
- Yamaha Motor Co. Ltd. - Overview
- Yamaha Motor Co. Ltd. - Business segments
- Yamaha Motor Co. Ltd. - Key offerings
- Yamaha Motor Co. Ltd. - Segment focus
- SWOT
- 14.18 Yanmar Holdings Co. Ltd.
- Yanmar Holdings Co. Ltd. - Overview
- Yanmar Holdings Co. Ltd. - Product / Service
- Yanmar Holdings Co. Ltd. - Key news
- Yanmar Holdings Co. Ltd. - Key offerings
- SWOT
15 Appendix
- 15.1 Scope of the report
- 15.2 Inclusions and exclusions checklist
- Inclusions checklist
- Exclusions checklist
- 15.3 Currency conversion rates for US$
- Currency conversion rates for US$
- 15.4 Research methodology
- Research methodology
- 15.5 Data procurement
- Information sources
- 15.6 Data validation
- Data validation
- 15.7 Validation techniques employed for market sizing
- Validation techniques employed for market sizing
- 15.8 Data synthesis
- Data synthesis
- 15.9 360 degree market analysis
- 360 degree market analysis
- 15.10 List of abbreviations
- List of abbreviations

