|
|
市場調査レポート
商品コード
1762865
メチレンジフェニルジイソシアネート(MDI)の世界市場 2025~2029年Global Methylene Diphenyl Diisocyanate (MDI) Market 2025-2029 |
||||||

|
|||||||
カスタマイズ可能
|
|||||||


| メチレンジフェニルジイソシアネート(MDI)の世界市場 2025~2029年 |
|
出版日: 2025年06月26日
発行: TechNavio
ページ情報: 英文 232 Pages
納期: 即納可能
|

全表示
- 概要
- 図表
- 目次
メチレンジフェニルジイソシアネート(MDI)市場は2024~2029年に71億9,070万米ドル、予測期間中のCAGRは4.8%で成長すると予測されます。
当レポートでは、メチレンジフェニルジイソシアネート(MDI)市場の全体的な分析、市場規模・予測、動向、成長促進要因、課題、約25のベンダーを網羅したベンダー分析などを掲載しています。
現在の市場シナリオ、最新動向と促進要因、市場環境全体に関する最新分析を提供しています。市場は、新興国のmdi需要の拡大、新興市場の建設業界の需要増加、硬質フォームの需要加速が牽引しています。
| 市場範囲 | |
|---|---|
| 基準年 | 2025年 |
| 終了年 | 2029年 |
| 予測期間 | 2025~2029年 |
| 成長モメンタム | 加速 |
| 前年比 | 4.5% |
| CAGR | 4.8% |
| 増分額 | 71億9,070万米ドル |
本調査は、業界の主要参加者からのインプットを含め、一次情報と二次情報を客観的に組み合わせて実施しました。レポートには、主要企業の分析に加え、包括的な市場規模データ、地域別分析によるセグメント、ベンダー情勢が含まれています。レポートには過去データと予測データがあります。
本調査では、今後数年間のメチレンジフェニルジイソシアネート(MDI)市場の成長を促進する主な要因の一つとして、mdiの生産能力拡大への取り組みを挙げています。また、インフラ整備への投資増加や環境に優しい硬質フォームの開発は、市場の大きな需要につながります。
目次
第1章 エグゼクティブサマリー
- 市場概要
第2章 Technavio分析
- 価格・ライフサイクル・顧客購入バスケット・採用率・購入基準の分析
- インプットの重要性と差別化の要因
- 混乱の要因
- 促進要因と課題の影響
第3章 市場情勢
- 市場エコシステム
- 市場の特徴
- バリューチェーン分析
第4章 市場規模
- 市場の定義
- 市場セグメント分析
- 市場規模 2024年
- 市場の見通し 2024~2029年
第5章 市場規模実績
- メチレンジフェニルジイソシアネート(MDI)の世界市場 2019~2023年
- 製品別セグメント分析 2019~2023年
- タイプ別セグメント分析 2019~2023年
- エンドユーザー別セグメント分析 2019~2023年
- 地域別セグメント分析 2019~2023年
- 国別セグメント分析 2019~2023年
第6章 定性分析
- AIの影響:メチレンジフェニルジイソシアネート(MDI)の世界市場
第7章 ファイブフォース分析
- ファイブフォースの要約
- 買い手の交渉力
- 供給企業の交渉力
- 新規参入業者の脅威
- 代替品の脅威
- 競争の脅威
- 市況
第8章 市場セグメンテーション:製品別
- 市場セグメント
- 比較:製品別
- 硬質フォーム:市場規模と予測 2024~2029年
- CASE:市場規模と予測 2024~2029年
- 軟質フォーム:市場規模と予測 2024~2029年
- その他:市場規模と予測 2024~2029年
- 市場機会:製品別
第9章 市場セグメンテーション:タイプ別
- 市場セグメント
- 比較:タイプ別
- ポリマーMDI:市場規模と予測 2024~2029年
- ピュアMDI:市場規模と予測 2024~2029年
- 変性MDI:市場規模と予測 2024~2029年
- 市場機会:タイプ別
第10章 市場セグメンテーション:エンドユーザー別
- 市場セグメント
- 比較:エンドユーザー別
- 工事:市場規模と予測 2024~2029年
- 家具とインテリア:市場規模と予測 2024~2029年
- 電子機器および家電製品:市場規模と予測 2024~2029年
- 自動車:市場規模と予測 2024~2029年
- その他:市場規模と予測 2024~2029年
- 市場機会:エンドユーザー別
第11章 顧客情勢
- 顧客情勢の概要
第12章 地域別情勢
- 地域別セグメンテーション
- 地域別比較
- アジア太平洋:市場規模と予測 2024~2029年
- 欧州:市場規模と予測 2024~2029年
- 北米:市場規模と予測 2024~2029年
- 南米:市場規模と予測 2024~2029年
- 中東・アフリカ:市場規模と予測 2024~2029年
- 中国:市場規模と予測 2024~2029年
- 米国:市場規模と予測 2024~2029年
- ドイツ:市場規模と予測 2024~2029年
- ブラジル:市場規模と予測 2024~2029年
- 日本:市場規模と予測 2024~2029年
- カナダ:市場規模と予測 2024~2029年
- イタリア:市場規模と予測 2024~2029年
- トルコ:市場規模と予測 2024~2029年
- 韓国:市場規模と予測 2024~2029年
- フランス:市場規模と予測 2024~2029年
- 市場機会:地域情勢別
第13章 促進要因・課題・機会・抑制要因
- 市場促進要因
- 市場の課題
- 促進要因と課題の影響
- 市場の機会・抑制要因
第14章 競合情勢
- 概要
- 競合情勢
- 混乱の状況
- 業界のリスク
第15章 競合分析
- 企業プロファイル
- 企業ランキング指数
- 企業の市場ポジショニング
- BASF SE
- Chongqing ChangFeng Chemical Co. Ltd
- Covestro AG
- Dow Chemical Co.
- Everchem Specialty Chemicals
- Hexion Inc.
- Huntsman Corp.
- Isotherm Puf Panel Pvt. Ltd.
- Kumho Petrochemical Co. Ltd.
- Lanxess AG
- Redox Ltd.
- Sadara Chemical Co.
- Shilpa Chemspec International Pvt. Ltd.
- Tosoh Corp.
- Wanhua Chemical Group Co. Ltd.
第16章 付録
Exhibits:
- Exhibits1: Executive Summary - Chart on Market Overview
- Exhibits2: Executive Summary - Data Table on Market Overview
- Exhibits3: Executive Summary - Chart on Global Market Characteristics
- Exhibits4: Executive Summary - Chart on Market By Geographical Landscape
- Exhibits5: Executive Summary - Chart on Market Segmentation by Product
- Exhibits6: Executive Summary - Chart on Market Segmentation by Type
- Exhibits7: Executive Summary - Chart on Market Segmentation by End-user
- Exhibits8: Executive Summary - Chart on Incremental Growth
- Exhibits9: Executive Summary - Data Table on Incremental Growth
- Exhibits10: Executive Summary - Chart on Company Market Positioning
- Exhibits11: Analysis of price sensitivity, lifecycle, customer purchase basket, adoption rates, and purchase criteria
- Exhibits12: Overview on criticality of inputs and factors of differentiation
- Exhibits13: Overview on factors of disruption
- Exhibits14: Impact of drivers and challenges in 2024 and 2029
- Exhibits15: Parent Market
- Exhibits16: Data Table on - Parent Market
- Exhibits17: Market characteristics analysis
- Exhibits18: Value chain analysis
- Exhibits19: Offerings of companies included in the market definition
- Exhibits20: Market segments
- Exhibits21: Chart on Global - Market size and forecast 2024-2029 ($ million)
- Exhibits22: Data Table on Global - Market size and forecast 2024-2029 ($ million)
- Exhibits23: Chart on Global Market: Year-over-year growth 2024-2029 (%)
- Exhibits24: Data Table on Global Market: Year-over-year growth 2024-2029 (%)
- Exhibits25: Historic Market Size - Data Table on Global Methylene Diphenyl Diisocyanate (MDI) Market 2019 - 2023 ($ million)
- Exhibits26: Historic Market Size - Product Segment 2019 - 2023 ($ million)
- Exhibits27: Historic Market Size - Type Segment 2019 - 2023 ($ million)
- Exhibits28: Historic Market Size - End-user Segment 2019 - 2023 ($ million)
- Exhibits29: Historic Market Size - Geography Segment 2019 - 2023 ($ million)
- Exhibits30: Historic Market Size - Country Segment 2019 - 2023 ($ million)
- Exhibits31: Five forces analysis - Comparison between 2024 and 2029
- Exhibits32: Bargaining power of buyers - Impact of key factors 2024 and 2029
- Exhibits33: Bargaining power of suppliers - Impact of key factors in 2024 and 2029
- Exhibits34: Threat of new entrants - Impact of key factors in 2024 and 2029
- Exhibits35: Threat of substitutes - Impact of key factors in 2024 and 2029
- Exhibits36: Threat of rivalry - Impact of key factors in 2024 and 2029
- Exhibits37: Chart on Market condition - Five forces 2024 and 2029
- Exhibits38: Chart on Product - Market share 2024-2029 (%)
- Exhibits39: Data Table on Product - Market share 2024-2029 (%)
- Exhibits40: Chart on Comparison by Product
- Exhibits41: Data Table on Comparison by Product
- Exhibits42: Chart on Rigid foam - Market size and forecast 2024-2029 ($ million)
- Exhibits43: Data Table on Rigid foam - Market size and forecast 2024-2029 ($ million)
- Exhibits44: Chart on Rigid foam - Year-over-year growth 2024-2029 (%)
- Exhibits45: Data Table on Rigid foam - Year-over-year growth 2024-2029 (%)
- Exhibits46: Chart on CASE - Market size and forecast 2024-2029 ($ million)
- Exhibits47: Data Table on CASE - Market size and forecast 2024-2029 ($ million)
- Exhibits48: Chart on CASE - Year-over-year growth 2024-2029 (%)
- Exhibits49: Data Table on CASE - Year-over-year growth 2024-2029 (%)
- Exhibits50: Chart on Flexible foam - Market size and forecast 2024-2029 ($ million)
- Exhibits51: Data Table on Flexible foam - Market size and forecast 2024-2029 ($ million)
- Exhibits52: Chart on Flexible foam - Year-over-year growth 2024-2029 (%)
- Exhibits53: Data Table on Flexible foam - Year-over-year growth 2024-2029 (%)
- Exhibits54: Chart on Others - Market size and forecast 2024-2029 ($ million)
- Exhibits55: Data Table on Others - Market size and forecast 2024-2029 ($ million)
- Exhibits56: Chart on Others - Year-over-year growth 2024-2029 (%)
- Exhibits57: Data Table on Others - Year-over-year growth 2024-2029 (%)
- Exhibits58: Market opportunity by Product ($ million)
- Exhibits59: Data Table on Market opportunity by Product ($ million)
- Exhibits60: Chart on Type - Market share 2024-2029 (%)
- Exhibits61: Data Table on Type - Market share 2024-2029 (%)
- Exhibits62: Chart on Comparison by Type
- Exhibits63: Data Table on Comparison by Type
- Exhibits64: Chart on Polymeric MDI - Market size and forecast 2024-2029 ($ million)
- Exhibits65: Data Table on Polymeric MDI - Market size and forecast 2024-2029 ($ million)
- Exhibits66: Chart on Polymeric MDI - Year-over-year growth 2024-2029 (%)
- Exhibits67: Data Table on Polymeric MDI - Year-over-year growth 2024-2029 (%)
- Exhibits68: Chart on Pure MDI - Market size and forecast 2024-2029 ($ million)
- Exhibits69: Data Table on Pure MDI - Market size and forecast 2024-2029 ($ million)
- Exhibits70: Chart on Pure MDI - Year-over-year growth 2024-2029 (%)
- Exhibits71: Data Table on Pure MDI - Year-over-year growth 2024-2029 (%)
- Exhibits72: Chart on Modified MDI - Market size and forecast 2024-2029 ($ million)
- Exhibits73: Data Table on Modified MDI - Market size and forecast 2024-2029 ($ million)
- Exhibits74: Chart on Modified MDI - Year-over-year growth 2024-2029 (%)
- Exhibits75: Data Table on Modified MDI - Year-over-year growth 2024-2029 (%)
- Exhibits76: Market opportunity by Type ($ million)
- Exhibits77: Data Table on Market opportunity by Type ($ million)
- Exhibits78: Chart on End-user - Market share 2024-2029 (%)
- Exhibits79: Data Table on End-user - Market share 2024-2029 (%)
- Exhibits80: Chart on Comparison by End-user
- Exhibits81: Data Table on Comparison by End-user
- Exhibits82: Chart on Construction - Market size and forecast 2024-2029 ($ million)
- Exhibits83: Data Table on Construction - Market size and forecast 2024-2029 ($ million)
- Exhibits84: Chart on Construction - Year-over-year growth 2024-2029 (%)
- Exhibits85: Data Table on Construction - Year-over-year growth 2024-2029 (%)
- Exhibits86: Chart on Furniture and interiors - Market size and forecast 2024-2029 ($ million)
- Exhibits87: Data Table on Furniture and interiors - Market size and forecast 2024-2029 ($ million)
- Exhibits88: Chart on Furniture and interiors - Year-over-year growth 2024-2029 (%)
- Exhibits89: Data Table on Furniture and interiors - Year-over-year growth 2024-2029 (%)
- Exhibits90: Chart on Electronics and appliances - Market size and forecast 2024-2029 ($ million)
- Exhibits91: Data Table on Electronics and appliances - Market size and forecast 2024-2029 ($ million)
- Exhibits92: Chart on Electronics and appliances - Year-over-year growth 2024-2029 (%)
- Exhibits93: Data Table on Electronics and appliances - Year-over-year growth 2024-2029 (%)
- Exhibits94: Chart on Automotive - Market size and forecast 2024-2029 ($ million)
- Exhibits95: Data Table on Automotive - Market size and forecast 2024-2029 ($ million)
- Exhibits96: Chart on Automotive - Year-over-year growth 2024-2029 (%)
- Exhibits97: Data Table on Automotive - Year-over-year growth 2024-2029 (%)
- Exhibits98: Chart on Others - Market size and forecast 2024-2029 ($ million)
- Exhibits99: Data Table on Others - Market size and forecast 2024-2029 ($ million)
- Exhibits100: Chart on Others - Year-over-year growth 2024-2029 (%)
- Exhibits101: Data Table on Others - Year-over-year growth 2024-2029 (%)
- Exhibits102: Market opportunity by End-user ($ million)
- Exhibits103: Data Table on Market opportunity by End-user ($ million)
- Exhibits104: Analysis of price sensitivity, lifecycle, customer purchase basket, adoption rates, and purchase criteria
- Exhibits105: Chart on Market share By Geographical Landscape 2024-2029 (%)
- Exhibits106: Data Table on Market share By Geographical Landscape 2024-2029 (%)
- Exhibits107: Chart on Geographic comparison
- Exhibits108: Data Table on Geographic comparison
- Exhibits109: Chart on APAC - Market size and forecast 2024-2029 ($ million)
- Exhibits110: Data Table on APAC - Market size and forecast 2024-2029 ($ million)
- Exhibits111: Chart on APAC - Year-over-year growth 2024-2029 (%)
- Exhibits112: Data Table on APAC - Year-over-year growth 2024-2029 (%)
- Exhibits113: Chart on Europe - Market size and forecast 2024-2029 ($ million)
- Exhibits114: Data Table on Europe - Market size and forecast 2024-2029 ($ million)
- Exhibits115: Chart on Europe - Year-over-year growth 2024-2029 (%)
- Exhibits116: Data Table on Europe - Year-over-year growth 2024-2029 (%)
- Exhibits117: Chart on North America - Market size and forecast 2024-2029 ($ million)
- Exhibits118: Data Table on North America - Market size and forecast 2024-2029 ($ million)
- Exhibits119: Chart on North America - Year-over-year growth 2024-2029 (%)
- Exhibits120: Data Table on North America - Year-over-year growth 2024-2029 (%)
- Exhibits121: Chart on South America - Market size and forecast 2024-2029 ($ million)
- Exhibits122: Data Table on South America - Market size and forecast 2024-2029 ($ million)
- Exhibits123: Chart on South America - Year-over-year growth 2024-2029 (%)
- Exhibits124: Data Table on South America - Year-over-year growth 2024-2029 (%)
- Exhibits125: Chart on Middle East and Africa - Market size and forecast 2024-2029 ($ million)
- Exhibits126: Data Table on Middle East and Africa - Market size and forecast 2024-2029 ($ million)
- Exhibits127: Chart on Middle East and Africa - Year-over-year growth 2024-2029 (%)
- Exhibits128: Data Table on Middle East and Africa - Year-over-year growth 2024-2029 (%)
- Exhibits129: Chart on China - Market size and forecast 2024-2029 ($ million)
- Exhibits130: Data Table on China - Market size and forecast 2024-2029 ($ million)
- Exhibits131: Chart on China - Year-over-year growth 2024-2029 (%)
- Exhibits132: Data Table on China - Year-over-year growth 2024-2029 (%)
- Exhibits133: Chart on US - Market size and forecast 2024-2029 ($ million)
- Exhibits134: Data Table on US - Market size and forecast 2024-2029 ($ million)
- Exhibits135: Chart on US - Year-over-year growth 2024-2029 (%)
- Exhibits136: Data Table on US - Year-over-year growth 2024-2029 (%)
- Exhibits137: Chart on Germany - Market size and forecast 2024-2029 ($ million)
- Exhibits138: Data Table on Germany - Market size and forecast 2024-2029 ($ million)
- Exhibits139: Chart on Germany - Year-over-year growth 2024-2029 (%)
- Exhibits140: Data Table on Germany - Year-over-year growth 2024-2029 (%)
- Exhibits141: Chart on Brazil - Market size and forecast 2024-2029 ($ million)
- Exhibits142: Data Table on Brazil - Market size and forecast 2024-2029 ($ million)
- Exhibits143: Chart on Brazil - Year-over-year growth 2024-2029 (%)
- Exhibits144: Data Table on Brazil - Year-over-year growth 2024-2029 (%)
- Exhibits145: Chart on Japan - Market size and forecast 2024-2029 ($ million)
- Exhibits146: Data Table on Japan - Market size and forecast 2024-2029 ($ million)
- Exhibits147: Chart on Japan - Year-over-year growth 2024-2029 (%)
- Exhibits148: Data Table on Japan - Year-over-year growth 2024-2029 (%)
- Exhibits149: Chart on Canada - Market size and forecast 2024-2029 ($ million)
- Exhibits150: Data Table on Canada - Market size and forecast 2024-2029 ($ million)
- Exhibits151: Chart on Canada - Year-over-year growth 2024-2029 (%)
- Exhibits152: Data Table on Canada - Year-over-year growth 2024-2029 (%)
- Exhibits153: Chart on Italy - Market size and forecast 2024-2029 ($ million)
- Exhibits154: Data Table on Italy - Market size and forecast 2024-2029 ($ million)
- Exhibits155: Chart on Italy - Year-over-year growth 2024-2029 (%)
- Exhibits156: Data Table on Italy - Year-over-year growth 2024-2029 (%)
- Exhibits157: Chart on Turkey - Market size and forecast 2024-2029 ($ million)
- Exhibits158: Data Table on Turkey - Market size and forecast 2024-2029 ($ million)
- Exhibits159: Chart on Turkey - Year-over-year growth 2024-2029 (%)
- Exhibits160: Data Table on Turkey - Year-over-year growth 2024-2029 (%)
- Exhibits161: Chart on South Korea - Market size and forecast 2024-2029 ($ million)
- Exhibits162: Data Table on South Korea - Market size and forecast 2024-2029 ($ million)
- Exhibits163: Chart on South Korea - Year-over-year growth 2024-2029 (%)
- Exhibits164: Data Table on South Korea - Year-over-year growth 2024-2029 (%)
- Exhibits165: Chart on France - Market size and forecast 2024-2029 ($ million)
- Exhibits166: Data Table on France - Market size and forecast 2024-2029 ($ million)
- Exhibits167: Chart on France - Year-over-year growth 2024-2029 (%)
- Exhibits168: Data Table on France - Year-over-year growth 2024-2029 (%)
- Exhibits169: Market opportunity By Geographical Landscape ($ million)
- Exhibits170: Data Tables on Market opportunity By Geographical Landscape ($ million)
- Exhibits171: Impact of drivers and challenges in 2024 and 2029
- Exhibits172: Overview on criticality of inputs and factors of differentiation
- Exhibits173: Overview on factors of disruption
- Exhibits174: Impact of key risks on business
- Exhibits175: Companies covered
- Exhibits176: Company ranking index
- Exhibits177: Matrix on companies position and classification
- Exhibits178: BASF SE - Overview
- Exhibits179: BASF SE - Business segments
- Exhibits180: BASF SE - Key news
- Exhibits181: BASF SE - Key offerings
- Exhibits182: BASF SE - Segment focus
- Exhibits183: SWOT
- Exhibits184: Chongqing ChangFeng Chemical Co. Ltd - Overview
- Exhibits185: Chongqing ChangFeng Chemical Co. Ltd - Product / Service
- Exhibits186: Chongqing ChangFeng Chemical Co. Ltd - Key offerings
- Exhibits187: SWOT
- Exhibits188: Covestro AG - Overview
- Exhibits189: Covestro AG - Business segments
- Exhibits190: Covestro AG - Key news
- Exhibits191: Covestro AG - Key offerings
- Exhibits192: Covestro AG - Segment focus
- Exhibits193: SWOT
- Exhibits194: Dow Chemical Co. - Overview
- Exhibits195: Dow Chemical Co. - Business segments
- Exhibits196: Dow Chemical Co. - Key news
- Exhibits197: Dow Chemical Co. - Key offerings
- Exhibits198: Dow Chemical Co. - Segment focus
- Exhibits199: SWOT
- Exhibits200: Everchem Specialty Chemicals - Overview
- Exhibits201: Everchem Specialty Chemicals - Product / Service
- Exhibits202: Everchem Specialty Chemicals - Key offerings
- Exhibits203: SWOT
- Exhibits204: Hexion Inc. - Overview
- Exhibits205: Hexion Inc. - Product / Service
- Exhibits206: Hexion Inc. - Key offerings
- Exhibits207: SWOT
- Exhibits208: Huntsman Corp. - Overview
- Exhibits209: Huntsman Corp. - Business segments
- Exhibits210: Huntsman Corp. - Key news
- Exhibits211: Huntsman Corp. - Key offerings
- Exhibits212: Huntsman Corp. - Segment focus
- Exhibits213: SWOT
- Exhibits214: Isotherm Puf Panel Pvt. Ltd. - Overview
- Exhibits215: Isotherm Puf Panel Pvt. Ltd. - Product / Service
- Exhibits216: Isotherm Puf Panel Pvt. Ltd. - Key offerings
- Exhibits217: SWOT
- Exhibits218: Kumho Petrochemical Co. Ltd. - Overview
- Exhibits219: Kumho Petrochemical Co. Ltd. - Product / Service
- Exhibits220: Kumho Petrochemical Co. Ltd. - Key offerings
- Exhibits221: SWOT
- Exhibits222: Lanxess AG - Overview
- Exhibits223: Lanxess AG - Business segments
- Exhibits224: Lanxess AG - Key news
- Exhibits225: Lanxess AG - Key offerings
- Exhibits226: Lanxess AG - Segment focus
- Exhibits227: SWOT
- Exhibits228: Redox Ltd. - Overview
- Exhibits229: Redox Ltd. - Product / Service
- Exhibits230: Redox Ltd. - Key offerings
- Exhibits231: SWOT
- Exhibits232: Sadara Chemical Co. - Overview
- Exhibits233: Sadara Chemical Co. - Product / Service
- Exhibits234: Sadara Chemical Co. - Key offerings
- Exhibits235: SWOT
- Exhibits236: Shilpa Chemspec International Pvt. Ltd. - Overview
- Exhibits237: Shilpa Chemspec International Pvt. Ltd. - Product / Service
- Exhibits238: Shilpa Chemspec International Pvt. Ltd. - Key offerings
- Exhibits239: SWOT
- Exhibits240: Tosoh Corp. - Overview
- Exhibits241: Tosoh Corp. - Business segments
- Exhibits242: Tosoh Corp. - Key offerings
- Exhibits243: Tosoh Corp. - Segment focus
- Exhibits244: SWOT
- Exhibits245: Wanhua Chemical Group Co. Ltd. - Overview
- Exhibits246: Wanhua Chemical Group Co. Ltd. - Product / Service
- Exhibits247: Wanhua Chemical Group Co. Ltd. - Key offerings
- Exhibits248: SWOT
- Exhibits249: Inclusions checklist
- Exhibits250: Exclusions checklist
- Exhibits251: Currency conversion rates for US$
- Exhibits252: Research methodology
- Exhibits253: Information sources
- Exhibits254: Data validation
- Exhibits255: Validation techniques employed for market sizing
- Exhibits256: Data synthesis
- Exhibits257: 360 degree market analysis
- Exhibits258: List of abbreviations
The methylene diphenyl diisocyanate (MDI) market is forecasted to grow by USD 7,190.7 mn during 2024-2029, accelerating at a CAGR of 4.8% during the forecast period. The report on the methylene diphenyl diisocyanate (MDI) market provides a holistic analysis, market size and forecast, trends, growth drivers, and challenges, as well as vendor analysis covering around 25 vendors.
The report offers an up-to-date analysis regarding the current market scenario, the latest trends and drivers, and the overall market environment. The market is driven by growing demand for mdi from emerging economies, increased demand from construction industry in emerging markets, and accelerating demand for rigid foams.
| Market Scope | |
|---|---|
| Base Year | 2025 |
| End Year | 2029 |
| Series Year | 2025-2029 |
| Growth Momentum | Accelerate |
| YOY 2025 | 4.5% |
| CAGR | 4.8% |
| Incremental Value | $7,190.7 mn |
The study was conducted using an objective combination of primary and secondary information including inputs from key participants in the industry. The report contains a comprehensive market size data, segment with regional analysis and vendor landscape in addition to an analysis of the key companies. Reports have historic and forecast data.
Technavio's methylene diphenyl diisocyanate (MDI) market is segmented as below:
By Product
- Rigid foam
- CASE
- Flexible foam
- Others
By Type
- Polymeric MDI
- Pure MDI
- Modified MDI
By End-user
- Construction
- Furniture and interiors
- Electronics and appliances
- Automotive
- Others
By Geographical Landscape
- APAC
- Europe
- North America
- South America
- Middle East and Africa
This study identifies the initiatives for expansion of mdi production capacity as one of the prime reasons driving the methylene diphenyl diisocyanate (MDI) market growth during the next few years. Also, rising investment in infrastructure development and development of eco-friendly rigid foams will lead to sizable demand in the market.
The report on the methylene diphenyl diisocyanate (MDI) market covers the following areas:
- Methylene Diphenyl Diisocyanate (MDI) Market sizing
- Methylene Diphenyl Diisocyanate (MDI) Market forecast
- Methylene Diphenyl Diisocyanate (MDI) Market industry analysis
The robust vendor analysis is designed to help clients improve their market position, and in line with this, this report provides a detailed analysis of several leading methylene diphenyl diisocyanate (MDI) market vendors that include BASF SE, Changzhou JLON Composite Co. Ltd., Chongqing ChangFeng Chemical Co. Ltd, Covestro AG, Dow Chemical Co., Everchem Specialty Chemicals, Gomati Impex Pvt Ltd, Hexion Inc., Huntsman Corp., Isotherm Puf Panel Pvt. Ltd., Kumho Petrochemical Co. Ltd., Kurmy Corp., Lanxess AG, Redox Ltd., Sadara Chemical Co., Shilpa Chemspec International Pvt. Ltd., Shri Salasar Traders, Tosoh Corp., and Wanhua Chemical Group Co. Ltd.. Also, the methylene diphenyl diisocyanate (MDI) market analysis report includes information on upcoming trends and challenges that will influence market growth. This is to help companies strategize and leverage all forthcoming growth opportunities.
The publisher presents a detailed picture of the market by the way of study, synthesis, and summation of data from multiple sources by an analysis of key parameters such as profit, pricing, competition, and promotions. It presents various market facets by identifying the key industry influencers. The data presented is comprehensive, reliable, and a result of extensive primary and secondary research. The market research reports provide a complete competitive landscape and an in-depth vendor selection methodology and analysis using qualitative and quantitative research to forecast accurate market growth.
Table of Contents
1 Executive Summary
- 1.1 Market overview
- Executive Summary - Chart on Market Overview
- Executive Summary - Data Table on Market Overview
- Executive Summary - Chart on Global Market Characteristics
- Executive Summary - Chart on Market By Geographical Landscape
- Executive Summary - Chart on Market Segmentation by Product
- Executive Summary - Chart on Market Segmentation by Type
- Executive Summary - Chart on Market Segmentation by End-user
- Executive Summary - Chart on Incremental Growth
- Executive Summary - Data Table on Incremental Growth
- Executive Summary - Chart on Company Market Positioning
2 Technavio Analysis
- 2.1 Analysis of price sensitivity, lifecycle, customer purchase basket, adoption rates, and purchase criteria
- Analysis of price sensitivity, lifecycle, customer purchase basket, adoption rates, and purchase criteria
- 2.2 Criticality of inputs and Factors of differentiation
- Overview on criticality of inputs and factors of differentiation
- 2.3 Factors of disruption
- Overview on factors of disruption
- 2.4 Impact of drivers and challenges
- Impact of drivers and challenges in 2024 and 2029
3 Market Landscape
- 3.1 Market ecosystem
- Parent Market
- Data Table on - Parent Market
- 3.2 Market characteristics
- Market characteristics analysis
- 3.3 Value chain analysis
- Value chain analysis
4 Market Sizing
- 4.1 Market definition
- Offerings of companies included in the market definition
- 4.2 Market segment analysis
- Market segments
- 4.3 Market size 2024
- 4.4 Market outlook: Forecast for 2024-2029
- Chart on Global - Market size and forecast 2024-2029 ($ million)
- Data Table on Global - Market size and forecast 2024-2029 ($ million)
- Chart on Global Market: Year-over-year growth 2024-2029 (%)
- Data Table on Global Market: Year-over-year growth 2024-2029 (%)
5 Historic Market Size
- 5.1 Global Methylene Diphenyl Diisocyanate (MDI) Market 2019 - 2023
- Historic Market Size - Data Table on Global Methylene Diphenyl Diisocyanate (MDI) Market 2019 - 2023 ($ million)
- 5.2 Product segment analysis 2019 - 2023
- Historic Market Size - Product Segment 2019 - 2023 ($ million)
- 5.3 Type segment analysis 2019 - 2023
- Historic Market Size - Type Segment 2019 - 2023 ($ million)
- 5.4 End-user segment analysis 2019 - 2023
- Historic Market Size - End-user Segment 2019 - 2023 ($ million)
- 5.5 Geography segment analysis 2019 - 2023
- Historic Market Size - Geography Segment 2019 - 2023 ($ million)
- 5.6 Country segment analysis 2019 - 2023
- Historic Market Size - Country Segment 2019 - 2023 ($ million)
6 Qualitative Analysis
- 6.1 The AI impact on global methylene diphenyl diisocyanate (MDI) market
7 Five Forces Analysis
- 7.1 Five forces summary
- Five forces analysis - Comparison between 2024 and 2029
- 7.2 Bargaining power of buyers
- Bargaining power of buyers - Impact of key factors 2024 and 2029
- 7.3 Bargaining power of suppliers
- Bargaining power of suppliers - Impact of key factors in 2024 and 2029
- 7.4 Threat of new entrants
- Threat of new entrants - Impact of key factors in 2024 and 2029
- 7.5 Threat of substitutes
- Threat of substitutes - Impact of key factors in 2024 and 2029
- 7.6 Threat of rivalry
- Threat of rivalry - Impact of key factors in 2024 and 2029
- 7.7 Market condition
- Chart on Market condition - Five forces 2024 and 2029
8 Market Segmentation by Product
- 8.1 Market segments
- Chart on Product - Market share 2024-2029 (%)
- Data Table on Product - Market share 2024-2029 (%)
- 8.2 Comparison by Product
- Chart on Comparison by Product
- Data Table on Comparison by Product
- 8.3 Rigid foam - Market size and forecast 2024-2029
- Chart on Rigid foam - Market size and forecast 2024-2029 ($ million)
- Data Table on Rigid foam - Market size and forecast 2024-2029 ($ million)
- Chart on Rigid foam - Year-over-year growth 2024-2029 (%)
- Data Table on Rigid foam - Year-over-year growth 2024-2029 (%)
- 8.4 CASE - Market size and forecast 2024-2029
- Chart on CASE - Market size and forecast 2024-2029 ($ million)
- Data Table on CASE - Market size and forecast 2024-2029 ($ million)
- Chart on CASE - Year-over-year growth 2024-2029 (%)
- Data Table on CASE - Year-over-year growth 2024-2029 (%)
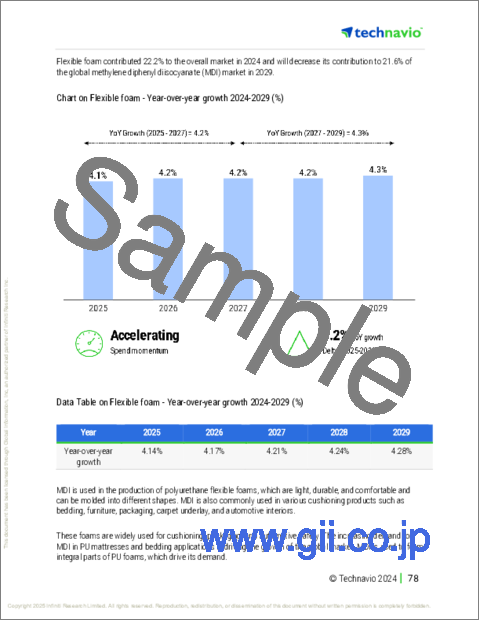
- 8.5 Flexible foam - Market size and forecast 2024-2029
- Chart on Flexible foam - Market size and forecast 2024-2029 ($ million)
- Data Table on Flexible foam - Market size and forecast 2024-2029 ($ million)
- Chart on Flexible foam - Year-over-year growth 2024-2029 (%)
- Data Table on Flexible foam - Year-over-year growth 2024-2029 (%)
- 8.6 Others - Market size and forecast 2024-2029
- Chart on Others - Market size and forecast 2024-2029 ($ million)
- Data Table on Others - Market size and forecast 2024-2029 ($ million)
- Chart on Others - Year-over-year growth 2024-2029 (%)
- Data Table on Others - Year-over-year growth 2024-2029 (%)
- 8.7 Market opportunity by Product
- Market opportunity by Product ($ million)
- Data Table on Market opportunity by Product ($ million)
9 Market Segmentation by Type
- 9.1 Market segments
- Chart on Type - Market share 2024-2029 (%)
- Data Table on Type - Market share 2024-2029 (%)
- 9.2 Comparison by Type
- Chart on Comparison by Type
- Data Table on Comparison by Type
- 9.3 Polymeric MDI - Market size and forecast 2024-2029
- Chart on Polymeric MDI - Market size and forecast 2024-2029 ($ million)
- Data Table on Polymeric MDI - Market size and forecast 2024-2029 ($ million)
- Chart on Polymeric MDI - Year-over-year growth 2024-2029 (%)
- Data Table on Polymeric MDI - Year-over-year growth 2024-2029 (%)
- 9.4 Pure MDI - Market size and forecast 2024-2029
- Chart on Pure MDI - Market size and forecast 2024-2029 ($ million)
- Data Table on Pure MDI - Market size and forecast 2024-2029 ($ million)
- Chart on Pure MDI - Year-over-year growth 2024-2029 (%)
- Data Table on Pure MDI - Year-over-year growth 2024-2029 (%)
- 9.5 Modified MDI - Market size and forecast 2024-2029
- Chart on Modified MDI - Market size and forecast 2024-2029 ($ million)
- Data Table on Modified MDI - Market size and forecast 2024-2029 ($ million)
- Chart on Modified MDI - Year-over-year growth 2024-2029 (%)
- Data Table on Modified MDI - Year-over-year growth 2024-2029 (%)
- 9.6 Market opportunity by Type
- Market opportunity by Type ($ million)
- Data Table on Market opportunity by Type ($ million)
10 Market Segmentation by End-user
- 10.1 Market segments
- Chart on End-user - Market share 2024-2029 (%)
- Data Table on End-user - Market share 2024-2029 (%)
- 10.2 Comparison by End-user
- Chart on Comparison by End-user
- Data Table on Comparison by End-user
- 10.3 Construction - Market size and forecast 2024-2029
- Chart on Construction - Market size and forecast 2024-2029 ($ million)
- Data Table on Construction - Market size and forecast 2024-2029 ($ million)
- Chart on Construction - Year-over-year growth 2024-2029 (%)
- Data Table on Construction - Year-over-year growth 2024-2029 (%)
- 10.4 Furniture and interiors - Market size and forecast 2024-2029
- Chart on Furniture and interiors - Market size and forecast 2024-2029 ($ million)
- Data Table on Furniture and interiors - Market size and forecast 2024-2029 ($ million)
- Chart on Furniture and interiors - Year-over-year growth 2024-2029 (%)
- Data Table on Furniture and interiors - Year-over-year growth 2024-2029 (%)
- 10.5 Electronics and appliances - Market size and forecast 2024-2029
- Chart on Electronics and appliances - Market size and forecast 2024-2029 ($ million)
- Data Table on Electronics and appliances - Market size and forecast 2024-2029 ($ million)
- Chart on Electronics and appliances - Year-over-year growth 2024-2029 (%)
- Data Table on Electronics and appliances - Year-over-year growth 2024-2029 (%)
- 10.6 Automotive - Market size and forecast 2024-2029
- Chart on Automotive - Market size and forecast 2024-2029 ($ million)
- Data Table on Automotive - Market size and forecast 2024-2029 ($ million)
- Chart on Automotive - Year-over-year growth 2024-2029 (%)
- Data Table on Automotive - Year-over-year growth 2024-2029 (%)
- 10.7 Others - Market size and forecast 2024-2029
- Chart on Others - Market size and forecast 2024-2029 ($ million)
- Data Table on Others - Market size and forecast 2024-2029 ($ million)
- Chart on Others - Year-over-year growth 2024-2029 (%)
- Data Table on Others - Year-over-year growth 2024-2029 (%)
- 10.8 Market opportunity by End-user
- Market opportunity by End-user ($ million)
- Data Table on Market opportunity by End-user ($ million)
11 Customer Landscape
- 11.1 Customer landscape overview
- Analysis of price sensitivity, lifecycle, customer purchase basket, adoption rates, and purchase criteria
12 Geographic Landscape
- 12.1 Geographic segmentation
- Chart on Market share By Geographical Landscape 2024-2029 (%)
- Data Table on Market share By Geographical Landscape 2024-2029 (%)
- 12.2 Geographic comparison
- Chart on Geographic comparison
- Data Table on Geographic comparison
- 12.3 APAC - Market size and forecast 2024-2029
- Chart on APAC - Market size and forecast 2024-2029 ($ million)
- Data Table on APAC - Market size and forecast 2024-2029 ($ million)
- Chart on APAC - Year-over-year growth 2024-2029 (%)
- Data Table on APAC - Year-over-year growth 2024-2029 (%)
- 12.4 Europe - Market size and forecast 2024-2029
- Chart on Europe - Market size and forecast 2024-2029 ($ million)
- Data Table on Europe - Market size and forecast 2024-2029 ($ million)
- Chart on Europe - Year-over-year growth 2024-2029 (%)
- Data Table on Europe - Year-over-year growth 2024-2029 (%)
- 12.5 North America - Market size and forecast 2024-2029
- Chart on North America - Market size and forecast 2024-2029 ($ million)
- Data Table on North America - Market size and forecast 2024-2029 ($ million)
- Chart on North America - Year-over-year growth 2024-2029 (%)
- Data Table on North America - Year-over-year growth 2024-2029 (%)
- 12.6 South America - Market size and forecast 2024-2029
- Chart on South America - Market size and forecast 2024-2029 ($ million)
- Data Table on South America - Market size and forecast 2024-2029 ($ million)
- Chart on South America - Year-over-year growth 2024-2029 (%)
- Data Table on South America - Year-over-year growth 2024-2029 (%)
- 12.7 Middle East and Africa - Market size and forecast 2024-2029
- Chart on Middle East and Africa - Market size and forecast 2024-2029 ($ million)
- Data Table on Middle East and Africa - Market size and forecast 2024-2029 ($ million)
- Chart on Middle East and Africa - Year-over-year growth 2024-2029 (%)
- Data Table on Middle East and Africa - Year-over-year growth 2024-2029 (%)
- 12.8 China - Market size and forecast 2024-2029
- Chart on China - Market size and forecast 2024-2029 ($ million)
- Data Table on China - Market size and forecast 2024-2029 ($ million)
- Chart on China - Year-over-year growth 2024-2029 (%)
- Data Table on China - Year-over-year growth 2024-2029 (%)
- 12.9 US - Market size and forecast 2024-2029
- Chart on US - Market size and forecast 2024-2029 ($ million)
- Data Table on US - Market size and forecast 2024-2029 ($ million)
- Chart on US - Year-over-year growth 2024-2029 (%)
- Data Table on US - Year-over-year growth 2024-2029 (%)
- 12.10 Germany - Market size and forecast 2024-2029
- Chart on Germany - Market size and forecast 2024-2029 ($ million)
- Data Table on Germany - Market size and forecast 2024-2029 ($ million)
- Chart on Germany - Year-over-year growth 2024-2029 (%)
- Data Table on Germany - Year-over-year growth 2024-2029 (%)
- 12.11 Brazil - Market size and forecast 2024-2029
- Chart on Brazil - Market size and forecast 2024-2029 ($ million)
- Data Table on Brazil - Market size and forecast 2024-2029 ($ million)
- Chart on Brazil - Year-over-year growth 2024-2029 (%)
- Data Table on Brazil - Year-over-year growth 2024-2029 (%)
- 12.12 Japan - Market size and forecast 2024-2029
- Chart on Japan - Market size and forecast 2024-2029 ($ million)
- Data Table on Japan - Market size and forecast 2024-2029 ($ million)
- Chart on Japan - Year-over-year growth 2024-2029 (%)
- Data Table on Japan - Year-over-year growth 2024-2029 (%)
- 12.13 Canada - Market size and forecast 2024-2029
- Chart on Canada - Market size and forecast 2024-2029 ($ million)
- Data Table on Canada - Market size and forecast 2024-2029 ($ million)
- Chart on Canada - Year-over-year growth 2024-2029 (%)
- Data Table on Canada - Year-over-year growth 2024-2029 (%)
- 12.14 Italy - Market size and forecast 2024-2029
- Chart on Italy - Market size and forecast 2024-2029 ($ million)
- Data Table on Italy - Market size and forecast 2024-2029 ($ million)
- Chart on Italy - Year-over-year growth 2024-2029 (%)
- Data Table on Italy - Year-over-year growth 2024-2029 (%)
- 12.15 Turkey - Market size and forecast 2024-2029
- Chart on Turkey - Market size and forecast 2024-2029 ($ million)
- Data Table on Turkey - Market size and forecast 2024-2029 ($ million)
- Chart on Turkey - Year-over-year growth 2024-2029 (%)
- Data Table on Turkey - Year-over-year growth 2024-2029 (%)
- 12.16 South Korea - Market size and forecast 2024-2029
- Chart on South Korea - Market size and forecast 2024-2029 ($ million)
- Data Table on South Korea - Market size and forecast 2024-2029 ($ million)
- Chart on South Korea - Year-over-year growth 2024-2029 (%)
- Data Table on South Korea - Year-over-year growth 2024-2029 (%)
- 12.17 France - Market size and forecast 2024-2029
- Chart on France - Market size and forecast 2024-2029 ($ million)
- Data Table on France - Market size and forecast 2024-2029 ($ million)
- Chart on France - Year-over-year growth 2024-2029 (%)
- Data Table on France - Year-over-year growth 2024-2029 (%)
- 12.18 Market opportunity By Geographical Landscape
- Market opportunity By Geographical Landscape ($ million)
- Data Tables on Market opportunity By Geographical Landscape ($ million)
13 Drivers, Challenges, and Opportunity/Restraints
- 13.1 Market drivers
- 13.2 Market challenges
- 13.3 Impact of drivers and challenges
- Impact of drivers and challenges in 2024 and 2029
- 13.4 Market opportunities/restraints
14 Competitive Landscape
- 14.1 Overview
- 14.2 Competitive Landscape
- Overview on criticality of inputs and factors of differentiation
- 14.3 Landscape disruption
- Overview on factors of disruption
- 14.4 Industry risks
- Impact of key risks on business
15 Competitive Analysis
- 15.1 Companies profiled
- Companies covered
- 15.2 Company ranking index
- Company ranking index
- 15.3 Market positioning of companies
- Matrix on companies position and classification
- 15.4 BASF SE
- BASF SE - Overview
- BASF SE - Business segments
- BASF SE - Key news
- BASF SE - Key offerings
- BASF SE - Segment focus
- SWOT
- 15.5 Chongqing ChangFeng Chemical Co. Ltd
- Chongqing ChangFeng Chemical Co. Ltd - Overview
- Chongqing ChangFeng Chemical Co. Ltd - Product / Service
- Chongqing ChangFeng Chemical Co. Ltd - Key offerings
- SWOT
- 15.6 Covestro AG
- Covestro AG - Overview
- Covestro AG - Business segments
- Covestro AG - Key news
- Covestro AG - Key offerings
- Covestro AG - Segment focus
- SWOT
- 15.7 Dow Chemical Co.
- Dow Chemical Co. - Overview
- Dow Chemical Co. - Business segments
- Dow Chemical Co. - Key news
- Dow Chemical Co. - Key offerings
- Dow Chemical Co. - Segment focus
- SWOT
- 15.8 Everchem Specialty Chemicals
- Everchem Specialty Chemicals - Overview
- Everchem Specialty Chemicals - Product / Service
- Everchem Specialty Chemicals - Key offerings
- SWOT
- 15.9 Hexion Inc.
- Hexion Inc. - Overview
- Hexion Inc. - Product / Service
- Hexion Inc. - Key offerings
- SWOT
- 15.10 Huntsman Corp.
- Huntsman Corp. - Overview
- Huntsman Corp. - Business segments
- Huntsman Corp. - Key news
- Huntsman Corp. - Key offerings
- Huntsman Corp. - Segment focus
- SWOT
- 15.11 Isotherm Puf Panel Pvt. Ltd.
- Isotherm Puf Panel Pvt. Ltd. - Overview
- Isotherm Puf Panel Pvt. Ltd. - Product / Service
- Isotherm Puf Panel Pvt. Ltd. - Key offerings
- SWOT
- 15.12 Kumho Petrochemical Co. Ltd.
- Kumho Petrochemical Co. Ltd. - Overview
- Kumho Petrochemical Co. Ltd. - Product / Service
- Kumho Petrochemical Co. Ltd. - Key offerings
- SWOT
- 15.13 Lanxess AG
- Lanxess AG - Overview
- Lanxess AG - Business segments
- Lanxess AG - Key news
- Lanxess AG - Key offerings
- Lanxess AG - Segment focus
- SWOT
- 15.14 Redox Ltd.
- Redox Ltd. - Overview
- Redox Ltd. - Product / Service
- Redox Ltd. - Key offerings
- SWOT
- 15.15 Sadara Chemical Co.
- Sadara Chemical Co. - Overview
- Sadara Chemical Co. - Product / Service
- Sadara Chemical Co. - Key offerings
- SWOT
- 15.16 Shilpa Chemspec International Pvt. Ltd.
- Shilpa Chemspec International Pvt. Ltd. - Overview
- Shilpa Chemspec International Pvt. Ltd. - Product / Service
- Shilpa Chemspec International Pvt. Ltd. - Key offerings
- SWOT
- 15.17 Tosoh Corp.
- Tosoh Corp. - Overview
- Tosoh Corp. - Business segments
- Tosoh Corp. - Key offerings
- Tosoh Corp. - Segment focus
- SWOT
- 15.18 Wanhua Chemical Group Co. Ltd.
- Wanhua Chemical Group Co. Ltd. - Overview
- Wanhua Chemical Group Co. Ltd. - Product / Service
- Wanhua Chemical Group Co. Ltd. - Key offerings
- SWOT
16 Appendix
- 16.1 Scope of the report
- 16.2 Inclusions and exclusions checklist
- Inclusions checklist
- Exclusions checklist
- 16.3 Currency conversion rates for US$
- Currency conversion rates for US$
- 16.4 Research methodology
- Research methodology
- 16.5 Data procurement
- Information sources
- 16.6 Data validation
- Data validation
- 16.7 Validation techniques employed for market sizing
- Validation techniques employed for market sizing
- 16.8 Data synthesis
- Data synthesis
- 16.9 360 degree market analysis
- 360 degree market analysis
- 16.10 List of abbreviations
- List of abbreviations

