|
|
市場調査レポート
商品コード
1908284
フライホイール蓄電の世界市場、2026年~2030年Global Flywheel Energy Storage Market 2026-2030 |
||||||

|
|||||||
カスタマイズ可能
|
|||||||

| フライホイール蓄電の世界市場、2026年~2030年 |
|
出版日: 2026年01月14日
発行: TechNavio
ページ情報: 英文 302 Pages
納期: 即納可能
|

概要
世界のフライホイール蓄電市場は、2025年から2030年にかけて2億8,350万米ドルの成長が見込まれ、予測期間中のCAGRは9.9%と予測されています。
本報告書では、世界のフライホイール蓄電市場に関する包括的な分析、市場規模と予測、動向、成長要因、課題に加え、約25社のベンダー分析を提供しています。
本レポートは、現在の市場状況、最新の動向と促進要因、市場環境全般に関する最新の分析を提供します。市場は、グリッド慣性およびマイクログリッドのレジリエンスに対する重要な必要性、超高速電気自動車充電インフラの実現、ハイパースケールデータセンターおよびAIインフラ向け無停電電源の確保によって牽引されています。
本調査は、業界の主要関係者からの情報を含む、一次情報と二次情報の客観的な組み合わせを用いて実施されました。本レポートには、主要企業の分析に加え、包括的な市場規模データ、地域別分析を伴うセグメント、ベンダー情勢が含まれています。レポートには過去データと予測データが掲載されています。
| 市場範囲 | |
|---|---|
| 基準年 | 2026年 |
| 終了年 | 2030年 |
| 予測期間 | 2026年~2030年 |
| 成長モメンタム | 加速 |
| 前年比2026年 | 9.3% |
| CAGR | 9.9% |
| 増分額 | 2億8,350万米ドル |
本調査では、ハイブリッド蓄電アーキテクチャの出現が、今後数年間における世界のフライホイール蓄電市場成長を牽引する主要な要因の一つであると特定しています。また、運動エネルギー回収による重工業の脱炭素化や、EV充電回廊向けの分散型電力増強が、市場において相当な需要を生み出すことになると見込まれます。
目次
第1章 エグゼクティブサマリー
第2章 Technavio分析
- 価格反応性・ライフサイクル・顧客購入バスケット・採用率・購入基準の分析
- インプットの重要性と差別化の要因
- 混乱の要因
- 促進要因と課題の影響
第3章 市場情勢
- 市場エコシステム
- 市場の特徴
- バリューチェーン分析
第4章 市場規模
- 市場の定義
- 市場セグメント分析
- 市場規模、2025年
- 市場の見通し、2025年~2030年
第5章 市場規模実績
- 世界のフライホイール蓄電市場、2020年~2024年
- タイプセグメント分析、2020年~2024年
- 技術セグメント分析、2020年~2024年
- 部品セグメント分析、2020年~2024年
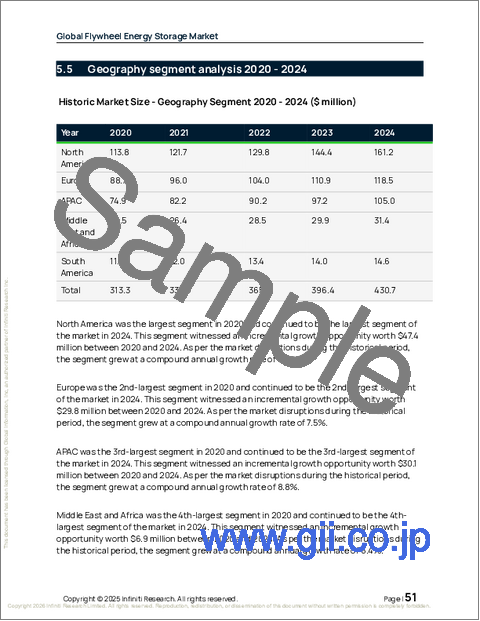
- 地域別セグメント分析、2020年~2024年
- 国別セグメント分析、2020年~2024年
第6章 定性分析
- 世界のフライホイール蓄電市場へのAIの影響
第7章 ファイブフォース分析
- ファイブフォースの要約
- 買い手の交渉力
- 供給企業の交渉力
- 新規参入業者の脅威
- 代替品の脅威
- 競争の脅威
- 市況
第8章 市場セグメンテーション:タイプ別
- 比較:タイプ別
- 複合素材製リム
- スチール製リム
- 市場機会:タイプ別
第9章 市場セグメンテーション:技術別
- 比較:技術別
- UPS
- エネルギーサービス
- 交通機関
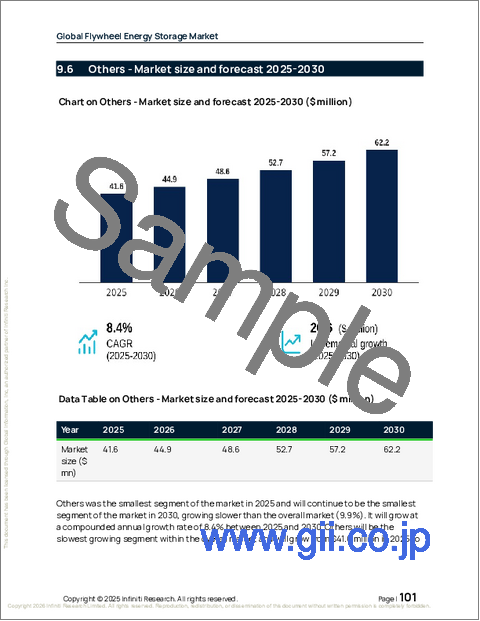
- その他
- 市場機会:技術別
第10章 市場セグメンテーション:コンポーネント別
- 比較:コンポーネント別
- フライホイールローター
- モータージェネレーター
- 磁気軸受
- その他
- 市場機会:コンポーネント別
第11章 顧客情勢
第12章 地域別情勢
- 地域別セグメンテーション
- 地域別比較
- 北米
- 米国
- カナダ
- メキシコ
- 欧州
- ドイツ
- イギリス
- フランス
- イタリア
- スペイン
- オランダ
- アジア太平洋地域
- 中国
- 日本
- インド
- 韓国
- オーストラリア
- インドネシア
- 中東・アフリカ
- 南アフリカ
- UAE
- サウジアラビア
- エジプト
- モロッコ
- 南米
- ブラジル
- アルゼンチン
- チリ
- 市場機会:地域別
第13章 促進要因、課題、機会
- 市場促進要因
- 市場の課題
- 促進要因と課題の影響
- 市場機会
第14章 競合情勢
- 概要
- 競合情勢
- 混乱の状況
- 業界のリスク
第15章 競合分析
- 企業プロファイル
- 企業ランキング指標
- 企業の市場ポジショニング
- ABB Ltd.
- Active Power Solutions Ltd.
- Amber Kinetics Inc.
- Beacon Power LLC
- Calnetix Technologies LLC
- Dumarey Group N.V.
- ENERGIESTRO
- EnerSys
- Hitachi Energy Ltd.
- Kinetic Traction Systems Inc.
- Oxto Ltd.
- Piller Group GmbH
- Revterra
- Schneider Electric SE
- Siemens AG

