|
|
市場調査レポート
商品コード
1557535
クライオボックスの世界市場 2024-2028Global Cryo Box Market 2024-2028 |
||||||

|
|||||||
カスタマイズ可能
|
|||||||

| クライオボックスの世界市場 2024-2028 |
|
出版日: 2024年08月15日
発行: TechNavio
ページ情報: 英文 179 Pages
納期: 即納可能
|

全表示
- 概要
- 図表
- 目次
クライオボックス市場は2023-2028年に1億6,570万米ドル、予測期間中のCAGRは8.08%で成長すると予測されています。
当レポートでは、クライオボックス市場の全体的な分析、市場規模・予測、動向、成長促進要因、課題、約25のベンダーを網羅したベンダー分析などを掲載しています。
現在の市場シナリオ、最新動向と促進要因、市場環境全体に関する最新分析を提供しています。市場は、凍結保存手順の採用の増加、薬剤研究開発におけるクライオボックスの使用の増加、バイオバンクの開発と資金調達の増加によって牽引されています。
| 市場範囲 | |
|---|---|
| 基準年 | 2024 |
| 終了年 | 2028 |
| 予測期間 | 2024-2028 |
| 成長モメンタム | 加速 |
| 前年比2024年 | 7.31% |
| CAGR | 8.08% |
| 増分額 | 1億6,570万米ドル |
本調査では、今後数年間のクライオボックス市場成長を牽引する主な要因の1つとして、ワクチン開発および新規ワクチン市場開拓のための資金増を挙げています。また、幹細胞凍結保存の需要増加、クライオボックスの設計と品質基準の改善への注目の高まりは、市場の大きな需要につながります。
目次
第1章 エグゼクティブサマリー
- 市場概要
第2章 市場情勢
- 市場エコシステム
- 市場の特徴
- バリューチェーン分析
第3章 市場規模の評価
- 市場の定義
- 市場セグメント分析
- 市場規模 2023
- 市場の見通し 2023-2028
第4章 市場規模実績
- クライオボックスの世界市場 2018-2022
- 材料別セグメント分析 2018-2022
- 容量別セグメント分析 2018-2022
- 地域別セグメント分析 2018-2022
- 国別セグメント分析 2018-2022
第5章 ファイブフォース分析
- ファイブフォースの要約
- 買い手の交渉力
- 供給企業の交渉力
- 新規参入業者の脅威
- 代替品の脅威
- 競争の脅威
- 市況
第6章 市場セグメンテーション:材料別
- 市場セグメンテーション
- 比較:材料別
- ポリプロピレン:市場規模と予測 2023-2028
- ポリカーボネート:市場規模と予測 2023-2028
- ラミネート段ボール:市場規模と予測 2023-2028
- 防湿繊維板:市場規模と予測 2023-2028
- 市場機会:材料別
第7章 市場セグメンテーション:容量別
- 市場セグメンテーション
- 比較:容量別
- 0.5ml未満:市場規模と予測 2023-2028
- 1mlまで:市場規模と予測 2023-2028
- 1.7mlまで:市場規模と予測 2023-2028
- 2mlまで:市場規模と予測 2023-2028
- 2ml以上:市場規模と予測 2023-2028
- 市場機会:容量別
第8章 顧客情勢
- 顧客情勢の概要
第9章 地域別情勢
- 地域別セグメンテーション
- 地域別比較
- 北米:市場規模と予測 2023-2028
- 欧州:市場規模と予測 2023-2028
- アジア太平洋:市場規模と予測 2023-2028
- 南米:市場規模と予測 2023-2028
- 中東・アフリカ:市場規模と予測 2023-2028
- 米国:市場規模と予測 2023-2028
- 中国:市場規模と予測 2023-2028
- 英国:市場規模と予測 2023-2028
- インド:市場規模と予測 2023-2028
- 日本:市場規模と予測 2023-2028
- 市場機会:地域情勢別
第10章 促進要因・課題・機会・抑制要因
- 市場促進要因
- 市場の課題
- 促進要因と課題の影響
- 市場の機会・抑制要因
第11章 競合情勢
- 概要
- 競合情勢
- 混乱の状況
- 業界のリスク
第12章 競合分析
- 企業プロファイル
- 企業の市場ポジショニング
- Abdos Labtech Pvt. Ltd.
- AHN Biotechnologie GmbH
- Biologix Group Ltd.
- Corning Inc.
- Eppendorf SE
- GLW Storing Systems GmbH
- Greiner AG
- Heathrow Scientific LLC
- Hospital Equipment Manufacturing Co.
- National Analytical Corp.
- Starlab International GmbH
- TENAK AS
- Thermo Fisher Scientific Inc.
- Wildcat Wholesale LLC
- Wuxi NEST Biotechnology Co. Ltd.
第13章 付録
Exhibits:
- Exhibits1: Executive Summary - Chart on Market Overview
- Exhibits2: Executive Summary - Data Table on Market Overview
- Exhibits3: Executive Summary - Chart on Global Market Characteristics
- Exhibits4: Executive Summary - Chart on Market By Geographical Landscape
- Exhibits5: Executive Summary - Chart on Market Segmentation by Material
- Exhibits6: Executive Summary - Chart on Market Segmentation by Capacity
- Exhibits7: Executive Summary - Chart on Incremental Growth
- Exhibits8: Executive Summary - Data Table on Incremental Growth
- Exhibits9: Executive Summary - Chart on Company Market Positioning
- Exhibits10: Parent Market
- Exhibits11: Data Table on - Parent Market
- Exhibits12: Market characteristics analysis
- Exhibits13: Value Chain Analysis
- Exhibits14: Offerings of companies included in the market definition
- Exhibits15: Market segments
- Exhibits16: Chart on Global - Market size and forecast 2023-2028 ($ million)
- Exhibits17: Data Table on Global - Market size and forecast 2023-2028 ($ million)
- Exhibits18: Chart on Global Market: Year-over-year growth 2023-2028 (%)
- Exhibits19: Data Table on Global Market: Year-over-year growth 2023-2028 (%)
- Exhibits20: Historic Market Size - Data Table on Global Cryo Box Market 2018 - 2022 ($ million)
- Exhibits21: Historic Market Size - Material Segment 2018 - 2022 ($ million)
- Exhibits22: Historic Market Size - Capacity Segment 2018 - 2022 ($ million)
- Exhibits23: Historic Market Size - Geography Segment 2018 - 2022 ($ million)
- Exhibits24: Historic Market Size - Country Segment 2018 - 2022 ($ million)
- Exhibits25: Five forces analysis - Comparison between 2023 and 2028
- Exhibits26: Bargaining power of buyers - Impact of key factors 2023 and 2028
- Exhibits27: Bargaining power of suppliers - Impact of key factors in 2023 and 2028
- Exhibits28: Threat of new entrants - Impact of key factors in 2023 and 2028
- Exhibits29: Threat of substitutes - Impact of key factors in 2023 and 2028
- Exhibits30: Threat of rivalry - Impact of key factors in 2023 and 2028
- Exhibits31: Chart on Market condition - Five forces 2023 and 2028
- Exhibits32: Chart on Material - Market share 2023-2028 (%)
- Exhibits33: Data Table on Material - Market share 2023-2028 (%)
- Exhibits34: Chart on Comparison by Material
- Exhibits35: Data Table on Comparison by Material
- Exhibits36: Chart on Polypropylene - Market size and forecast 2023-2028 ($ million)
- Exhibits37: Data Table on Polypropylene - Market size and forecast 2023-2028 ($ million)
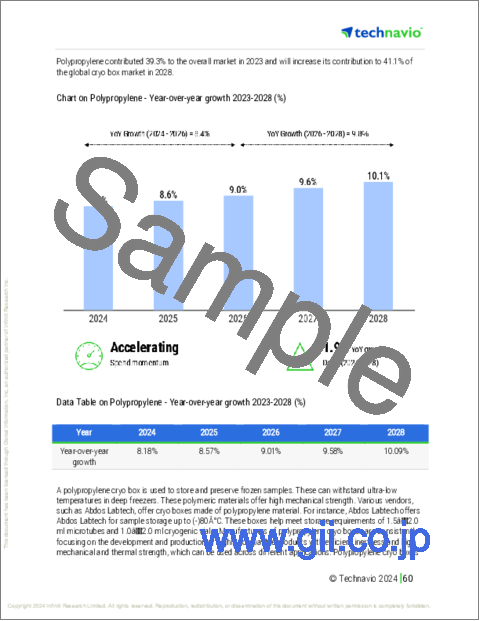
- Exhibits38: Chart on Polypropylene - Year-over-year growth 2023-2028 (%)
- Exhibits39: Data Table on Polypropylene - Year-over-year growth 2023-2028 (%)
- Exhibits40: Chart on Polycarbonate - Market size and forecast 2023-2028 ($ million)
- Exhibits41: Data Table on Polycarbonate - Market size and forecast 2023-2028 ($ million)
- Exhibits42: Chart on Polycarbonate - Year-over-year growth 2023-2028 (%)
- Exhibits43: Data Table on Polycarbonate - Year-over-year growth 2023-2028 (%)
- Exhibits44: Chart on Laminated cardboard - Market size and forecast 2023-2028 ($ million)
- Exhibits45: Data Table on Laminated cardboard - Market size and forecast 2023-2028 ($ million)
- Exhibits46: Chart on Laminated cardboard - Year-over-year growth 2023-2028 (%)
- Exhibits47: Data Table on Laminated cardboard - Year-over-year growth 2023-2028 (%)
- Exhibits48: Chart on Moisture repellent fiberboard - Market size and forecast 2023-2028 ($ million)
- Exhibits49: Data Table on Moisture repellent fiberboard - Market size and forecast 2023-2028 ($ million)
- Exhibits50: Chart on Moisture repellent fiberboard - Year-over-year growth 2023-2028 (%)
- Exhibits51: Data Table on Moisture repellent fiberboard - Year-over-year growth 2023-2028 (%)
- Exhibits52: Market opportunity by Material ($ million)
- Exhibits53: Data Table on Market opportunity by Material ($ million)
- Exhibits54: Chart on Capacity - Market share 2023-2028 (%)
- Exhibits55: Data Table on Capacity - Market share 2023-2028 (%)
- Exhibits56: Chart on Comparison by Capacity
- Exhibits57: Data Table on Comparison by Capacity
- Exhibits58: Chart on Less than 0.5 ml - Market size and forecast 2023-2028 ($ million)
- Exhibits59: Data Table on Less than 0.5 ml - Market size and forecast 2023-2028 ($ million)
- Exhibits60: Chart on Less than 0.5 ml - Year-over-year growth 2023-2028 (%)
- Exhibits61: Data Table on Less than 0.5 ml - Year-over-year growth 2023-2028 (%)
- Exhibits62: Chart on 0.6 to 1 ml - Market size and forecast 2023-2028 ($ million)
- Exhibits63: Data Table on 0.6 to 1 ml - Market size and forecast 2023-2028 ($ million)
- Exhibits64: Chart on 0.6 to 1 ml - Year-over-year growth 2023-2028 (%)
- Exhibits65: Data Table on 0.6 to 1 ml - Year-over-year growth 2023-2028 (%)
- Exhibits66: Chart on 1.1 to 1.7 ml - Market size and forecast 2023-2028 ($ million)
- Exhibits67: Data Table on 1.1 to 1.7 ml - Market size and forecast 2023-2028 ($ million)
- Exhibits68: Chart on 1.1 to 1.7 ml - Year-over-year growth 2023-2028 (%)
- Exhibits69: Data Table on 1.1 to 1.7 ml - Year-over-year growth 2023-2028 (%)
- Exhibits70: Chart on 1.8 to 2 ml - Market size and forecast 2023-2028 ($ million)
- Exhibits71: Data Table on 1.8 to 2 ml - Market size and forecast 2023-2028 ($ million)
- Exhibits72: Chart on 1.8 to 2 ml - Year-over-year growth 2023-2028 (%)
- Exhibits73: Data Table on 1.8 to 2 ml - Year-over-year growth 2023-2028 (%)
- Exhibits74: Chart on More than 2 ml - Market size and forecast 2023-2028 ($ million)
- Exhibits75: Data Table on More than 2 ml - Market size and forecast 2023-2028 ($ million)
- Exhibits76: Chart on More than 2 ml - Year-over-year growth 2023-2028 (%)
- Exhibits77: Data Table on More than 2 ml - Year-over-year growth 2023-2028 (%)
- Exhibits78: Market opportunity by Capacity ($ million)
- Exhibits79: Data Table on Market opportunity by Capacity ($ million)
- Exhibits80: Analysis of price sensitivity, lifecycle, customer purchase basket, adoption rates, and purchase criteria
- Exhibits81: Chart on Market share By Geographical Landscape 2023-2028 (%)
- Exhibits82: Data Table on Market share By Geographical Landscape 2023-2028 (%)
- Exhibits83: Chart on Geographic comparison
- Exhibits84: Data Table on Geographic comparison
- Exhibits85: Chart on North America - Market size and forecast 2023-2028 ($ million)
- Exhibits86: Data Table on North America - Market size and forecast 2023-2028 ($ million)
- Exhibits87: Chart on North America - Year-over-year growth 2023-2028 (%)
- Exhibits88: Data Table on North America - Year-over-year growth 2023-2028 (%)
- Exhibits89: Chart on Europe - Market size and forecast 2023-2028 ($ million)
- Exhibits90: Data Table on Europe - Market size and forecast 2023-2028 ($ million)
- Exhibits91: Chart on Europe - Year-over-year growth 2023-2028 (%)
- Exhibits92: Data Table on Europe - Year-over-year growth 2023-2028 (%)
- Exhibits93: Chart on APAC - Market size and forecast 2023-2028 ($ million)
- Exhibits94: Data Table on APAC - Market size and forecast 2023-2028 ($ million)
- Exhibits95: Chart on APAC - Year-over-year growth 2023-2028 (%)
- Exhibits96: Data Table on APAC - Year-over-year growth 2023-2028 (%)
- Exhibits97: Chart on South America - Market size and forecast 2023-2028 ($ million)
- Exhibits98: Data Table on South America - Market size and forecast 2023-2028 ($ million)
- Exhibits99: Chart on South America - Year-over-year growth 2023-2028 (%)
- Exhibits100: Data Table on South America - Year-over-year growth 2023-2028 (%)
- Exhibits101: Chart on Middle East and Africa - Market size and forecast 2023-2028 ($ million)
- Exhibits102: Data Table on Middle East and Africa - Market size and forecast 2023-2028 ($ million)
- Exhibits103: Chart on Middle East and Africa - Year-over-year growth 2023-2028 (%)
- Exhibits104: Data Table on Middle East and Africa - Year-over-year growth 2023-2028 (%)
- Exhibits105: Chart on US - Market size and forecast 2023-2028 ($ million)
- Exhibits106: Data Table on US - Market size and forecast 2023-2028 ($ million)
- Exhibits107: Chart on US - Year-over-year growth 2023-2028 (%)
- Exhibits108: Data Table on US - Year-over-year growth 2023-2028 (%)
- Exhibits109: Chart on China - Market size and forecast 2023-2028 ($ million)
- Exhibits110: Data Table on China - Market size and forecast 2023-2028 ($ million)
- Exhibits111: Chart on China - Year-over-year growth 2023-2028 (%)
- Exhibits112: Data Table on China - Year-over-year growth 2023-2028 (%)
- Exhibits113: Chart on UK - Market size and forecast 2023-2028 ($ million)
- Exhibits114: Data Table on UK - Market size and forecast 2023-2028 ($ million)
- Exhibits115: Chart on UK - Year-over-year growth 2023-2028 (%)
- Exhibits116: Data Table on UK - Year-over-year growth 2023-2028 (%)
- Exhibits117: Chart on India - Market size and forecast 2023-2028 ($ million)
- Exhibits118: Data Table on India - Market size and forecast 2023-2028 ($ million)
- Exhibits119: Chart on India - Year-over-year growth 2023-2028 (%)
- Exhibits120: Data Table on India - Year-over-year growth 2023-2028 (%)
- Exhibits121: Chart on Japan - Market size and forecast 2023-2028 ($ million)
- Exhibits122: Data Table on Japan - Market size and forecast 2023-2028 ($ million)
- Exhibits123: Chart on Japan - Year-over-year growth 2023-2028 (%)
- Exhibits124: Data Table on Japan - Year-over-year growth 2023-2028 (%)
- Exhibits125: Market opportunity By Geographical Landscape ($ million)
- Exhibits126: Data Tables on Market opportunity By Geographical Landscape ($ million)
- Exhibits127: Impact of drivers and challenges in 2023 and 2028
- Exhibits128: Overview on criticality of inputs and factors of differentiation
- Exhibits129: Overview on factors of disruption
- Exhibits130: Impact of key risks on business
- Exhibits131: Companies covered
- Exhibits132: Matrix on companies position and classification
- Exhibits133: Abdos Labtech Pvt. Ltd. - Overview
- Exhibits134: Abdos Labtech Pvt. Ltd. - Product / Service
- Exhibits135: Abdos Labtech Pvt. Ltd. - Key offerings
- Exhibits136: AHN Biotechnologie GmbH - Overview
- Exhibits137: AHN Biotechnologie GmbH - Product / Service
- Exhibits138: AHN Biotechnologie GmbH - Key offerings
- Exhibits139: Biologix Group Ltd. - Overview
- Exhibits140: Biologix Group Ltd. - Product / Service
- Exhibits141: Biologix Group Ltd. - Key offerings
- Exhibits142: Corning Inc. - Overview
- Exhibits143: Corning Inc. - Business segments
- Exhibits144: Corning Inc. - Key news
- Exhibits145: Corning Inc. - Key offerings
- Exhibits146: Corning Inc. - Segment focus
- Exhibits147: Eppendorf SE - Overview
- Exhibits148: Eppendorf SE - Product / Service
- Exhibits149: Eppendorf SE - Key news
- Exhibits150: Eppendorf SE - Key offerings
- Exhibits151: GLW Storing Systems GmbH - Overview
- Exhibits152: GLW Storing Systems GmbH - Product / Service
- Exhibits153: GLW Storing Systems GmbH - Key offerings
- Exhibits154: Greiner AG - Overview
- Exhibits155: Greiner AG - Product / Service
- Exhibits156: Greiner AG - Key offerings
- Exhibits157: Heathrow Scientific LLC - Overview
- Exhibits158: Heathrow Scientific LLC - Product / Service
- Exhibits159: Heathrow Scientific LLC - Key offerings
- Exhibits160: Hospital Equipment Manufacturing Co. - Overview
- Exhibits161: Hospital Equipment Manufacturing Co. - Product / Service
- Exhibits162: Hospital Equipment Manufacturing Co. - Key offerings
- Exhibits163: National Analytical Corp. - Overview
- Exhibits164: National Analytical Corp. - Product / Service
- Exhibits165: National Analytical Corp. - Key offerings
- Exhibits166: Starlab International GmbH - Overview
- Exhibits167: Starlab International GmbH - Product / Service
- Exhibits168: Starlab International GmbH - Key offerings
- Exhibits169: TENAK AS - Overview
- Exhibits170: TENAK AS - Product / Service
- Exhibits171: TENAK AS - Key offerings
- Exhibits172: Thermo Fisher Scientific Inc. - Overview
- Exhibits173: Thermo Fisher Scientific Inc. - Business segments
- Exhibits174: Thermo Fisher Scientific Inc. - Key news
- Exhibits175: Thermo Fisher Scientific Inc. - Key offerings
- Exhibits176: Thermo Fisher Scientific Inc. - Segment focus
- Exhibits177: Wildcat Wholesale LLC - Overview
- Exhibits178: Wildcat Wholesale LLC - Product / Service
- Exhibits179: Wildcat Wholesale LLC - Key offerings
- Exhibits180: Wuxi NEST Biotechnology Co. Ltd. - Overview
- Exhibits181: Wuxi NEST Biotechnology Co. Ltd. - Product / Service
- Exhibits182: Wuxi NEST Biotechnology Co. Ltd. - Key offerings
- Exhibits183: Inclusions checklist
- Exhibits184: Exclusions checklist
- Exhibits185: Currency conversion rates for US$
- Exhibits186: Research methodology
- Exhibits187: Information sources
- Exhibits188: Data validation
- Exhibits189: Validation techniques employed for market sizing
- Exhibits190: Data synthesis
- Exhibits191: 360 degree market analysis
- Exhibits192: List of abbreviations
The cryo box market is forecasted to grow by USD 165.7 mn during 2023-2028, accelerating at a CAGR of 8.08% during the forecast period. The report on the cryo box market provides a holistic analysis, market size and forecast, trends, growth drivers, and challenges, as well as vendor analysis covering around 25 vendors.
The report offers an up-to-date analysis regarding the current market scenario, the latest trends and drivers, and the overall market environment. The market is driven by increasing adoption of cryopreservation procedures, growing use of cryo boxes in drug research and development, and increasing development and funding for biobanks.
Technavio's cryo box market is segmented as below:
| Market Scope | |
|---|---|
| Base Year | 2024 |
| End Year | 2028 |
| Series Year | 2024-2028 |
| Growth Momentum | Accelerate |
| YOY 2024 | 7.31% |
| CAGR | 8.08% |
| Incremental Value | $165.7 mn |
By Material
- Polypropylene
- Polycarbonate
- Laminated cardboard
- Moisture repellent fiberboard
By Capacity
- Less than 0.5 ml
- 0.6 to 1 ml
- 1.1 to 1.7 ml
- 1.8 to 2 ml
- More than 2 ml
By Geographical Landscape
- North America
- Europe
- APAC
- South America
- Middle East and Africa
This study identifies the increased funding for vaccine development and new vaccine launches as one of the prime reasons driving the cryo box market growth during the next few years. Also, increasing demand for stem cell cryopreservation and growing focus on improving design and quality standards of cryo boxes will lead to sizable demand in the market.
The report on the cryo box market covers the following areas:
- Cryo box market sizing
- Cryo box market forecast
- Cryo box market industry analysis
The robust vendor analysis is designed to help clients improve their market position, and in line with this, this report provides a detailed analysis of several leading cryo box market vendors that include Abdos Labtech Pvt. Ltd., AHN Biotechnologie GmbH, Aritech Chemazone Pvt. Ltd., Biologix Group Ltd., Corning Inc., Crystal Technology and Industries Inc., Eppendorf SE, GENAXY SCIENTIFIC PVT. LTD., GLW Storing Systems GmbH, Greiner AG, Heathrow Scientific LLC, Hospital Equipment Manufacturing Co., JaincoLab, National Analytical Corp., Naugra Export, Starlab International GmbH, TENAK AS, Thermo Fisher Scientific Inc., Wildcat Wholesale LLC, and Wuxi NEST Biotechnology Co. Ltd.. Also, the cryo box market analysis report includes information on upcoming trends and challenges that will influence market growth. This is to help companies strategize and leverage all forthcoming growth opportunities.
The study was conducted using an objective combination of primary and secondary information including inputs from key participants in the industry. The report contains a comprehensive market and vendor landscape in addition to an analysis of the key vendors.
The publisher presents a detailed picture of the market by the way of study, synthesis, and summation of data from multiple sources by an analysis of key parameters such as profit, pricing, competition, and promotions. It presents various market facets by identifying the key industry influencers. The data presented is comprehensive, reliable, and a result of extensive research - both primary and secondary. The market research reports provide a complete competitive landscape and an in-depth vendor selection methodology and analysis using qualitative and quantitative research to forecast the accurate market growth.
Table of Contents
1 Executive Summary
- 1.1 Market overview
- Executive Summary - Chart on Market Overview
- Executive Summary - Data Table on Market Overview
- Executive Summary - Chart on Global Market Characteristics
- Executive Summary - Chart on Market By Geographical Landscape
- Executive Summary - Chart on Market Segmentation by Material
- Executive Summary - Chart on Market Segmentation by Capacity
- Executive Summary - Chart on Incremental Growth
- Executive Summary - Data Table on Incremental Growth
- Executive Summary - Chart on Company Market Positioning
2 Market Landscape
- 2.1 Market ecosystem
- Parent Market
- Data Table on - Parent Market
- 2.2 Market characteristics
- Market characteristics analysis
- 2.3 Value chain analysis
- Value Chain Analysis
3 Market Sizing
- 3.1 Market definition
- Offerings of companies included in the market definition
- 3.2 Market segment analysis
- Market segments
- 3.3 Market size 2023
- 3.4 Market outlook: Forecast for 2023-2028
- Chart on Global - Market size and forecast 2023-2028 ($ million)
- Data Table on Global - Market size and forecast 2023-2028 ($ million)
- Chart on Global Market: Year-over-year growth 2023-2028 (%)
- Data Table on Global Market: Year-over-year growth 2023-2028 (%)
4 Historic Market Size
- 4.1 Global Cryo Box Market 2018 - 2022
- Historic Market Size - Data Table on Global Cryo Box Market 2018 - 2022 ($ million)
- 4.2 Material segment analysis 2018 - 2022
- Historic Market Size - Material Segment 2018 - 2022 ($ million)
- 4.3 Capacity segment analysis 2018 - 2022
- Historic Market Size - Capacity Segment 2018 - 2022 ($ million)
- 4.4 Geography segment analysis 2018 - 2022
- Historic Market Size - Geography Segment 2018 - 2022 ($ million)
- 4.5 Country segment analysis 2018 - 2022
- Historic Market Size - Country Segment 2018 - 2022 ($ million)
5 Five Forces Analysis
- 5.1 Five forces summary
- Five forces analysis - Comparison between 2023 and 2028
- 5.2 Bargaining power of buyers
- Bargaining power of buyers - Impact of key factors 2023 and 2028
- 5.3 Bargaining power of suppliers
- Bargaining power of suppliers - Impact of key factors in 2023 and 2028
- 5.4 Threat of new entrants
- Threat of new entrants - Impact of key factors in 2023 and 2028
- 5.5 Threat of substitutes
- Threat of substitutes - Impact of key factors in 2023 and 2028
- 5.6 Threat of rivalry
- Threat of rivalry - Impact of key factors in 2023 and 2028
- 5.7 Market condition
- Chart on Market condition - Five forces 2023 and 2028
6 Market Segmentation by Material
- 6.1 Market segments
- Chart on Material - Market share 2023-2028 (%)
- Data Table on Material - Market share 2023-2028 (%)
- 6.2 Comparison by Material
- Chart on Comparison by Material
- Data Table on Comparison by Material
- 6.3 Polypropylene - Market size and forecast 2023-2028
- Chart on Polypropylene - Market size and forecast 2023-2028 ($ million)
- Data Table on Polypropylene - Market size and forecast 2023-2028 ($ million)
- Chart on Polypropylene - Year-over-year growth 2023-2028 (%)
- Data Table on Polypropylene - Year-over-year growth 2023-2028 (%)
- 6.4 Polycarbonate - Market size and forecast 2023-2028
- Chart on Polycarbonate - Market size and forecast 2023-2028 ($ million)
- Data Table on Polycarbonate - Market size and forecast 2023-2028 ($ million)
- Chart on Polycarbonate - Year-over-year growth 2023-2028 (%)
- Data Table on Polycarbonate - Year-over-year growth 2023-2028 (%)
- 6.5 Laminated cardboard - Market size and forecast 2023-2028
- Chart on Laminated cardboard - Market size and forecast 2023-2028 ($ million)
- Data Table on Laminated cardboard - Market size and forecast 2023-2028 ($ million)
- Chart on Laminated cardboard - Year-over-year growth 2023-2028 (%)
- Data Table on Laminated cardboard - Year-over-year growth 2023-2028 (%)
- 6.6 Moisture repellent fiberboard - Market size and forecast 2023-2028
- Chart on Moisture repellent fiberboard - Market size and forecast 2023-2028 ($ million)
- Data Table on Moisture repellent fiberboard - Market size and forecast 2023-2028 ($ million)
- Chart on Moisture repellent fiberboard - Year-over-year growth 2023-2028 (%)
- Data Table on Moisture repellent fiberboard - Year-over-year growth 2023-2028 (%)
- 6.7 Market opportunity by Material
- Market opportunity by Material ($ million)
- Data Table on Market opportunity by Material ($ million)
7 Market Segmentation by Capacity
- 7.1 Market segments
- Chart on Capacity - Market share 2023-2028 (%)
- Data Table on Capacity - Market share 2023-2028 (%)
- 7.2 Comparison by Capacity
- Chart on Comparison by Capacity
- Data Table on Comparison by Capacity
- 7.3 Less than 0.5 ml - Market size and forecast 2023-2028
- Chart on Less than 0.5 ml - Market size and forecast 2023-2028 ($ million)
- Data Table on Less than 0.5 ml - Market size and forecast 2023-2028 ($ million)
- Chart on Less than 0.5 ml - Year-over-year growth 2023-2028 (%)
- Data Table on Less than 0.5 ml - Year-over-year growth 2023-2028 (%)
- 0.6 to 1 ml - Market size and forecast 2023-2028
- Chart on 0.6 to 1 ml - Market size and forecast 2023-2028 ($ million)
- Data Table on 0.6 to 1 ml - Market size and forecast 2023-2028 ($ million)
- Chart on 0.6 to 1 ml - Year-over-year growth 2023-2028 (%)
- Data Table on 0.6 to 1 ml - Year-over-year growth 2023-2028 (%)
- 1.1 to 1.7 ml - Market size and forecast 2023-2028
- Chart on 1.1 to 1.7 ml - Market size and forecast 2023-2028 ($ million)
- Data Table on 1.1 to 1.7 ml - Market size and forecast 2023-2028 ($ million)
- Chart on 1.1 to 1.7 ml - Year-over-year growth 2023-2028 (%)
- Data Table on 1.1 to 1.7 ml - Year-over-year growth 2023-2028 (%)
- 1.8 to 2 ml - Market size and forecast 2023-2028
- Chart on 1.8 to 2 ml - Market size and forecast 2023-2028 ($ million)
- Data Table on 1.8 to 2 ml - Market size and forecast 2023-2028 ($ million)
- Chart on 1.8 to 2 ml - Year-over-year growth 2023-2028 (%)
- Data Table on 1.8 to 2 ml - Year-over-year growth 2023-2028 (%)
- 7.7 More than 2 ml - Market size and forecast 2023-2028
- Chart on More than 2 ml - Market size and forecast 2023-2028 ($ million)
- Data Table on More than 2 ml - Market size and forecast 2023-2028 ($ million)
- Chart on More than 2 ml - Year-over-year growth 2023-2028 (%)
- Data Table on More than 2 ml - Year-over-year growth 2023-2028 (%)
- 7.8 Market opportunity by Capacity
- Market opportunity by Capacity ($ million)
- Data Table on Market opportunity by Capacity ($ million)
8 Customer Landscape
- 8.1 Customer landscape overview
- Analysis of price sensitivity, lifecycle, customer purchase basket, adoption rates, and purchase criteria
9 Geographic Landscape
- 9.1 Geographic segmentation
- Chart on Market share By Geographical Landscape 2023-2028 (%)
- Data Table on Market share By Geographical Landscape 2023-2028 (%)
- 9.2 Geographic comparison
- Chart on Geographic comparison
- Data Table on Geographic comparison
- 9.3 North America - Market size and forecast 2023-2028
- Chart on North America - Market size and forecast 2023-2028 ($ million)
- Data Table on North America - Market size and forecast 2023-2028 ($ million)
- Chart on North America - Year-over-year growth 2023-2028 (%)
- Data Table on North America - Year-over-year growth 2023-2028 (%)
- 9.4 Europe - Market size and forecast 2023-2028
- Chart on Europe - Market size and forecast 2023-2028 ($ million)
- Data Table on Europe - Market size and forecast 2023-2028 ($ million)
- Chart on Europe - Year-over-year growth 2023-2028 (%)
- Data Table on Europe - Year-over-year growth 2023-2028 (%)
- 9.5 APAC - Market size and forecast 2023-2028
- Chart on APAC - Market size and forecast 2023-2028 ($ million)
- Data Table on APAC - Market size and forecast 2023-2028 ($ million)
- Chart on APAC - Year-over-year growth 2023-2028 (%)
- Data Table on APAC - Year-over-year growth 2023-2028 (%)
- 9.6 South America - Market size and forecast 2023-2028
- Chart on South America - Market size and forecast 2023-2028 ($ million)
- Data Table on South America - Market size and forecast 2023-2028 ($ million)
- Chart on South America - Year-over-year growth 2023-2028 (%)
- Data Table on South America - Year-over-year growth 2023-2028 (%)
- 9.7 Middle East and Africa - Market size and forecast 2023-2028
- Chart on Middle East and Africa - Market size and forecast 2023-2028 ($ million)
- Data Table on Middle East and Africa - Market size and forecast 2023-2028 ($ million)
- Chart on Middle East and Africa - Year-over-year growth 2023-2028 (%)
- Data Table on Middle East and Africa - Year-over-year growth 2023-2028 (%)
- 9.8 US - Market size and forecast 2023-2028
- Chart on US - Market size and forecast 2023-2028 ($ million)
- Data Table on US - Market size and forecast 2023-2028 ($ million)
- Chart on US - Year-over-year growth 2023-2028 (%)
- Data Table on US - Year-over-year growth 2023-2028 (%)
- 9.9 China - Market size and forecast 2023-2028
- Chart on China - Market size and forecast 2023-2028 ($ million)
- Data Table on China - Market size and forecast 2023-2028 ($ million)
- Chart on China - Year-over-year growth 2023-2028 (%)
- Data Table on China - Year-over-year growth 2023-2028 (%)
- 9.10 UK - Market size and forecast 2023-2028
- Chart on UK - Market size and forecast 2023-2028 ($ million)
- Data Table on UK - Market size and forecast 2023-2028 ($ million)
- Chart on UK - Year-over-year growth 2023-2028 (%)
- Data Table on UK - Year-over-year growth 2023-2028 (%)
- 9.11 India - Market size and forecast 2023-2028
- Chart on India - Market size and forecast 2023-2028 ($ million)
- Data Table on India - Market size and forecast 2023-2028 ($ million)
- Chart on India - Year-over-year growth 2023-2028 (%)
- Data Table on India - Year-over-year growth 2023-2028 (%)
- 9.12 Japan - Market size and forecast 2023-2028
- Chart on Japan - Market size and forecast 2023-2028 ($ million)
- Data Table on Japan - Market size and forecast 2023-2028 ($ million)
- Chart on Japan - Year-over-year growth 2023-2028 (%)
- Data Table on Japan - Year-over-year growth 2023-2028 (%)
- 9.13 Market opportunity By Geographical Landscape
- Market opportunity By Geographical Landscape ($ million)
- Data Tables on Market opportunity By Geographical Landscape ($ million)
10 Drivers, Challenges, and Opportunity/Restraints
- 10.1 Market drivers
- 10.2 Market challenges
- 10.3 Impact of drivers and challenges
- Impact of drivers and challenges in 2023 and 2028
- 10.4 Market opportunities/restraints
11 Competitive Landscape
- 11.1 Overview
- 11.2 Competitive Landscape
- Overview on criticality of inputs and factors of differentiation
- 11.3 Landscape disruption
- Overview on factors of disruption
- 11.4 Industry risks
- Impact of key risks on business
12 Competitive Analysis
- 12.1 Companies profiled
- Companies covered
- 12.2 Market positioning of companies
- Matrix on companies position and classification
- 12.3 Abdos Labtech Pvt. Ltd.
- Abdos Labtech Pvt. Ltd. - Overview
- Abdos Labtech Pvt. Ltd. - Product / Service
- Abdos Labtech Pvt. Ltd. - Key offerings
- 12.4 AHN Biotechnologie GmbH
- AHN Biotechnologie GmbH - Overview
- AHN Biotechnologie GmbH - Product / Service
- AHN Biotechnologie GmbH - Key offerings
- 12.5 Biologix Group Ltd.
- Biologix Group Ltd. - Overview
- Biologix Group Ltd. - Product / Service
- Biologix Group Ltd. - Key offerings
- 12.6 Corning Inc.
- Corning Inc. - Overview
- Corning Inc. - Business segments
- Corning Inc. - Key news
- Corning Inc. - Key offerings
- Corning Inc. - Segment focus
- 12.7 Eppendorf SE
- Eppendorf SE - Overview
- Eppendorf SE - Product / Service
- Eppendorf SE - Key news
- Eppendorf SE - Key offerings
- 12.8 GLW Storing Systems GmbH
- GLW Storing Systems GmbH - Overview
- GLW Storing Systems GmbH - Product / Service
- GLW Storing Systems GmbH - Key offerings
- 12.9 Greiner AG
- Greiner AG - Overview
- Greiner AG - Product / Service
- Greiner AG - Key offerings
- 12.10 Heathrow Scientific LLC
- Heathrow Scientific LLC - Overview
- Heathrow Scientific LLC - Product / Service
- Heathrow Scientific LLC - Key offerings
- 12.11 Hospital Equipment Manufacturing Co.
- Hospital Equipment Manufacturing Co. - Overview
- Hospital Equipment Manufacturing Co. - Product / Service
- Hospital Equipment Manufacturing Co. - Key offerings
- 12.12 National Analytical Corp.
- National Analytical Corp. - Overview
- National Analytical Corp. - Product / Service
- National Analytical Corp. - Key offerings
- 12.13 Starlab International GmbH
- Starlab International GmbH - Overview
- Starlab International GmbH - Product / Service
- Starlab International GmbH - Key offerings
- 12.14 TENAK AS
- TENAK AS - Overview
- TENAK AS - Product / Service
- TENAK AS - Key offerings
- 12.15 Thermo Fisher Scientific Inc.
- Thermo Fisher Scientific Inc. - Overview
- Thermo Fisher Scientific Inc. - Business segments
- Thermo Fisher Scientific Inc. - Key news
- Thermo Fisher Scientific Inc. - Key offerings
- Thermo Fisher Scientific Inc. - Segment focus
- 12.16 Wildcat Wholesale LLC
- Wildcat Wholesale LLC - Overview
- Wildcat Wholesale LLC - Product / Service
- Wildcat Wholesale LLC - Key offerings
- 12.17 Wuxi NEST Biotechnology Co. Ltd.
- Wuxi NEST Biotechnology Co. Ltd. - Overview
- Wuxi NEST Biotechnology Co. Ltd. - Product / Service
- Wuxi NEST Biotechnology Co. Ltd. - Key offerings
13 Appendix
- 13.1 Scope of the report
- 13.2 Inclusions and exclusions checklist
- Inclusions checklist
- Exclusions checklist
- 13.3 Currency conversion rates for US$
- Currency conversion rates for US$
- 13.4 Research methodology
- Research methodology
- 13.5 Data procurement
- Information sources
- 13.6 Data validation
- Data validation
- 13.7 Validation techniques employed for market sizing
- Validation techniques employed for market sizing
- 13.8 Data synthesis
- Data synthesis
- 13.9 360 degree market analysis
- 360 degree market analysis
- 13.10 List of abbreviations
- List of abbreviations

