|
|
市場調査レポート
商品コード
1685021
ニトロセルロースの世界市場 2025-2029Global Nitrocellulose Market 2025-2029 |
||||||

|
|||||||
カスタマイズ可能
|
|||||||

| ニトロセルロースの世界市場 2025-2029 |
|
出版日: 2025年03月12日
発行: TechNavio
ページ情報: 英文 225 Pages
納期: 即納可能
|

全表示
- 概要
- 図表
- 目次
ニトロセルロース市場は2024年から2029年に5億5,620万米ドル成長し、予測期間中のCAGRは8.5%で成長すると予測されます。
当レポートでは、ニトロセルロース市場の全体的な分析、市場規模・予測、動向、成長促進要因、課題、約25のベンダーを網羅したベンダー分析などを掲載しています。
現在の市場シナリオ、最新動向と促進要因、市場環境全体に関する最新分析を提供しています。ニトロセルロース市場は、セルロースの豊富な入手可能性とニトロセルロースの簡単な製造工程、木製家具産業の成長、新興国におけるニトロセルロースの需要増加が牽引しています。
| 市場範囲 | |
|---|---|
| 基準年 | 2025年 |
| 終了年 | 2029年 |
| 予測期間 | 2025年~2029年 |
| 成長モメンタム | 加速 |
| 前年比2025年 | 7.7% |
| CAGR | 8.5% |
| 増分額 | 5億5,620万米ドル |
本調査は、業界の主要参加者からのインプットを含め、一次情報と二次情報を客観的に組み合わせて実施しました。レポートには、主要企業の分析に加え、包括的な市場規模データ、地域分析によるセグメント、ベンダー情勢が含まれています。レポートには実績データと予測データがあります。
本調査では、今後数年間のニトロセルロース市場の成長を促進する主な要因の1つとして、推進剤としてのニトロセルロースの使用増加を挙げています。また、天然木塗装技術の人気の高まりや、将来の塗装プロセスとして電気塗装の人気が高まっていることも、市場の大きな需要につながると考えられています。
目次
第1章 エグゼクティブサマリー
- 市場概要
第2章 Technavio分析
- 価格感応性・ライフサイクル・顧客購入バスケット・採用率・購入基準の分析
- インプットの重要性と差別化の要因
- 混乱の要因
- 促進要因と課題の影響
第3章 市場情勢
- 市場エコシステム
- 市場の特徴
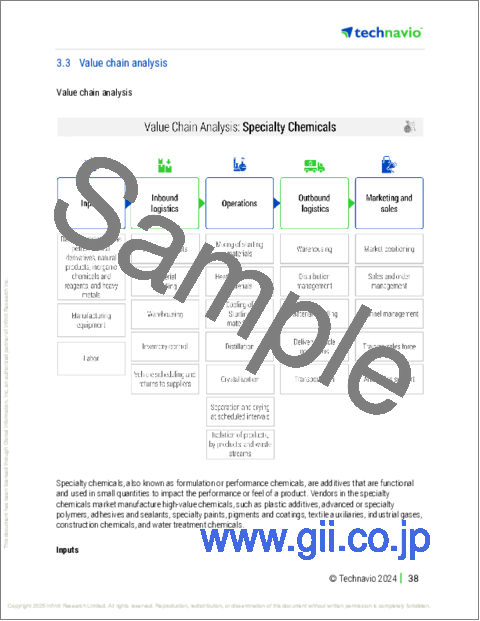
- バリューチェーン分析
第4章 市場規模
- 市場の定義
- 市場セグメント分析
- 市場規模、2024年
- 市場の見通し、2024年~2029年
第5章 市場規模実績
- ニトロセルロースの世界市場、2019年~2023年
- 用途セグメント分析、2019年~2023年
- グレードタイプセグメント分析、2019年~2023年
- タイプセグメント分析、2019年~2023年
- 地域別セグメント分析、2019年~2023年
- 国別セグメント分析、2019年~2023年
第6章 定性分析
- AIの影響:ニトロセルロースの世界市場
第7章 ファイブフォース分析
- ファイブフォースの要約
- 買い手の交渉力
- 供給企業の交渉力
- 新規参入業者の脅威
- 代替品の脅威
- 競争の脅威
- 市況
第8章 市場セグメンテーション:用途別
- 市場セグメント
- 比較:用途別
- 印刷インク:市場規模と予測、2024年~2029年
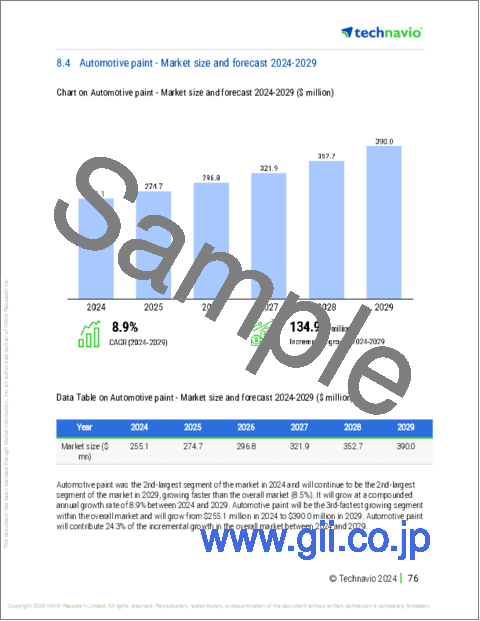
- 自動車用塗料:市場規模と予測、2024年~2029年
- 木材コーティング:市場規模と予測、2024年~2029年
- レザー仕上げ:市場規模と予測、2024年~2029年
- その他:市場規模と予測、2024年~2029年
- 市場機会:用途別
第9章 市場セグメンテーション:グレードタイプ別
- 市場セグメント
- 比較:グレードタイプ別
- Eグレード:市場規模と予測、2024年~2029年
- Aグレード:市場規模と予測、2024年~2029年
- Mグレード:市場規模と予測、2024年~2029年
- 市場機会:グレードタイプ別
第10章 市場セグメンテーション:タイプ別
- 市場セグメント
- 比較:タイプ別
- 可溶性:市場規模と予測、2024年~2029年
- 不溶性:市場規模と予測、2024年~2029年
- 市場機会:タイプ別
第11章 顧客情勢
- 顧客情勢の概要
第12章 地域別情勢
- 地域別セグメンテーション
- 地域別比較
- アジア太平洋:市場規模と予測、2024年~2029年
- 欧州:市場規模と予測、2024年~2029年
- 北米:市場規模と予測、2024年~2029年
- 中東・アフリカ:市場規模と予測、2024年~2029年
- 南米:市場規模と予測、2024年~2029年
- 米国:市場規模と予測、2024年~2029年
- 中国:市場規模と予測、2024年~2029年
- 日本:市場規模と予測、2024年~2029年
- ドイツ:市場規模と予測、2024年~2029年
- インド:市場規模と予測、2024年~2029年
- 英国:市場規模と予測、2024年~2029年
- 韓国:市場規模と予測、2024年~2029年
- カナダ:市場規模と予測、2024年~2029年
- フランス:市場規模と予測、2024年~2029年
- イタリア:市場規模と予測、2024年~2029年
- 市場機会:地域情勢別
第13章 促進要因、課題、機会/抑制要因
- 市場促進要因
- 市場の課題
- 促進要因と課題の影響
- 市場の機会/抑制要因
第14章 競合情勢
- 概要
- 競合情勢
- 混乱の状況
- 業界のリスク
第15章 競合分析
- 企業プロファイル
- 企業ランキング指数
- 企業の市場ポジショニング
- AGROFERT AS
- Asahi Kasei Corp.
- Eastman Chemical Co.
- Eurenco
- GRN Cellulose Pvt. Ltd.
- Hagedorn NC GmbH
- Hubei Xuefei Chemical Co. Ltd.
- International Flavors and Fragrances Inc.
- IVM Srl
- MaxamCorp Holding S.L.
- Nitrex Chemicals India Ltd.
- Nitro Chemical Industry Ltd.
- Nitroparis S.L.
- Rheinmetall AG
- TNC Industrial Co. Ltd.
第16章 付録
Exhibits:
- Exhibits1: Executive Summary - Chart on Market Overview
- Exhibits2: Executive Summary - Data Table on Market Overview
- Exhibits3: Executive Summary - Chart on Global Market Characteristics
- Exhibits4: Executive Summary - Chart on Market By Geographical Landscape
- Exhibits5: Executive Summary - Chart on Market Segmentation by Application
- Exhibits6: Executive Summary - Chart on Market Segmentation by Grade Type
- Exhibits7: Executive Summary - Chart on Market Segmentation by Type
- Exhibits8: Executive Summary - Chart on Incremental Growth
- Exhibits9: Executive Summary - Data Table on Incremental Growth
- Exhibits10: Executive Summary - Chart on Company Market Positioning
- Exhibits11: Analysis of price sensitivity, lifecycle, customer purchase basket, adoption rates, and purchase criteria
- Exhibits12: Overview on criticality of inputs and factors of differentiation
- Exhibits13: Overview on factors of disruption
- Exhibits14: Impact of drivers and challenges in 2024 and 2029
- Exhibits15: Parent Market
- Exhibits16: Data Table on - Parent Market
- Exhibits17: Market characteristics analysis
- Exhibits18: Value chain analysis
- Exhibits19: Offerings of companies included in the market definition
- Exhibits20: Market segments
- Exhibits21: Chart on Global - Market size and forecast 2024-2029 ($ million)
- Exhibits22: Data Table on Global - Market size and forecast 2024-2029 ($ million)
- Exhibits23: Chart on Global Market: Year-over-year growth 2024-2029 (%)
- Exhibits24: Data Table on Global Market: Year-over-year growth 2024-2029 (%)
- Exhibits25: Historic Market Size - Data Table on Global Nitrocellulose Market 2019 - 2023 ($ million)
- Exhibits26: Historic Market Size - Application Segment 2019 - 2023 ($ million)
- Exhibits27: Historic Market Size - Grade Type Segment 2019 - 2023 ($ million)
- Exhibits28: Historic Market Size - Type Segment 2019 - 2023 ($ million)
- Exhibits29: Historic Market Size - Geography Segment 2019 - 2023 ($ million)
- Exhibits30: Historic Market Size - Country Segment 2019 - 2023 ($ million)
- Exhibits31: Five forces analysis - Comparison between 2024 and 2029
- Exhibits32: Bargaining power of buyers - Impact of key factors 2024 and 2029
- Exhibits33: Bargaining power of suppliers - Impact of key factors in 2024 and 2029
- Exhibits34: Threat of new entrants - Impact of key factors in 2024 and 2029
- Exhibits35: Threat of substitutes - Impact of key factors in 2024 and 2029
- Exhibits36: Threat of rivalry - Impact of key factors in 2024 and 2029
- Exhibits37: Chart on Market condition - Five forces 2024 and 2029
- Exhibits38: Chart on Application - Market share 2024-2029 (%)
- Exhibits39: Data Table on Application - Market share 2024-2029 (%)
- Exhibits40: Chart on Comparison by Application
- Exhibits41: Data Table on Comparison by Application
- Exhibits42: Chart on Printing ink - Market size and forecast 2024-2029 ($ million)
- Exhibits43: Data Table on Printing ink - Market size and forecast 2024-2029 ($ million)
- Exhibits44: Chart on Printing ink - Year-over-year growth 2024-2029 (%)
- Exhibits45: Data Table on Printing ink - Year-over-year growth 2024-2029 (%)
- Exhibits46: Chart on Automotive paint - Market size and forecast 2024-2029 ($ million)
- Exhibits47: Data Table on Automotive paint - Market size and forecast 2024-2029 ($ million)
- Exhibits48: Chart on Automotive paint - Year-over-year growth 2024-2029 (%)
- Exhibits49: Data Table on Automotive paint - Year-over-year growth 2024-2029 (%)
- Exhibits50: Chart on Wood coating - Market size and forecast 2024-2029 ($ million)
- Exhibits51: Data Table on Wood coating - Market size and forecast 2024-2029 ($ million)
- Exhibits52: Chart on Wood coating - Year-over-year growth 2024-2029 (%)
- Exhibits53: Data Table on Wood coating - Year-over-year growth 2024-2029 (%)
- Exhibits54: Chart on Leather finishes - Market size and forecast 2024-2029 ($ million)
- Exhibits55: Data Table on Leather finishes - Market size and forecast 2024-2029 ($ million)
- Exhibits56: Chart on Leather finishes - Year-over-year growth 2024-2029 (%)
- Exhibits57: Data Table on Leather finishes - Year-over-year growth 2024-2029 (%)
- Exhibits58: Chart on Others - Market size and forecast 2024-2029 ($ million)
- Exhibits59: Data Table on Others - Market size and forecast 2024-2029 ($ million)
- Exhibits60: Chart on Others - Year-over-year growth 2024-2029 (%)
- Exhibits61: Data Table on Others - Year-over-year growth 2024-2029 (%)
- Exhibits62: Market opportunity by Application ($ million)
- Exhibits63: Data Table on Market opportunity by Application ($ million)
- Exhibits64: Chart on Grade Type - Market share 2024-2029 (%)
- Exhibits65: Data Table on Grade Type - Market share 2024-2029 (%)
- Exhibits66: Chart on Comparison by Grade Type
- Exhibits67: Data Table on Comparison by Grade Type
- Exhibits68: Chart on E grade - Market size and forecast 2024-2029 ($ million)
- Exhibits69: Data Table on E grade - Market size and forecast 2024-2029 ($ million)
- Exhibits70: Chart on E grade - Year-over-year growth 2024-2029 (%)
- Exhibits71: Data Table on E grade - Year-over-year growth 2024-2029 (%)
- Exhibits72: Chart on A grade - Market size and forecast 2024-2029 ($ million)
- Exhibits73: Data Table on A grade - Market size and forecast 2024-2029 ($ million)
- Exhibits74: Chart on A grade - Year-over-year growth 2024-2029 (%)
- Exhibits75: Data Table on A grade - Year-over-year growth 2024-2029 (%)
- Exhibits76: Chart on M grade - Market size and forecast 2024-2029 ($ million)
- Exhibits77: Data Table on M grade - Market size and forecast 2024-2029 ($ million)
- Exhibits78: Chart on M grade - Year-over-year growth 2024-2029 (%)
- Exhibits79: Data Table on M grade - Year-over-year growth 2024-2029 (%)
- Exhibits80: Market opportunity by Grade Type ($ million)
- Exhibits81: Data Table on Market opportunity by Grade Type ($ million)
- Exhibits82: Chart on Type - Market share 2024-2029 (%)
- Exhibits83: Data Table on Type - Market share 2024-2029 (%)
- Exhibits84: Chart on Comparison by Type
- Exhibits85: Data Table on Comparison by Type
- Exhibits86: Chart on Soluble - Market size and forecast 2024-2029 ($ million)
- Exhibits87: Data Table on Soluble - Market size and forecast 2024-2029 ($ million)
- Exhibits88: Chart on Soluble - Year-over-year growth 2024-2029 (%)
- Exhibits89: Data Table on Soluble - Year-over-year growth 2024-2029 (%)
- Exhibits90: Chart on Insoluble - Market size and forecast 2024-2029 ($ million)
- Exhibits91: Data Table on Insoluble - Market size and forecast 2024-2029 ($ million)
- Exhibits92: Chart on Insoluble - Year-over-year growth 2024-2029 (%)
- Exhibits93: Data Table on Insoluble - Year-over-year growth 2024-2029 (%)
- Exhibits94: Market opportunity by Type ($ million)
- Exhibits95: Data Table on Market opportunity by Type ($ million)
- Exhibits96: Analysis of price sensitivity, lifecycle, customer purchase basket, adoption rates, and purchase criteria
- Exhibits97: Chart on Market share By Geographical Landscape 2024-2029 (%)
- Exhibits98: Data Table on Market share By Geographical Landscape 2024-2029 (%)
- Exhibits99: Chart on Geographic comparison
- Exhibits100: Data Table on Geographic comparison
- Exhibits101: Chart on APAC - Market size and forecast 2024-2029 ($ million)
- Exhibits102: Data Table on APAC - Market size and forecast 2024-2029 ($ million)
- Exhibits103: Chart on APAC - Year-over-year growth 2024-2029 (%)
- Exhibits104: Data Table on APAC - Year-over-year growth 2024-2029 (%)
- Exhibits105: Chart on Europe - Market size and forecast 2024-2029 ($ million)
- Exhibits106: Data Table on Europe - Market size and forecast 2024-2029 ($ million)
- Exhibits107: Chart on Europe - Year-over-year growth 2024-2029 (%)
- Exhibits108: Data Table on Europe - Year-over-year growth 2024-2029 (%)
- Exhibits109: Chart on North America - Market size and forecast 2024-2029 ($ million)
- Exhibits110: Data Table on North America - Market size and forecast 2024-2029 ($ million)
- Exhibits111: Chart on North America - Year-over-year growth 2024-2029 (%)
- Exhibits112: Data Table on North America - Year-over-year growth 2024-2029 (%)
- Exhibits113: Chart on Middle East and Africa - Market size and forecast 2024-2029 ($ million)
- Exhibits114: Data Table on Middle East and Africa - Market size and forecast 2024-2029 ($ million)
- Exhibits115: Chart on Middle East and Africa - Year-over-year growth 2024-2029 (%)
- Exhibits116: Data Table on Middle East and Africa - Year-over-year growth 2024-2029 (%)
- Exhibits117: Chart on South America - Market size and forecast 2024-2029 ($ million)
- Exhibits118: Data Table on South America - Market size and forecast 2024-2029 ($ million)
- Exhibits119: Chart on South America - Year-over-year growth 2024-2029 (%)
- Exhibits120: Data Table on South America - Year-over-year growth 2024-2029 (%)
- Exhibits121: Chart on US - Market size and forecast 2024-2029 ($ million)
- Exhibits122: Data Table on US - Market size and forecast 2024-2029 ($ million)
- Exhibits123: Chart on US - Year-over-year growth 2024-2029 (%)
- Exhibits124: Data Table on US - Year-over-year growth 2024-2029 (%)
- Exhibits125: Chart on China - Market size and forecast 2024-2029 ($ million)
- Exhibits126: Data Table on China - Market size and forecast 2024-2029 ($ million)
- Exhibits127: Chart on China - Year-over-year growth 2024-2029 (%)
- Exhibits128: Data Table on China - Year-over-year growth 2024-2029 (%)
- Exhibits129: Chart on Japan - Market size and forecast 2024-2029 ($ million)
- Exhibits130: Data Table on Japan - Market size and forecast 2024-2029 ($ million)
- Exhibits131: Chart on Japan - Year-over-year growth 2024-2029 (%)
- Exhibits132: Data Table on Japan - Year-over-year growth 2024-2029 (%)
- Exhibits133: Chart on Germany - Market size and forecast 2024-2029 ($ million)
- Exhibits134: Data Table on Germany - Market size and forecast 2024-2029 ($ million)
- Exhibits135: Chart on Germany - Year-over-year growth 2024-2029 (%)
- Exhibits136: Data Table on Germany - Year-over-year growth 2024-2029 (%)
- Exhibits137: Chart on India - Market size and forecast 2024-2029 ($ million)
- Exhibits138: Data Table on India - Market size and forecast 2024-2029 ($ million)
- Exhibits139: Chart on India - Year-over-year growth 2024-2029 (%)
- Exhibits140: Data Table on India - Year-over-year growth 2024-2029 (%)
- Exhibits141: Chart on UK - Market size and forecast 2024-2029 ($ million)
- Exhibits142: Data Table on UK - Market size and forecast 2024-2029 ($ million)
- Exhibits143: Chart on UK - Year-over-year growth 2024-2029 (%)
- Exhibits144: Data Table on UK - Year-over-year growth 2024-2029 (%)
- Exhibits145: Chart on South Korea - Market size and forecast 2024-2029 ($ million)
- Exhibits146: Data Table on South Korea - Market size and forecast 2024-2029 ($ million)
- Exhibits147: Chart on South Korea - Year-over-year growth 2024-2029 (%)
- Exhibits148: Data Table on South Korea - Year-over-year growth 2024-2029 (%)
- Exhibits149: Chart on Canada - Market size and forecast 2024-2029 ($ million)
- Exhibits150: Data Table on Canada - Market size and forecast 2024-2029 ($ million)
- Exhibits151: Chart on Canada - Year-over-year growth 2024-2029 (%)
- Exhibits152: Data Table on Canada - Year-over-year growth 2024-2029 (%)
- Exhibits153: Chart on France - Market size and forecast 2024-2029 ($ million)
- Exhibits154: Data Table on France - Market size and forecast 2024-2029 ($ million)
- Exhibits155: Chart on France - Year-over-year growth 2024-2029 (%)
- Exhibits156: Data Table on France - Year-over-year growth 2024-2029 (%)
- Exhibits157: Chart on Italy - Market size and forecast 2024-2029 ($ million)
- Exhibits158: Data Table on Italy - Market size and forecast 2024-2029 ($ million)
- Exhibits159: Chart on Italy - Year-over-year growth 2024-2029 (%)
- Exhibits160: Data Table on Italy - Year-over-year growth 2024-2029 (%)
- Exhibits161: Market opportunity By Geographical Landscape ($ million)
- Exhibits162: Data Tables on Market opportunity By Geographical Landscape ($ million)
- Exhibits163: Impact of drivers and challenges in 2024 and 2029
- Exhibits164: Overview on criticality of inputs and factors of differentiation
- Exhibits165: Overview on factors of disruption
- Exhibits166: Impact of key risks on business
- Exhibits167: Companies covered
- Exhibits168: Company ranking index
- Exhibits169: Matrix on companies position and classification
- Exhibits170: AGROFERT AS - Overview
- Exhibits171: AGROFERT AS - Product / Service
- Exhibits172: AGROFERT AS - Key offerings
- Exhibits173: SWOT
- Exhibits174: Asahi Kasei Corp. - Overview
- Exhibits175: Asahi Kasei Corp. - Business segments
- Exhibits176: Asahi Kasei Corp. - Key news
- Exhibits177: Asahi Kasei Corp. - Key offerings
- Exhibits178: Asahi Kasei Corp. - Segment focus
- Exhibits179: SWOT
- Exhibits180: Eastman Chemical Co. - Overview
- Exhibits181: Eastman Chemical Co. - Business segments
- Exhibits182: Eastman Chemical Co. - Key news
- Exhibits183: Eastman Chemical Co. - Key offerings
- Exhibits184: Eastman Chemical Co. - Segment focus
- Exhibits185: SWOT
- Exhibits186: Eurenco - Overview
- Exhibits187: Eurenco - Product / Service
- Exhibits188: Eurenco - Key offerings
- Exhibits189: SWOT
- Exhibits190: GRN Cellulose Pvt. Ltd. - Overview
- Exhibits191: GRN Cellulose Pvt. Ltd. - Product / Service
- Exhibits192: GRN Cellulose Pvt. Ltd. - Key offerings
- Exhibits193: SWOT
- Exhibits194: Hagedorn NC GmbH - Overview
- Exhibits195: Hagedorn NC GmbH - Product / Service
- Exhibits196: Hagedorn NC GmbH - Key offerings
- Exhibits197: SWOT
- Exhibits198: Hubei Xuefei Chemical Co. Ltd. - Overview
- Exhibits199: Hubei Xuefei Chemical Co. Ltd. - Product / Service
- Exhibits200: Hubei Xuefei Chemical Co. Ltd. - Key offerings
- Exhibits201: SWOT
- Exhibits202: International Flavors and Fragrances Inc. - Overview
- Exhibits203: International Flavors and Fragrances Inc. - Business segments
- Exhibits204: International Flavors and Fragrances Inc. - Key news
- Exhibits205: International Flavors and Fragrances Inc. - Key offerings
- Exhibits206: International Flavors and Fragrances Inc. - Segment focus
- Exhibits207: SWOT
- Exhibits208: IVM Srl - Overview
- Exhibits209: IVM Srl - Product / Service
- Exhibits210: IVM Srl - Key offerings
- Exhibits211: SWOT
- Exhibits212: MaxamCorp Holding S.L. - Overview
- Exhibits213: MaxamCorp Holding S.L. - Product / Service
- Exhibits214: MaxamCorp Holding S.L. - Key offerings
- Exhibits215: SWOT
- Exhibits216: Nitrex Chemicals India Ltd. - Overview
- Exhibits217: Nitrex Chemicals India Ltd. - Product / Service
- Exhibits218: Nitrex Chemicals India Ltd. - Key offerings
- Exhibits219: SWOT
- Exhibits220: Nitro Chemical Industry Ltd. - Overview
- Exhibits221: Nitro Chemical Industry Ltd. - Product / Service
- Exhibits222: Nitro Chemical Industry Ltd. - Key offerings
- Exhibits223: SWOT
- Exhibits224: Nitroparis S.L. - Overview
- Exhibits225: Nitroparis S.L. - Product / Service
- Exhibits226: Nitroparis S.L. - Key offerings
- Exhibits227: SWOT
- Exhibits228: Rheinmetall AG - Overview
- Exhibits229: Rheinmetall AG - Business segments
- Exhibits230: Rheinmetall AG - Key news
- Exhibits231: Rheinmetall AG - Key offerings
- Exhibits232: Rheinmetall AG - Segment focus
- Exhibits233: SWOT
- Exhibits234: TNC Industrial Co. Ltd. - Overview
- Exhibits235: TNC Industrial Co. Ltd. - Product / Service
- Exhibits236: TNC Industrial Co. Ltd. - Key offerings
- Exhibits237: SWOT
- Exhibits238: Inclusions checklist
- Exhibits239: Exclusions checklist
- Exhibits240: Currency conversion rates for US$
- Exhibits241: Research methodology
- Exhibits242: Information sources
- Exhibits243: Data validation
- Exhibits244: Validation techniques employed for market sizing
- Exhibits245: Data synthesis
- Exhibits246: 360 degree market analysis
- Exhibits247: List of abbreviations
The nitrocellulose market is forecasted to grow by USD 556.2 million during 2024-2029, accelerating at a CAGR of 8.5% during the forecast period. The report on the nitrocellulose market provides a holistic analysis, market size and forecast, trends, growth drivers, and challenges, as well as vendor analysis covering around 25 vendors.
The report offers an up-to-date analysis regarding the current market scenario, the latest trends and drivers, and the overall market environment. The market is driven by abundant availability of cellulose and simple manufacturing process for nitrocellulose, growth of wooden furniture industry, and increasing demand for nitrocellulose in emerging economies.
| Market Scope | |
|---|---|
| Base Year | 2025 |
| End Year | 2029 |
| Series Year | 2025-2029 |
| Growth Momentum | Accelerate |
| YOY 2025 | 7.7% |
| CAGR | 8.5% |
| Incremental Value | $556.2 mn |
The study was conducted using an objective combination of primary and secondary information including inputs from key participants in the industry. The report contains a comprehensive market size data, segment with regional analysis and vendor landscape in addition to an analysis of the key companies. Reports have historic and forecast data.
Technavio's nitrocellulose market is segmented as below:
By Application
- Printing ink
- Automotive paint
- Wood coating
- Leather finishes
- Others
By Grade Type
- E grade
- A grade
- M grade
By Type
- Soluble
- Insoluble
By Geographical Landscape
- APAC
- Europe
- North America
- Middle East and Africa
- South America
This study identifies the increasing use of nitrocellulose as propellants as one of the prime reasons driving the nitrocellulose market growth during the next few years. Also, growing popularity of natural wood coating technology and electropainting gaining traction as future coating process will lead to sizable demand in the market.
The report on the nitrocellulose market covers the following areas:
- Nitrocellulose Market sizing
- Nitrocellulose Market forecast
- Nitrocellulose Market industry analysis
The robust vendor analysis is designed to help clients improve their market position, and in line with this, this report provides a detailed analysis of several leading nitrocellulose market vendors that include AGROFERT AS, Asahi Kasei Corp., Celanese Corp., Eastman Chemical Co., Eurenco, GRN Cellulose Pvt. Ltd., Hagedorn NC GmbH, Hubei Xuefei Chemical Co. Ltd., International Flavors and Fragrances Inc., IVM Srl, KOREA CNC Ltd., Kumho Petrochemical Co. Ltd., MaxamCorp Holding S.L., Merck KGaA, Nitrex Chemicals India Ltd., Nitro, Nitro Chemical Industry Ltd., Nitroparis S.L., Rheinmetall AG, and TNC Industrial Co. Ltd.. Also, the nitrocellulose market analysis report includes information on upcoming trends and challenges that will influence market growth. This is to help companies strategize and leverage all forthcoming growth opportunities.
The publisher presents a detailed picture of the market by the way of study, synthesis, and summation of data from multiple sources by an analysis of key parameters such as profit, pricing, competition, and promotions. It presents various market facets by identifying the key industry influencers. The data presented is comprehensive, reliable, and a result of extensive primary and secondary research. The market research reports provide a complete competitive landscape and an in-depth vendor selection methodology and analysis using qualitative and quantitative research to forecast accurate market growth.
Table of Contents
1 Executive Summary
- 1.1 Market overview
- Executive Summary - Chart on Market Overview
- Executive Summary - Data Table on Market Overview
- Executive Summary - Chart on Global Market Characteristics
- Executive Summary - Chart on Market By Geographical Landscape
- Executive Summary - Chart on Market Segmentation by Application
- Executive Summary - Chart on Market Segmentation by Grade Type
- Executive Summary - Chart on Market Segmentation by Type
- Executive Summary - Chart on Incremental Growth
- Executive Summary - Data Table on Incremental Growth
- Executive Summary - Chart on Company Market Positioning
2 Technavio Analysis
- 2.1 Analysis of price sensitivity, lifecycle, customer purchase basket, adoption rates, and purchase criteria
- Analysis of price sensitivity, lifecycle, customer purchase basket, adoption rates, and purchase criteria
- 2.2 Criticality of inputs and Factors of differentiation
- Overview on criticality of inputs and factors of differentiation
- 2.3 Factors of disruption
- Overview on factors of disruption
- 2.4 Impact of drivers and challenges
- Impact of drivers and challenges in 2024 and 2029
3 Market Landscape
- 3.1 Market ecosystem
- Parent Market
- Data Table on - Parent Market
- 3.2 Market characteristics
- Market characteristics analysis
- 3.3 Value chain analysis
- Value chain analysis
4 Market Sizing
- 4.1 Market definition
- Offerings of companies included in the market definition
- 4.2 Market segment analysis
- Market segments
- 4.3 Market size 2024
- 4.4 Market outlook: Forecast for 2024-2029
- Chart on Global - Market size and forecast 2024-2029 ($ million)
- Data Table on Global - Market size and forecast 2024-2029 ($ million)
- Chart on Global Market: Year-over-year growth 2024-2029 (%)
- Data Table on Global Market: Year-over-year growth 2024-2029 (%)
5 Historic Market Size
- 5.1 Global Nitrocellulose Market 2019 - 2023
- Historic Market Size - Data Table on Global Nitrocellulose Market 2019 - 2023 ($ million)
- 5.2 Application segment analysis 2019 - 2023
- Historic Market Size - Application Segment 2019 - 2023 ($ million)
- 5.3 Grade Type segment analysis 2019 - 2023
- Historic Market Size - Grade Type Segment 2019 - 2023 ($ million)
- 5.4 Type segment analysis 2019 - 2023
- Historic Market Size - Type Segment 2019 - 2023 ($ million)
- 5.5 Geography segment analysis 2019 - 2023
- Historic Market Size - Geography Segment 2019 - 2023 ($ million)
- 5.6 Country segment analysis 2019 - 2023
- Historic Market Size - Country Segment 2019 - 2023 ($ million)
6 Qualitative Analysis
- 6.1 Impact of AI on the Global Nitrocellulose Market
7 Five Forces Analysis
- 7.1 Five forces summary
- Five forces analysis - Comparison between 2024 and 2029
- 7.2 Bargaining power of buyers
- Bargaining power of buyers - Impact of key factors 2024 and 2029
- 7.3 Bargaining power of suppliers
- Bargaining power of suppliers - Impact of key factors in 2024 and 2029
- 7.4 Threat of new entrants
- Threat of new entrants - Impact of key factors in 2024 and 2029
- 7.5 Threat of substitutes
- Threat of substitutes - Impact of key factors in 2024 and 2029
- 7.6 Threat of rivalry
- Threat of rivalry - Impact of key factors in 2024 and 2029
- 7.7 Market condition
- Chart on Market condition - Five forces 2024 and 2029
8 Market Segmentation by Application
- 8.1 Market segments
- Chart on Application - Market share 2024-2029 (%)
- Data Table on Application - Market share 2024-2029 (%)
- 8.2 Comparison by Application
- Chart on Comparison by Application
- Data Table on Comparison by Application
- 8.3 Printing ink - Market size and forecast 2024-2029
- Chart on Printing ink - Market size and forecast 2024-2029 ($ million)
- Data Table on Printing ink - Market size and forecast 2024-2029 ($ million)
- Chart on Printing ink - Year-over-year growth 2024-2029 (%)
- Data Table on Printing ink - Year-over-year growth 2024-2029 (%)
- 8.4 Automotive paint - Market size and forecast 2024-2029
- Chart on Automotive paint - Market size and forecast 2024-2029 ($ million)
- Data Table on Automotive paint - Market size and forecast 2024-2029 ($ million)
- Chart on Automotive paint - Year-over-year growth 2024-2029 (%)
- Data Table on Automotive paint - Year-over-year growth 2024-2029 (%)
- 8.5 Wood coating - Market size and forecast 2024-2029
- Chart on Wood coating - Market size and forecast 2024-2029 ($ million)
- Data Table on Wood coating - Market size and forecast 2024-2029 ($ million)
- Chart on Wood coating - Year-over-year growth 2024-2029 (%)
- Data Table on Wood coating - Year-over-year growth 2024-2029 (%)
- 8.6 Leather finishes - Market size and forecast 2024-2029
- Chart on Leather finishes - Market size and forecast 2024-2029 ($ million)
- Data Table on Leather finishes - Market size and forecast 2024-2029 ($ million)
- Chart on Leather finishes - Year-over-year growth 2024-2029 (%)
- Data Table on Leather finishes - Year-over-year growth 2024-2029 (%)
- 8.7 Others - Market size and forecast 2024-2029
- Chart on Others - Market size and forecast 2024-2029 ($ million)
- Data Table on Others - Market size and forecast 2024-2029 ($ million)
- Chart on Others - Year-over-year growth 2024-2029 (%)
- Data Table on Others - Year-over-year growth 2024-2029 (%)
- 8.8 Market opportunity by Application
- Market opportunity by Application ($ million)
- Data Table on Market opportunity by Application ($ million)
9 Market Segmentation by Grade Type
- 9.1 Market segments
- Chart on Grade Type - Market share 2024-2029 (%)
- Data Table on Grade Type - Market share 2024-2029 (%)
- 9.2 Comparison by Grade Type
- Chart on Comparison by Grade Type
- Data Table on Comparison by Grade Type
- 9.3 E grade - Market size and forecast 2024-2029
- Chart on E grade - Market size and forecast 2024-2029 ($ million)
- Data Table on E grade - Market size and forecast 2024-2029 ($ million)
- Chart on E grade - Year-over-year growth 2024-2029 (%)
- Data Table on E grade - Year-over-year growth 2024-2029 (%)
- 9.4 A grade - Market size and forecast 2024-2029
- Chart on A grade - Market size and forecast 2024-2029 ($ million)
- Data Table on A grade - Market size and forecast 2024-2029 ($ million)
- Chart on A grade - Year-over-year growth 2024-2029 (%)
- Data Table on A grade - Year-over-year growth 2024-2029 (%)
- 9.5 M grade - Market size and forecast 2024-2029
- Chart on M grade - Market size and forecast 2024-2029 ($ million)
- Data Table on M grade - Market size and forecast 2024-2029 ($ million)
- Chart on M grade - Year-over-year growth 2024-2029 (%)
- Data Table on M grade - Year-over-year growth 2024-2029 (%)
- 9.6 Market opportunity by Grade Type
- Market opportunity by Grade Type ($ million)
- Data Table on Market opportunity by Grade Type ($ million)
10 Market Segmentation by Type
- 10.1 Market segments
- Chart on Type - Market share 2024-2029 (%)
- Data Table on Type - Market share 2024-2029 (%)
- 10.2 Comparison by Type
- Chart on Comparison by Type
- Data Table on Comparison by Type
- 10.3 Soluble - Market size and forecast 2024-2029
- Chart on Soluble - Market size and forecast 2024-2029 ($ million)
- Data Table on Soluble - Market size and forecast 2024-2029 ($ million)
- Chart on Soluble - Year-over-year growth 2024-2029 (%)
- Data Table on Soluble - Year-over-year growth 2024-2029 (%)
- 10.4 Insoluble - Market size and forecast 2024-2029
- Chart on Insoluble - Market size and forecast 2024-2029 ($ million)
- Data Table on Insoluble - Market size and forecast 2024-2029 ($ million)
- Chart on Insoluble - Year-over-year growth 2024-2029 (%)
- Data Table on Insoluble - Year-over-year growth 2024-2029 (%)
- 10.5 Market opportunity by Type
- Market opportunity by Type ($ million)
- Data Table on Market opportunity by Type ($ million)
11 Customer Landscape
- 11.1 Customer landscape overview
- Analysis of price sensitivity, lifecycle, customer purchase basket, adoption rates, and purchase criteria
12 Geographic Landscape
- 12.1 Geographic segmentation
- Chart on Market share By Geographical Landscape 2024-2029 (%)
- Data Table on Market share By Geographical Landscape 2024-2029 (%)
- 12.2 Geographic comparison
- Chart on Geographic comparison
- Data Table on Geographic comparison
- 12.3 APAC - Market size and forecast 2024-2029
- Chart on APAC - Market size and forecast 2024-2029 ($ million)
- Data Table on APAC - Market size and forecast 2024-2029 ($ million)
- Chart on APAC - Year-over-year growth 2024-2029 (%)
- Data Table on APAC - Year-over-year growth 2024-2029 (%)
- 12.4 Europe - Market size and forecast 2024-2029
- Chart on Europe - Market size and forecast 2024-2029 ($ million)
- Data Table on Europe - Market size and forecast 2024-2029 ($ million)
- Chart on Europe - Year-over-year growth 2024-2029 (%)
- Data Table on Europe - Year-over-year growth 2024-2029 (%)
- 12.5 North America - Market size and forecast 2024-2029
- Chart on North America - Market size and forecast 2024-2029 ($ million)
- Data Table on North America - Market size and forecast 2024-2029 ($ million)
- Chart on North America - Year-over-year growth 2024-2029 (%)
- Data Table on North America - Year-over-year growth 2024-2029 (%)
- 12.6 Middle East and Africa - Market size and forecast 2024-2029
- Chart on Middle East and Africa - Market size and forecast 2024-2029 ($ million)
- Data Table on Middle East and Africa - Market size and forecast 2024-2029 ($ million)
- Chart on Middle East and Africa - Year-over-year growth 2024-2029 (%)
- Data Table on Middle East and Africa - Year-over-year growth 2024-2029 (%)
- 12.7 South America - Market size and forecast 2024-2029
- Chart on South America - Market size and forecast 2024-2029 ($ million)
- Data Table on South America - Market size and forecast 2024-2029 ($ million)
- Chart on South America - Year-over-year growth 2024-2029 (%)
- Data Table on South America - Year-over-year growth 2024-2029 (%)
- 12.8 US - Market size and forecast 2024-2029
- Chart on US - Market size and forecast 2024-2029 ($ million)
- Data Table on US - Market size and forecast 2024-2029 ($ million)
- Chart on US - Year-over-year growth 2024-2029 (%)
- Data Table on US - Year-over-year growth 2024-2029 (%)
- 12.9 China - Market size and forecast 2024-2029
- Chart on China - Market size and forecast 2024-2029 ($ million)
- Data Table on China - Market size and forecast 2024-2029 ($ million)
- Chart on China - Year-over-year growth 2024-2029 (%)
- Data Table on China - Year-over-year growth 2024-2029 (%)
- 12.10 Japan - Market size and forecast 2024-2029
- Chart on Japan - Market size and forecast 2024-2029 ($ million)
- Data Table on Japan - Market size and forecast 2024-2029 ($ million)
- Chart on Japan - Year-over-year growth 2024-2029 (%)
- Data Table on Japan - Year-over-year growth 2024-2029 (%)
- 12.11 Germany - Market size and forecast 2024-2029
- Chart on Germany - Market size and forecast 2024-2029 ($ million)
- Data Table on Germany - Market size and forecast 2024-2029 ($ million)
- Chart on Germany - Year-over-year growth 2024-2029 (%)
- Data Table on Germany - Year-over-year growth 2024-2029 (%)
- 12.12 India - Market size and forecast 2024-2029
- Chart on India - Market size and forecast 2024-2029 ($ million)
- Data Table on India - Market size and forecast 2024-2029 ($ million)
- Chart on India - Year-over-year growth 2024-2029 (%)
- Data Table on India - Year-over-year growth 2024-2029 (%)
- 12.13 UK - Market size and forecast 2024-2029
- Chart on UK - Market size and forecast 2024-2029 ($ million)
- Data Table on UK - Market size and forecast 2024-2029 ($ million)
- Chart on UK - Year-over-year growth 2024-2029 (%)
- Data Table on UK - Year-over-year growth 2024-2029 (%)
- 12.14 South Korea - Market size and forecast 2024-2029
- Chart on South Korea - Market size and forecast 2024-2029 ($ million)
- Data Table on South Korea - Market size and forecast 2024-2029 ($ million)
- Chart on South Korea - Year-over-year growth 2024-2029 (%)
- Data Table on South Korea - Year-over-year growth 2024-2029 (%)
- 12.15 Canada - Market size and forecast 2024-2029
- Chart on Canada - Market size and forecast 2024-2029 ($ million)
- Data Table on Canada - Market size and forecast 2024-2029 ($ million)
- Chart on Canada - Year-over-year growth 2024-2029 (%)
- Data Table on Canada - Year-over-year growth 2024-2029 (%)
- 12.16 France - Market size and forecast 2024-2029
- Chart on France - Market size and forecast 2024-2029 ($ million)
- Data Table on France - Market size and forecast 2024-2029 ($ million)
- Chart on France - Year-over-year growth 2024-2029 (%)
- Data Table on France - Year-over-year growth 2024-2029 (%)
- 12.17 Italy - Market size and forecast 2024-2029
- Chart on Italy - Market size and forecast 2024-2029 ($ million)
- Data Table on Italy - Market size and forecast 2024-2029 ($ million)
- Chart on Italy - Year-over-year growth 2024-2029 (%)
- Data Table on Italy - Year-over-year growth 2024-2029 (%)
- 12.18 Market opportunity By Geographical Landscape
- Market opportunity By Geographical Landscape ($ million)
- Data Tables on Market opportunity By Geographical Landscape ($ million)
13 Drivers, Challenges, and Opportunity/Restraints
- 13.1 Market drivers
- 13.2 Market challenges
- 13.3 Impact of drivers and challenges
- Impact of drivers and challenges in 2024 and 2029
- 13.4 Market opportunities/restraints
14 Competitive Landscape
- 14.1 Overview
- 14.2 Competitive Landscape
- Overview on criticality of inputs and factors of differentiation
- 14.3 Landscape disruption
- Overview on factors of disruption
- 14.4 Industry risks
- Impact of key risks on business
15 Competitive Analysis
- 15.1 Companies profiled
- Companies covered
- 15.2 Company ranking index
- Company ranking index
- 15.3 Market positioning of companies
- Matrix on companies position and classification
- 15.4 AGROFERT AS
- AGROFERT AS - Overview
- AGROFERT AS - Product / Service
- AGROFERT AS - Key offerings
- SWOT
- 15.5 Asahi Kasei Corp.
- Asahi Kasei Corp. - Overview
- Asahi Kasei Corp. - Business segments
- Asahi Kasei Corp. - Key news
- Asahi Kasei Corp. - Key offerings
- Asahi Kasei Corp. - Segment focus
- SWOT
- 15.6 Eastman Chemical Co.
- Eastman Chemical Co. - Overview
- Eastman Chemical Co. - Business segments
- Eastman Chemical Co. - Key news
- Eastman Chemical Co. - Key offerings
- Eastman Chemical Co. - Segment focus
- SWOT
- 15.7 Eurenco
- Eurenco - Overview
- Eurenco - Product / Service
- Eurenco - Key offerings
- SWOT
- 15.8 GRN Cellulose Pvt. Ltd.
- GRN Cellulose Pvt. Ltd. - Overview
- GRN Cellulose Pvt. Ltd. - Product / Service
- GRN Cellulose Pvt. Ltd. - Key offerings
- SWOT
- 15.9 Hagedorn NC GmbH
- Hagedorn NC GmbH - Overview
- Hagedorn NC GmbH - Product / Service
- Hagedorn NC GmbH - Key offerings
- SWOT
- 15.10 Hubei Xuefei Chemical Co. Ltd.
- Hubei Xuefei Chemical Co. Ltd. - Overview
- Hubei Xuefei Chemical Co. Ltd. - Product / Service
- Hubei Xuefei Chemical Co. Ltd. - Key offerings
- SWOT
- 15.11 International Flavors and Fragrances Inc.
- International Flavors and Fragrances Inc. - Overview
- International Flavors and Fragrances Inc. - Business segments
- International Flavors and Fragrances Inc. - Key news
- International Flavors and Fragrances Inc. - Key offerings
- International Flavors and Fragrances Inc. - Segment focus
- SWOT
- 15.12 IVM Srl
- IVM Srl - Overview
- IVM Srl - Product / Service
- IVM Srl - Key offerings
- SWOT
- 15.13 MaxamCorp Holding S.L.
- MaxamCorp Holding S.L. - Overview
- MaxamCorp Holding S.L. - Product / Service
- MaxamCorp Holding S.L. - Key offerings
- SWOT
- 15.14 Nitrex Chemicals India Ltd.
- Nitrex Chemicals India Ltd. - Overview
- Nitrex Chemicals India Ltd. - Product / Service
- Nitrex Chemicals India Ltd. - Key offerings
- SWOT
- 15.15 Nitro Chemical Industry Ltd.
- Nitro Chemical Industry Ltd. - Overview
- Nitro Chemical Industry Ltd. - Product / Service
- Nitro Chemical Industry Ltd. - Key offerings
- SWOT
- 15.16 Nitroparis S.L.
- Nitroparis S.L. - Overview
- Nitroparis S.L. - Product / Service
- Nitroparis S.L. - Key offerings
- SWOT
- 15.17 Rheinmetall AG
- Rheinmetall AG - Overview
- Rheinmetall AG - Business segments
- Rheinmetall AG - Key news
- Rheinmetall AG - Key offerings
- Rheinmetall AG - Segment focus
- SWOT
- 15.18 TNC Industrial Co. Ltd.
- TNC Industrial Co. Ltd. - Overview
- TNC Industrial Co. Ltd. - Product / Service
- TNC Industrial Co. Ltd. - Key offerings
- SWOT
16 Appendix
- 16.1 Scope of the report
- 16.2 Inclusions and exclusions checklist
- Inclusions checklist
- Exclusions checklist
- 16.3 Currency conversion rates for US$
- Currency conversion rates for US$
- 16.4 Research methodology
- Research methodology
- 16.5 Data procurement
- Information sources
- 16.6 Data validation
- Data validation
- 16.7 Validation techniques employed for market sizing
- Validation techniques employed for market sizing
- 16.8 Data synthesis
- Data synthesis
- 16.9 360 degree market analysis
- 360 degree market analysis
- 16.10 List of abbreviations
- List of abbreviations

