|
|
市場調査レポート
商品コード
1502608
カボチャの種の世界市場 2024年~2028年Global pumpkin seeds market 2024-2028 |
||||||
|
|||||||
カスタマイズ可能
|
|||||||

| カボチャの種の世界市場 2024年~2028年 |
|
出版日: 2024年05月20日
発行: TechNavio
ページ情報: 英文 169 Pages
納期: 即納可能
|

全表示
- 概要
- 図表
- 目次
カボチャの種市場は2023年~2028年に15億680万米ドル、予測期間中のCAGRは16.5%で成長すると予測されています。
当レポートでは、カボチャの種市場の全体的な分析、市場規模・予測、動向、成長促進要因、課題、約25のベンダーを網羅したベンダー分析などを掲載しています。
現在の市場シナリオ、最新動向と促進要因、市場環境全体に関する最新分析を提供しています。市場は、カボチャの種の健康効果、美味しい食材やスナックとしての人気の上昇、組織化された小売業による幅広いリーチによって牽引されています。
| 市場範囲 | |
|---|---|
| 基準年 | 2024 |
| 終了年 | 2028 |
| 予測期間 | 2024-2028 |
| 成長モメンタム | 加速 |
| 前年比2024年 | 13.79% |
| CAGR | 16.5% |
| 増分額 | 15億680万米ドル |
本調査では、今後数年間のカボチャの種市場成長を牽引する主な要因の一つとして、オンライン小売業者を通じての入手が増加していることを挙げています。また、クリーン・ラベリングとビーガン人口の増加が市場の大きな需要につながります。
目次
第1章 エグゼクティブサマリー
- 市場概要
第2章 市場情勢
- 市場エコシステム
- 市場の特徴
- バリューチェーン分析
第3章 市場規模の評価
- 市場の定義
- 市場セグメント分析
- 市場規模 2023年
- 市場の見通し 2023年~2028年
第4章 市場規模実績
- 世界のカボチャの種市場 2018年~2022年
- 用途別セグメント分析 2018年~2022年
- タイプセグメント分析 2018年~2022年
- 地域別セグメント分析 2018年~2022年
- 国別セグメント分析 2018年~2022年
第5章 ファイブフォース分析
- ファイブフォースの要約
- 買い手の交渉力
- 供給企業の交渉力
- 新規参入業者の脅威
- 代替品の脅威
- 競争の脅威
- 市況
第6章 市場セグメンテーション:用途別
- 市場セグメンテーション
- 比較:用途別
- 食品:市場規模と予測 2023年~2028年
- 種子油生産:市場規模と予測 2023年~2028年
- 栄養補助食品:市場規模と予測 2023年~2028年
- 市場機会:用途別
第7章 市場セグメンテーション:タイプ別
- 市場セグメンテーション
- 比較:タイプ別
- 従来型:市場規模と予測 2023年~2028年
- オーガニック:市場規模と予測 2023年~2028年
- 市場機会:タイプ別
第8章 顧客情勢
- 顧客情勢の概要
第9章 地域別情勢
- 地域別セグメンテーション
- 地域別比較
- アジア太平洋:市場規模と予測 2023年~2028年
- 欧州:市場規模と予測 2023年~2028年
- 北米:市場規模と予測 2023年~2028年
- 南米:市場規模と予測 2023年~2028年
- 中東・アフリカ:市場規模と予測 2023年~2028年
- 中国:市場規模と予測 2023年~2028年
- 米国:市場規模と予測 2023年~2028年
- インド:市場規模と予測 2023年~2028年
- スペイン:市場規模と予測 2023年~2028年
- 英国:市場規模と予測 2023年~2028年
- 市場機会:地域情勢別
第10章 促進要因・課題・機会・抑制要因
- 市場促進要因
- 市場の課題
- 促進要因と課題の影響
- 市場の機会・抑制要因
第11章 競合情勢
- 概要
- 競合情勢
- 混乱の状況
- 業界のリスク
第12章 競合分析
- 企業プロファイル
- 企業の市場ポジショニング
- AKS NEV Ltd.
- Antonio Foods
- Conagra Brands Inc.
- Ebro foods SA
- Giant Snacks Inc.
- Happilo International Pvt. Ltd.
- Howard Dill Enterprises
- HW Wellness Solutions Pvt. Ltd.
- Johnvince Foods Ltd.
- Krispy Kernels
- McCormick and Co. Inc.
- Meridian foods Ltd.
- Nestle SA
- PepsiCo Inc.
- Prana Organic
第13章 付録
Exhibits:
- Exhibits1: Executive Summary - Chart on Market Overview
- Exhibits2: Executive Summary - Data Table on Market Overview
- Exhibits3: Executive Summary - Chart on Global Market Characteristics
- Exhibits4: Executive Summary - Chart on Market By Geographical Landscape
- Exhibits5: Executive Summary - Chart on Market Segmentation by Application
- Exhibits6: Executive Summary - Chart on Market Segmentation by Type
- Exhibits7: Executive Summary - Chart on Incremental Growth
- Exhibits8: Executive Summary - Data Table on Incremental Growth
- Exhibits9: Executive Summary - Chart on Company Market Positioning
- Exhibits10: Parent Market
- Exhibits11: Data Table on - Parent Market
- Exhibits12: Market characteristics analysis
- Exhibits13: Value Chain Analysis
- Exhibits14: Offerings of companies included in the market definition
- Exhibits15: Market segments
- Exhibits16: Chart on Global - Market size and forecast 2023-2028 ($ million)
- Exhibits17: Data Table on Global - Market size and forecast 2023-2028 ($ million)
- Exhibits18: Chart on Global Market: Year-over-year growth 2023-2028 (%)
- Exhibits19: Data Table on Global Market: Year-over-year growth 2023-2028 (%)
- Exhibits20: Historic Market Size - Data Table on Global Pumpkin Seeds Market 2018 - 2022 ($ million)
- Exhibits21: Historic Market Size - Application Segment 2018 - 2022 ($ million)
- Exhibits22: Historic Market Size - Type Segment 2018 - 2022 ($ million)
- Exhibits23: Historic Market Size - Geography Segment 2018 - 2022 ($ million)
- Exhibits24: Historic Market Size - Country Segment 2018 - 2022 ($ million)
- Exhibits25: Five forces analysis - Comparison between 2023 and 2028
- Exhibits26: Bargaining power of buyers - Impact of key factors 2023 and 2028
- Exhibits27: Bargaining power of suppliers - Impact of key factors in 2023 and 2028
- Exhibits28: Threat of new entrants - Impact of key factors in 2023 and 2028
- Exhibits29: Threat of substitutes - Impact of key factors in 2023 and 2028
- Exhibits30: Threat of rivalry - Impact of key factors in 2023 and 2028
- Exhibits31: Chart on Market condition - Five forces 2023 and 2028
- Exhibits32: Chart on Application - Market share 2023-2028 (%)
- Exhibits33: Data Table on Application - Market share 2023-2028 (%)
- Exhibits34: Chart on Comparison by Application
- Exhibits35: Data Table on Comparison by Application
- Exhibits36: Chart on Food - Market size and forecast 2023-2028 ($ million)
- Exhibits37: Data Table on Food - Market size and forecast 2023-2028 ($ million)
- Exhibits38: Chart on Food - Year-over-year growth 2023-2028 (%)
- Exhibits39: Data Table on Food - Year-over-year growth 2023-2028 (%)
- Exhibits40: Chart on Seed oil production - Market size and forecast 2023-2028 ($ million)
- Exhibits41: Data Table on Seed oil production - Market size and forecast 2023-2028 ($ million)
- Exhibits42: Chart on Seed oil production - Year-over-year growth 2023-2028 (%)
- Exhibits43: Data Table on Seed oil production - Year-over-year growth 2023-2028 (%)
- Exhibits44: Chart on Nutraceuticals - Market size and forecast 2023-2028 ($ million)
- Exhibits45: Data Table on Nutraceuticals - Market size and forecast 2023-2028 ($ million)
- Exhibits46: Chart on Nutraceuticals - Year-over-year growth 2023-2028 (%)
- Exhibits47: Data Table on Nutraceuticals - Year-over-year growth 2023-2028 (%)
- Exhibits48: Market opportunity by Application ($ million)
- Exhibits49: Data Table on Market opportunity by Application ($ million)
- Exhibits50: Chart on Type - Market share 2023-2028 (%)
- Exhibits51: Data Table on Type - Market share 2023-2028 (%)
- Exhibits52: Chart on Comparison by Type
- Exhibits53: Data Table on Comparison by Type
- Exhibits54: Chart on Conventional - Market size and forecast 2023-2028 ($ million)
- Exhibits55: Data Table on Conventional - Market size and forecast 2023-2028 ($ million)
- Exhibits56: Chart on Conventional - Year-over-year growth 2023-2028 (%)
- Exhibits57: Data Table on Conventional - Year-over-year growth 2023-2028 (%)
- Exhibits58: Chart on Organic - Market size and forecast 2023-2028 ($ million)
- Exhibits59: Data Table on Organic - Market size and forecast 2023-2028 ($ million)
- Exhibits60: Chart on Organic - Year-over-year growth 2023-2028 (%)
- Exhibits61: Data Table on Organic - Year-over-year growth 2023-2028 (%)
- Exhibits62: Market opportunity by Type ($ million)
- Exhibits63: Data Table on Market opportunity by Type ($ million)
- Exhibits64: Analysis of price sensitivity, lifecycle, customer purchase basket, adoption rates, and purchase criteria
- Exhibits65: Chart on Market share By Geographical Landscape 2023-2028 (%)
- Exhibits66: Data Table on Market share By Geographical Landscape 2023-2028 (%)
- Exhibits67: Chart on Geographic comparison
- Exhibits68: Data Table on Geographic comparison
- Exhibits69: Chart on APAC - Market size and forecast 2023-2028 ($ million)
- Exhibits70: Data Table on APAC - Market size and forecast 2023-2028 ($ million)
- Exhibits71: Chart on APAC - Year-over-year growth 2023-2028 (%)
- Exhibits72: Data Table on APAC - Year-over-year growth 2023-2028 (%)
- Exhibits73: Chart on Europe - Market size and forecast 2023-2028 ($ million)
- Exhibits74: Data Table on Europe - Market size and forecast 2023-2028 ($ million)
- Exhibits75: Chart on Europe - Year-over-year growth 2023-2028 (%)
- Exhibits76: Data Table on Europe - Year-over-year growth 2023-2028 (%)
- Exhibits77: Chart on North America - Market size and forecast 2023-2028 ($ million)
- Exhibits78: Data Table on North America - Market size and forecast 2023-2028 ($ million)
- Exhibits79: Chart on North America - Year-over-year growth 2023-2028 (%)
- Exhibits80: Data Table on North America - Year-over-year growth 2023-2028 (%)
- Exhibits81: Chart on South America - Market size and forecast 2023-2028 ($ million)
- Exhibits82: Data Table on South America - Market size and forecast 2023-2028 ($ million)
- Exhibits83: Chart on South America - Year-over-year growth 2023-2028 (%)
- Exhibits84: Data Table on South America - Year-over-year growth 2023-2028 (%)
- Exhibits85: Chart on Middle East and Africa - Market size and forecast 2023-2028 ($ million)
- Exhibits86: Data Table on Middle East and Africa - Market size and forecast 2023-2028 ($ million)
- Exhibits87: Chart on Middle East and Africa - Year-over-year growth 2023-2028 (%)
- Exhibits88: Data Table on Middle East and Africa - Year-over-year growth 2023-2028 (%)
- Exhibits89: Chart on China - Market size and forecast 2023-2028 ($ million)
- Exhibits90: Data Table on China - Market size and forecast 2023-2028 ($ million)
- Exhibits91: Chart on China - Year-over-year growth 2023-2028 (%)
- Exhibits92: Data Table on China - Year-over-year growth 2023-2028 (%)
- Exhibits93: Chart on US - Market size and forecast 2023-2028 ($ million)
- Exhibits94: Data Table on US - Market size and forecast 2023-2028 ($ million)
- Exhibits95: Chart on US - Year-over-year growth 2023-2028 (%)
- Exhibits96: Data Table on US - Year-over-year growth 2023-2028 (%)
- Exhibits97: Chart on India - Market size and forecast 2023-2028 ($ million)
- Exhibits98: Data Table on India - Market size and forecast 2023-2028 ($ million)
- Exhibits99: Chart on India - Year-over-year growth 2023-2028 (%)
- Exhibits100: Data Table on India - Year-over-year growth 2023-2028 (%)
- Exhibits101: Chart on Spain - Market size and forecast 2023-2028 ($ million)
- Exhibits102: Data Table on Spain - Market size and forecast 2023-2028 ($ million)
- Exhibits103: Chart on Spain - Year-over-year growth 2023-2028 (%)
- Exhibits104: Data Table on Spain - Year-over-year growth 2023-2028 (%)
- Exhibits105: Chart on UK - Market size and forecast 2023-2028 ($ million)
- Exhibits106: Data Table on UK - Market size and forecast 2023-2028 ($ million)
- Exhibits107: Chart on UK - Year-over-year growth 2023-2028 (%)
- Exhibits108: Data Table on UK - Year-over-year growth 2023-2028 (%)
- Exhibits109: Market opportunity By Geographical Landscape ($ million)
- Exhibits110: Data Tables on Market opportunity By Geographical Landscape ($ million)
- Exhibits111: Impact of drivers and challenges in 2023 and 2028
- Exhibits112: Overview on criticality of inputs and factors of differentiation
- Exhibits113: Overview on factors of disruption
- Exhibits114: Impact of key risks on business
- Exhibits115: Companies covered
- Exhibits116: Matrix on companies position and classification
- Exhibits117: AKS NEV Ltd. - Overview
- Exhibits118: AKS NEV Ltd. - Product / Service
- Exhibits119: AKS NEV Ltd. - Key offerings
- Exhibits120: Antonio Foods - Overview
- Exhibits121: Antonio Foods - Product / Service
- Exhibits122: Antonio Foods - Key offerings
- Exhibits123: Conagra Brands Inc. - Overview
- Exhibits124: Conagra Brands Inc. - Business segments
- Exhibits125: Conagra Brands Inc. - Key offerings
- Exhibits126: Conagra Brands Inc. - Segment focus
- Exhibits127: Ebro foods SA - Overview
- Exhibits128: Ebro foods SA - Product / Service
- Exhibits129: Ebro foods SA - Key offerings
- Exhibits130: Giant Snacks Inc. - Overview
- Exhibits131: Giant Snacks Inc. - Product / Service
- Exhibits132: Giant Snacks Inc. - Key offerings
- Exhibits133: Happilo International Pvt. Ltd. - Overview
- Exhibits134: Happilo International Pvt. Ltd. - Product / Service
- Exhibits135: Happilo International Pvt. Ltd. - Key offerings
- Exhibits136: Howard Dill Enterprises - Overview
- Exhibits137: Howard Dill Enterprises - Product / Service
- Exhibits138: Howard Dill Enterprises - Key offerings
- Exhibits139: HW Wellness Solutions Pvt. Ltd. - Overview
- Exhibits140: HW Wellness Solutions Pvt. Ltd. - Product / Service
- Exhibits141: HW Wellness Solutions Pvt. Ltd. - Key offerings
- Exhibits142: Johnvince Foods Ltd. - Overview
- Exhibits143: Johnvince Foods Ltd. - Product / Service
- Exhibits144: Johnvince Foods Ltd. - Key offerings
- Exhibits145: Krispy Kernels - Overview
- Exhibits146: Krispy Kernels - Product / Service
- Exhibits147: Krispy Kernels - Key offerings
- Exhibits148: McCormick and Co. Inc. - Overview
- Exhibits149: McCormick and Co. Inc. - Business segments
- Exhibits150: McCormick and Co. Inc. - Key offerings
- Exhibits151: McCormick and Co. Inc. - Segment focus
- Exhibits152: Meridian foods Ltd. - Overview
- Exhibits153: Meridian foods Ltd. - Product / Service
- Exhibits154: Meridian foods Ltd. - Key offerings
- Exhibits155: Nestle SA - Overview
- Exhibits156: Nestle SA - Business segments
- Exhibits157: Nestle SA - Key news
- Exhibits158: Nestle SA - Key offerings
- Exhibits159: Nestle SA - Segment focus
- Exhibits160: PepsiCo Inc. - Overview
- Exhibits161: PepsiCo Inc. - Business segments
- Exhibits162: PepsiCo Inc. - Key news
- Exhibits163: PepsiCo Inc. - Key offerings
- Exhibits164: PepsiCo Inc. - Segment focus
- Exhibits165: Prana Organic - Overview
- Exhibits166: Prana Organic - Product / Service
- Exhibits167: Prana Organic - Key offerings
- Exhibits168: Inclusions checklist
- Exhibits169: Exclusions checklist
- Exhibits170: Currency conversion rates for US$
- Exhibits171: Research methodology
- Exhibits172: Information sources
- Exhibits173: Data validation
- Exhibits174: Validation techniques employed for market sizing
- Exhibits175: Data synthesis
- Exhibits176: 360 degree market analysis
- Exhibits177: List of abbreviations
The pumpkin seeds market is forecasted to grow by USD 1506.8 mn during 2023-2028, accelerating at a CAGR of 16.5% during the forecast period. The report on the pumpkin seeds market provides a holistic analysis, market size and forecast, trends, growth drivers, and challenges, as well as vendor analysis covering around 25 vendors.
The report offers an up-to-date analysis regarding the current market scenario, the latest trends and drivers, and the overall market environment. The market is driven by health benefits of pumpkin seeds, rise in popularity as a tasty ingredient and snack, and wider reach through organized retailing.
Technavio's pumpkin seeds market is segmented as below:
| Market Scope | |
|---|---|
| Base Year | 2024 |
| End Year | 2028 |
| Series Year | 2024-2028 |
| Growth Momentum | Accelerate |
| YOY 2024 | 13.79% |
| CAGR | 16.5% |
| Incremental Value | $1506.8mn |
By Application
- Food
- Seed oil production
- Nutraceuticals
By Type
- Conventional
- Organic
By Geographical Landscape
- APAC
- Europe
- North America
- South America
- Middle East and Africa
This study identifies the increasing availability through online retailers as one of the prime reasons driving the pumpkin seeds market growth during the next few years. Also, clean labeling and growing vegan population will lead to sizable demand in the market.
The report on the pumpkin seeds market covers the following areas:
- Pumpkin seeds market sizing
- Pumpkin seeds market forecast
- Pumpkin seeds market industry analysis
The robust vendor analysis is designed to help clients improve their market position, and in line with this, this report provides a detailed analysis of several leading pumpkin seeds market vendors that include AKS NEV Ltd., Antonio Foods, Conagra Brands Inc., Conscious Food Pvt. Ltd., Ebro foods SA, Giant Snacks Inc., Happilo International Pvt. Ltd., Howard Dill Enterprises, HW Wellness Solutions Pvt. Ltd., Johnvince Foods Ltd., Krispy Kernels, McCormick and Co. Inc., Meridian foods Ltd., Nestle SA, PepsiCo Inc., Prana Organic, Rizhao Golden Nut Group, Seeds for Africa, Shandong Farmer Land Foodstuff Co. Ltd., and Shandong Jinsheng Cereals and Oils Industrial Co. Ltd.. Also, the pumpkin seeds market analysis report includes information on upcoming trends and challenges that will influence market growth. This is to help companies strategize and leverage all forthcoming growth opportunities.
The study was conducted using an objective combination of primary and secondary information including inputs from key participants in the industry. The report contains a comprehensive market and vendor landscape in addition to an analysis of the key vendors.
The publisher presents a detailed picture of the market by the way of study, synthesis, and summation of data from multiple sources by an analysis of key parameters such as profit, pricing, competition, and promotions. It presents various market facets by identifying the key industry influencers. The data presented is comprehensive, reliable, and a result of extensive research - both primary and secondary. The market research reports provide a complete competitive landscape and an in-depth vendor selection methodology and analysis using qualitative and quantitative research to forecast the accurate market growth.
Table of Contents
1 Executive Summary
- 1.1 Market overview
- Executive Summary - Chart on Market Overview
- Executive Summary - Data Table on Market Overview
- Executive Summary - Chart on Global Market Characteristics
- Executive Summary - Chart on Market By Geographical Landscape
- Executive Summary - Chart on Market Segmentation by Application
- Executive Summary - Chart on Market Segmentation by Type
- Executive Summary - Chart on Incremental Growth
- Executive Summary - Data Table on Incremental Growth
- Executive Summary - Chart on Company Market Positioning
2 Market Landscape
- 2.1 Market ecosystem
- Parent Market
- Data Table on - Parent Market
- 2.2 Market characteristics
- Market characteristics analysis
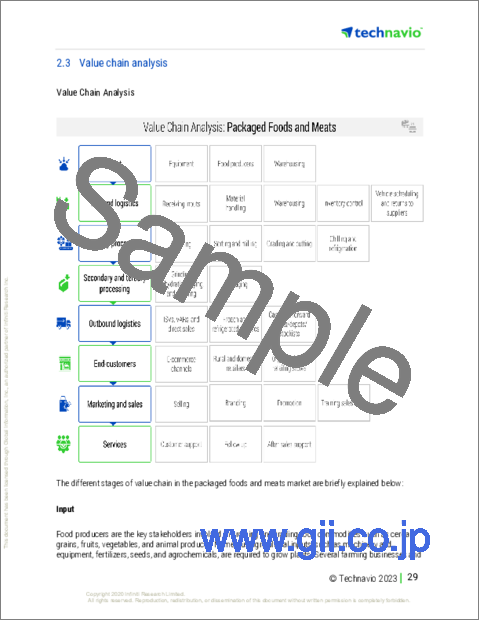
- 2.3 Value chain analysis
- Value Chain Analysis
3 Market Sizing
- 3.1 Market definition
- Offerings of companies included in the market definition
- 3.2 Market segment analysis
- Market segments
- 3.3 Market size 2023
- 3.4 Market outlook: Forecast for 2023-2028
- Chart on Global - Market size and forecast 2023-2028 ($ million)
- Data Table on Global - Market size and forecast 2023-2028 ($ million)
- Chart on Global Market: Year-over-year growth 2023-2028 (%)
- Data Table on Global Market: Year-over-year growth 2023-2028 (%)
4 Historic Market Size
- 4.1 Global Pumpkin Seeds Market 2018 - 2022
- Historic Market Size - Data Table on Global Pumpkin Seeds Market 2018 - 2022 ($ million)
- 4.2 Application segment analysis 2018 - 2022
- Historic Market Size - Application Segment 2018 - 2022 ($ million)
- 4.3 Type segment analysis 2018 - 2022
- Historic Market Size - Type Segment 2018 - 2022 ($ million)
- 4.4 Geography segment analysis 2018 - 2022
- Historic Market Size - Geography Segment 2018 - 2022 ($ million)
- 4.5 Country segment analysis 2018 - 2022
- Historic Market Size - Country Segment 2018 - 2022 ($ million)
5 Five Forces Analysis
- 5.1 Five forces summary
- Five forces analysis - Comparison between 2023 and 2028
- 5.2 Bargaining power of buyers
- Bargaining power of buyers - Impact of key factors 2023 and 2028
- 5.3 Bargaining power of suppliers
- Bargaining power of suppliers - Impact of key factors in 2023 and 2028
- 5.4 Threat of new entrants
- Threat of new entrants - Impact of key factors in 2023 and 2028
- 5.5 Threat of substitutes
- Threat of substitutes - Impact of key factors in 2023 and 2028
- 5.6 Threat of rivalry
- Threat of rivalry - Impact of key factors in 2023 and 2028
- 5.7 Market condition
- Chart on Market condition - Five forces 2023 and 2028
6 Market Segmentation by Application
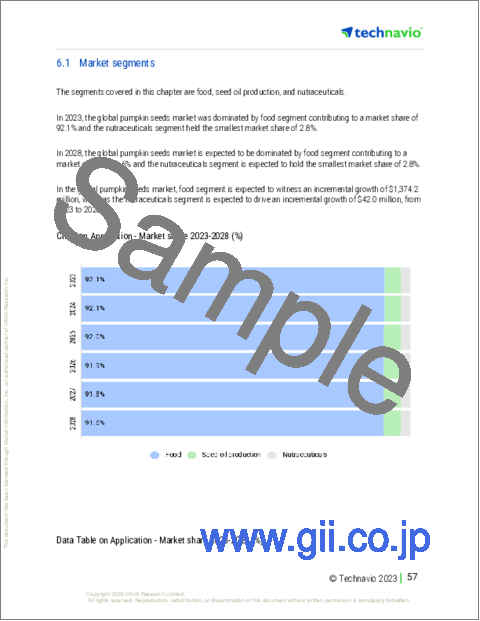
- 6.1 Market segments
- Chart on Application - Market share 2023-2028 (%)
- Data Table on Application - Market share 2023-2028 (%)
- 6.2 Comparison by Application
- Chart on Comparison by Application
- Data Table on Comparison by Application
- 6.3 Food - Market size and forecast 2023-2028
- Chart on Food - Market size and forecast 2023-2028 ($ million)
- Data Table on Food - Market size and forecast 2023-2028 ($ million)
- Chart on Food - Year-over-year growth 2023-2028 (%)
- Data Table on Food - Year-over-year growth 2023-2028 (%)
- 6.4 Seed oil production - Market size and forecast 2023-2028
- Chart on Seed oil production - Market size and forecast 2023-2028 ($ million)
- Data Table on Seed oil production - Market size and forecast 2023-2028 ($ million)
- Chart on Seed oil production - Year-over-year growth 2023-2028 (%)
- Data Table on Seed oil production - Year-over-year growth 2023-2028 (%)
- 6.5 Nutraceuticals - Market size and forecast 2023-2028
- Chart on Nutraceuticals - Market size and forecast 2023-2028 ($ million)
- Data Table on Nutraceuticals - Market size and forecast 2023-2028 ($ million)
- Chart on Nutraceuticals - Year-over-year growth 2023-2028 (%)
- Data Table on Nutraceuticals - Year-over-year growth 2023-2028 (%)
- 6.6 Market opportunity by Application
- Market opportunity by Application ($ million)
- Data Table on Market opportunity by Application ($ million)
7 Market Segmentation by Type
- 7.1 Market segments
- Chart on Type - Market share 2023-2028 (%)
- Data Table on Type - Market share 2023-2028 (%)
- 7.2 Comparison by Type
- Chart on Comparison by Type
- Data Table on Comparison by Type
- 7.3 Conventional - Market size and forecast 2023-2028
- Chart on Conventional - Market size and forecast 2023-2028 ($ million)
- Data Table on Conventional - Market size and forecast 2023-2028 ($ million)
- Chart on Conventional - Year-over-year growth 2023-2028 (%)
- Data Table on Conventional - Year-over-year growth 2023-2028 (%)
- 7.4 Organic - Market size and forecast 2023-2028
- Chart on Organic - Market size and forecast 2023-2028 ($ million)
- Data Table on Organic - Market size and forecast 2023-2028 ($ million)
- Chart on Organic - Year-over-year growth 2023-2028 (%)
- Data Table on Organic - Year-over-year growth 2023-2028 (%)
- 7.5 Market opportunity by Type
- Market opportunity by Type ($ million)
- Data Table on Market opportunity by Type ($ million)
8 Customer Landscape
- 8.1 Customer landscape overview
- Analysis of price sensitivity, lifecycle, customer purchase basket, adoption rates, and purchase criteria
9 Geographic Landscape
- 9.1 Geographic segmentation
- Chart on Market share By Geographical Landscape 2023-2028 (%)
- Data Table on Market share By Geographical Landscape 2023-2028 (%)
- 9.2 Geographic comparison
- Chart on Geographic comparison
- Data Table on Geographic comparison
- 9.3 APAC - Market size and forecast 2023-2028
- Chart on APAC - Market size and forecast 2023-2028 ($ million)
- Data Table on APAC - Market size and forecast 2023-2028 ($ million)
- Chart on APAC - Year-over-year growth 2023-2028 (%)
- Data Table on APAC - Year-over-year growth 2023-2028 (%)
- 9.4 Europe - Market size and forecast 2023-2028
- Chart on Europe - Market size and forecast 2023-2028 ($ million)
- Data Table on Europe - Market size and forecast 2023-2028 ($ million)
- Chart on Europe - Year-over-year growth 2023-2028 (%)
- Data Table on Europe - Year-over-year growth 2023-2028 (%)
- 9.5 North America - Market size and forecast 2023-2028
- Chart on North America - Market size and forecast 2023-2028 ($ million)
- Data Table on North America - Market size and forecast 2023-2028 ($ million)
- Chart on North America - Year-over-year growth 2023-2028 (%)
- Data Table on North America - Year-over-year growth 2023-2028 (%)
- 9.6 South America - Market size and forecast 2023-2028
- Chart on South America - Market size and forecast 2023-2028 ($ million)
- Data Table on South America - Market size and forecast 2023-2028 ($ million)
- Chart on South America - Year-over-year growth 2023-2028 (%)
- Data Table on South America - Year-over-year growth 2023-2028 (%)
- 9.7 Middle East and Africa - Market size and forecast 2023-2028
- Chart on Middle East and Africa - Market size and forecast 2023-2028 ($ million)
- Data Table on Middle East and Africa - Market size and forecast 2023-2028 ($ million)
- Chart on Middle East and Africa - Year-over-year growth 2023-2028 (%)
- Data Table on Middle East and Africa - Year-over-year growth 2023-2028 (%)
- 9.8 China - Market size and forecast 2023-2028
- Chart on China - Market size and forecast 2023-2028 ($ million)
- Data Table on China - Market size and forecast 2023-2028 ($ million)
- Chart on China - Year-over-year growth 2023-2028 (%)
- Data Table on China - Year-over-year growth 2023-2028 (%)
- 9.9 US - Market size and forecast 2023-2028
- Chart on US - Market size and forecast 2023-2028 ($ million)
- Data Table on US - Market size and forecast 2023-2028 ($ million)
- Chart on US - Year-over-year growth 2023-2028 (%)
- Data Table on US - Year-over-year growth 2023-2028 (%)
- 9.10 India - Market size and forecast 2023-2028
- Chart on India - Market size and forecast 2023-2028 ($ million)
- Data Table on India - Market size and forecast 2023-2028 ($ million)
- Chart on India - Year-over-year growth 2023-2028 (%)
- Data Table on India - Year-over-year growth 2023-2028 (%)
- 9.11 Spain - Market size and forecast 2023-2028
- Chart on Spain - Market size and forecast 2023-2028 ($ million)
- Data Table on Spain - Market size and forecast 2023-2028 ($ million)
- Chart on Spain - Year-over-year growth 2023-2028 (%)
- Data Table on Spain - Year-over-year growth 2023-2028 (%)
- 9.12 UK - Market size and forecast 2023-2028
- Chart on UK - Market size and forecast 2023-2028 ($ million)
- Data Table on UK - Market size and forecast 2023-2028 ($ million)
- Chart on UK - Year-over-year growth 2023-2028 (%)
- Data Table on UK - Year-over-year growth 2023-2028 (%)
- 9.13 Market opportunity By Geographical Landscape
- Market opportunity By Geographical Landscape ($ million)
- Data Tables on Market opportunity By Geographical Landscape ($ million)
10 Drivers, Challenges, and Opportunity/Restraints
- 10.1 Market drivers
- 10.2 Market challenges
- 10.3 Impact of drivers and challenges
- Impact of drivers and challenges in 2023 and 2028
- 10.4 Market opportunities/restraints
11 Competitive Landscape
- 11.1 Overview
- 11.2 Competitive Landscape
- Overview on criticality of inputs and factors of differentiation
- 11.3 Landscape disruption
- Overview on factors of disruption
- 11.4 Industry risks
- Impact of key risks on business
12 Competitive Analysis
- 12.1 Companies profiled
- Companies covered
- 12.2 Market positioning of companies
- Matrix on companies position and classification
- 12.3 AKS NEV Ltd.
- AKS NEV Ltd. - Overview
- AKS NEV Ltd. - Product / Service
- AKS NEV Ltd. - Key offerings
- 12.4 Antonio Foods
- Antonio Foods - Overview
- Antonio Foods - Product / Service
- Antonio Foods - Key offerings
- 12.5 Conagra Brands Inc.
- Conagra Brands Inc. - Overview
- Conagra Brands Inc. - Business segments
- Conagra Brands Inc. - Key offerings
- Conagra Brands Inc. - Segment focus
- 12.6 Ebro foods SA
- Ebro foods SA - Overview
- Ebro foods SA - Product / Service
- Ebro foods SA - Key offerings
- 12.7 Giant Snacks Inc.
- Giant Snacks Inc. - Overview
- Giant Snacks Inc. - Product / Service
- Giant Snacks Inc. - Key offerings
- 12.8 Happilo International Pvt. Ltd.
- Happilo International Pvt. Ltd. - Overview
- Happilo International Pvt. Ltd. - Product / Service
- Happilo International Pvt. Ltd. - Key offerings
- 12.9 Howard Dill Enterprises
- Howard Dill Enterprises - Overview
- Howard Dill Enterprises - Product / Service
- Howard Dill Enterprises - Key offerings
- 12.10 HW Wellness Solutions Pvt. Ltd.
- HW Wellness Solutions Pvt. Ltd. - Overview
- HW Wellness Solutions Pvt. Ltd. - Product / Service
- HW Wellness Solutions Pvt. Ltd. - Key offerings
- 12.11 Johnvince Foods Ltd.
- Johnvince Foods Ltd. - Overview
- Johnvince Foods Ltd. - Product / Service
- Johnvince Foods Ltd. - Key offerings
- 12.12 Krispy Kernels
- Krispy Kernels - Overview
- Krispy Kernels - Product / Service
- Krispy Kernels - Key offerings
- 12.13 McCormick and Co. Inc.
- McCormick and Co. Inc. - Overview
- McCormick and Co. Inc. - Business segments
- McCormick and Co. Inc. - Key offerings
- McCormick and Co. Inc. - Segment focus
- 12.14 Meridian foods Ltd.
- Meridian foods Ltd. - Overview
- Meridian foods Ltd. - Product / Service
- Meridian foods Ltd. - Key offerings
- 12.15 Nestle SA
- Nestle SA - Overview
- Nestle SA - Business segments
- Nestle SA - Key news
- Nestle SA - Key offerings
- Nestle SA - Segment focus
- 12.16 PepsiCo Inc.
- PepsiCo Inc. - Overview
- PepsiCo Inc. - Business segments
- PepsiCo Inc. - Key news
- PepsiCo Inc. - Key offerings
- PepsiCo Inc. - Segment focus
- 12.17 Prana Organic
- Prana Organic - Overview
- Prana Organic - Product / Service
- Prana Organic - Key offerings
13 Appendix
- 13.1 Scope of the report
- 13.2 Inclusions and exclusions checklist
- Inclusions checklist
- Exclusions checklist
- 13.3 Currency conversion rates for US$
- Currency conversion rates for US$
- 13.4 Research methodology
- Research methodology
- 13.5 Data procurement
- Information sources
- 13.6 Data validation
- Data validation
- 13.7 Validation techniques employed for market sizing
- Validation techniques employed for market sizing
- 13.8 Data synthesis
- Data synthesis
- 13.9 360 degree market analysis
- 360 degree market analysis
- 13.10 List of abbreviations
- List of abbreviations
