|
|
市場調査レポート
商品コード
1525246
ステンレス鋼400シリーズの世界市場 2024-2028Global stainless steel 400 series market 2024-2028 |
||||||

|
|||||||
カスタマイズ可能
|
|||||||

| ステンレス鋼400シリーズの世界市場 2024-2028 |
|
出版日: 2024年07月12日
発行: TechNavio
ページ情報: 英文 171 Pages
納期: 即納可能
|

全表示
- 概要
- 図表
- 目次
ステンレス鋼400シリーズ市場は2023-2028年に114億9,000万米ドル、予測期間中のCAGRは6.67%で成長すると予測されます。
当レポートでは、ステンレス鋼400シリーズ市場の全体的な分析、市場規模・予測、動向、成長促進要因、課題、約25のベンダーを網羅したベンダー分析などを掲載しています。
現在の市場シナリオ、最新動向と促進要因、市場環境全体に関する最新分析を提供しています。中国とインドの経済成長によるステンレス鋼400シリーズ需要の増加、高強度ステンレス鋼の消費急増、耐食性と優れた機械的特性などが市場を牽引しています。
| 市場範囲 | |
|---|---|
| 基準年 | 2024 |
| 終了年 | 2028 |
| 予測期間 | 2024-2028 |
| 成長モメンタム | 加速 |
| 前年比2024年 | 6.19% |
| CAGR | 6.67% |
| 増分額 | 114億9,000万米ドル |
本調査では、今後数年間のステンレス鋼400シリーズ市場成長を牽引する主な要因の一つとして、産業用途におけるステンレス鋼400シリーズの普及拡大を挙げています。また、鉄鋼およびステンレス鋼スクラップ需要の増加、建設およびインフラプロジェクトの増加も市場の大きな需要につながります。
目次
第1章 エグゼクティブサマリー
- 市場概要
第2章 市場情勢
- 市場エコシステム
- 市場の特徴
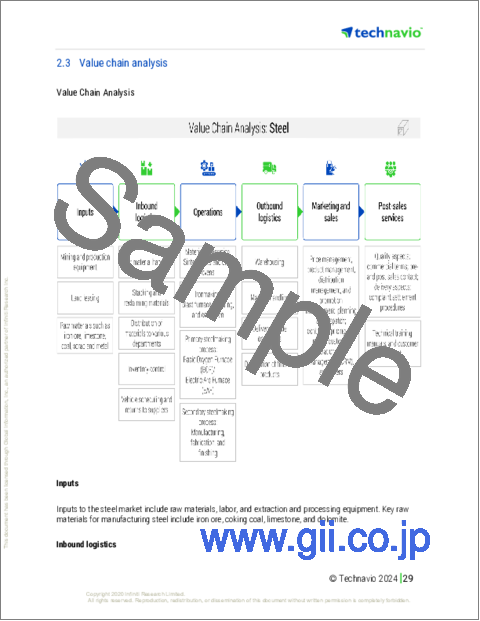
- バリューチェーン分析
第3章 市場規模の評価
- 市場の定義
- 市場セグメント分析
- 市場規模 2023
- 市場の見通し 2023-2028
第4章 市場規模実績
- 世界ステンレス鋼400シリーズ市場 2018-2022
- エンドユーザー別セグメント分析 2018-2022
- 製品タイプ別セグメント分析 2018-2022
- 地域別セグメント分析 2018-2022
- 国別セグメント分析 2018-2022
第5章 ファイブフォース分析
- ファイブフォースの要約
- 買い手の交渉力
- 供給企業の交渉力
- 新規参入業者の脅威
- 代替品の脅威
- 競争の脅威
- 市況
第6章 市場セグメンテーション:エンドユーザー別
- 市場セグメンテーション
- 比較:エンドユーザー別
- 消耗品:市場規模と予測 2023-2028
- 機械工業・重工業:市場規模と予測 2023-2028
- 自動車・輸送:市場規模と予測 2023-2028
- 建築・建設:市場規模と予測 2023-2028
- その他:市場規模と予測 2023-2028
- 市場機会:エンドユーザー別
第7章 市場セグメンテーション:製品タイプ別
- 市場セグメンテーション
- 比較:製品タイプ別
- プレートとシート:市場規模と予測 2023-2028
- バーとチューブラー:市場規模と予測 2023-2028
- 建築構造用:市場規模と予測 2023-2028
- 市場機会:製品タイプ別
第8章 顧客情勢
- 顧客情勢の概要
第9章 地域別情勢
- 地域別セグメンテーション
- 地域別比較
- アジア太平洋:市場規模と予測 2023-2028
- 欧州:市場規模と予測 2023-2028
- 北米:市場規模と予測 2023-2028
- 中東・アフリカ:市場規模と予測 2023-2028
- 南米:市場規模と予測 2023-2028
- 中国:市場規模と予測 2023-2028
- インド:市場規模と予測 2023-2028
- 米国:市場規模と予測 2023-2028
- 日本:市場規模と予測 2023-2028
- 韓国:市場規模と予測 2023-2028
- 市場機会:地域情勢別
第10章 促進要因・課題・機会・抑制要因
- 市場促進要因
- 市場の課題
- 促進要因と課題の影響
- 市場の機会・抑制要因
第11章 競合情勢
- 概要
- 競合情勢
- 混乱の状況
- 業界のリスク
第12章 競合分析
- 企業プロファイル
- 企業の市場ポジショニング
- Aperam SA
- ArcelorMittal
- Baosteel Group Corp.
- Cleveland Cliffs Inc.
- E United Group
- Helander
- Hunan Fushun Metal Co. Ltd.
- Jindal Stainless Ltd.
- Mirach Metallurgy Co. Ltd.
- Nippon Steel Corp.
- Outokumpu Oyj
- POSCO holdings Inc.
- Tata Steel
- thyssenkrupp AG
- Tianjin Pipe International Economic and Trading Corp.
第13章 付録
Exhibits:
- Exhibits1: Executive Summary - Chart on Market Overview
- Exhibits2: Executive Summary - Data Table on Market Overview
- Exhibits3: Executive Summary - Chart on Global Market Characteristics
- Exhibits4: Executive Summary - Chart on Market By Geographical Landscape
- Exhibits5: Executive Summary - Chart on Market Segmentation by End-user
- Exhibits6: Executive Summary - Chart on Market Segmentation by Product Type
- Exhibits7: Executive Summary - Chart on Incremental Growth
- Exhibits8: Executive Summary - Data Table on Incremental Growth
- Exhibits9: Executive Summary - Chart on Company Market Positioning
- Exhibits10: Parent Market
- Exhibits11: Data Table on - Parent Market
- Exhibits12: Market characteristics analysis
- Exhibits13: Value Chain Analysis
- Exhibits14: Offerings of companies included in the market definition
- Exhibits15: Market segments
- Exhibits16: Chart on Global - Market size and forecast 2023-2028 ($ million)
- Exhibits17: Data Table on Global - Market size and forecast 2023-2028 ($ million)
- Exhibits18: Chart on Global Market: Year-over-year growth 2023-2028 (%)
- Exhibits19: Data Table on Global Market: Year-over-year growth 2023-2028 (%)
- Exhibits20: Historic Market Size - Data Table on Global Stainless Steel 400 Series Market 2018 - 2022 ($ million)
- Exhibits21: Historic Market Size - End-user Segment 2018 - 2022 ($ million)
- Exhibits22: Historic Market Size - Product Type Segment 2018 - 2022 ($ million)
- Exhibits23: Historic Market Size - Geography Segment 2018 - 2022 ($ million)
- Exhibits24: Historic Market Size - Country Segment 2018 - 2022 ($ million)
- Exhibits25: Five forces analysis - Comparison between 2023 and 2028
- Exhibits26: Bargaining power of buyers - Impact of key factors 2023 and 2028
- Exhibits27: Bargaining power of suppliers - Impact of key factors in 2023 and 2028
- Exhibits28: Threat of new entrants - Impact of key factors in 2023 and 2028
- Exhibits29: Threat of substitutes - Impact of key factors in 2023 and 2028
- Exhibits30: Threat of rivalry - Impact of key factors in 2023 and 2028
- Exhibits31: Chart on Market condition - Five forces 2023 and 2028
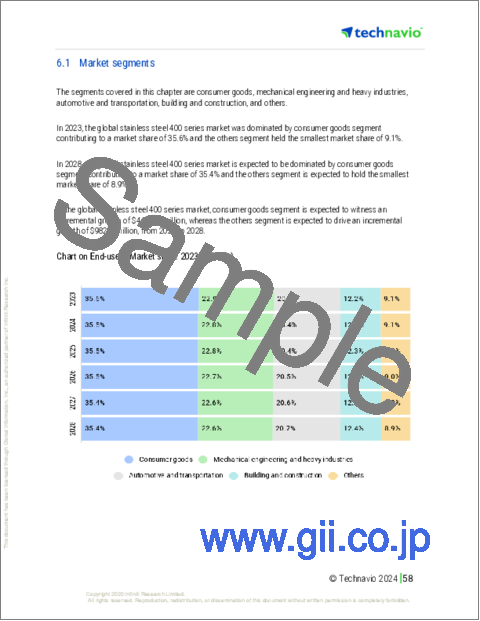
- Exhibits32: Chart on End-user - Market share 2023-2028 (%)
- Exhibits33: Data Table on End-user - Market share 2023-2028 (%)
- Exhibits34: Chart on Comparison by End-user
- Exhibits35: Data Table on Comparison by End-user
- Exhibits36: Chart on Consumer goods - Market size and forecast 2023-2028 ($ million)
- Exhibits37: Data Table on Consumer goods - Market size and forecast 2023-2028 ($ million)
- Exhibits38: Chart on Consumer goods - Year-over-year growth 2023-2028 (%)
- Exhibits39: Data Table on Consumer goods - Year-over-year growth 2023-2028 (%)
- Exhibits40: Chart on Mechanical engineering and heavy industries - Market size and forecast 2023-2028 ($ million)
- Exhibits41: Data Table on Mechanical engineering and heavy industries - Market size and forecast 2023-2028 ($ million)
- Exhibits42: Chart on Mechanical engineering and heavy industries - Year-over-year growth 2023-2028 (%)
- Exhibits43: Data Table on Mechanical engineering and heavy industries - Year-over-year growth 2023-2028 (%)
- Exhibits44: Chart on Automotive and transportation - Market size and forecast 2023-2028 ($ million)
- Exhibits45: Data Table on Automotive and transportation - Market size and forecast 2023-2028 ($ million)
- Exhibits46: Chart on Automotive and transportation - Year-over-year growth 2023-2028 (%)
- Exhibits47: Data Table on Automotive and transportation - Year-over-year growth 2023-2028 (%)
- Exhibits48: Chart on Building and construction - Market size and forecast 2023-2028 ($ million)
- Exhibits49: Data Table on Building and construction - Market size and forecast 2023-2028 ($ million)
- Exhibits50: Chart on Building and construction - Year-over-year growth 2023-2028 (%)
- Exhibits51: Data Table on Building and construction - Year-over-year growth 2023-2028 (%)
- Exhibits52: Chart on Others - Market size and forecast 2023-2028 ($ million)
- Exhibits53: Data Table on Others - Market size and forecast 2023-2028 ($ million)
- Exhibits54: Chart on Others - Year-over-year growth 2023-2028 (%)
- Exhibits55: Data Table on Others - Year-over-year growth 2023-2028 (%)
- Exhibits56: Market opportunity by End-user ($ million)
- Exhibits57: Data Table on Market opportunity by End-user ($ million)
- Exhibits58: Chart on Product Type - Market share 2023-2028 (%)
- Exhibits59: Data Table on Product Type - Market share 2023-2028 (%)
- Exhibits60: Chart on Comparison by Product Type
- Exhibits61: Data Table on Comparison by Product Type
- Exhibits62: Chart on Plate and sheet - Market size and forecast 2023-2028 ($ million)
- Exhibits63: Data Table on Plate and sheet - Market size and forecast 2023-2028 ($ million)
- Exhibits64: Chart on Plate and sheet - Year-over-year growth 2023-2028 (%)
- Exhibits65: Data Table on Plate and sheet - Year-over-year growth 2023-2028 (%)
- Exhibits66: Chart on Bar and tubular - Market size and forecast 2023-2028 ($ million)
- Exhibits67: Data Table on Bar and tubular - Market size and forecast 2023-2028 ($ million)
- Exhibits68: Chart on Bar and tubular - Year-over-year growth 2023-2028 (%)
- Exhibits69: Data Table on Bar and tubular - Year-over-year growth 2023-2028 (%)
- Exhibits70: Chart on Structural - Market size and forecast 2023-2028 ($ million)
- Exhibits71: Data Table on Structural - Market size and forecast 2023-2028 ($ million)
- Exhibits72: Chart on Structural - Year-over-year growth 2023-2028 (%)
- Exhibits73: Data Table on Structural - Year-over-year growth 2023-2028 (%)
- Exhibits74: Market opportunity by Product Type ($ million)
- Exhibits75: Data Table on Market opportunity by Product Type ($ million)
- Exhibits76: Analysis of price sensitivity, lifecycle, customer purchase basket, adoption rates, and purchase criteria
- Exhibits77: Chart on Market share By Geographical Landscape 2023-2028 (%)
- Exhibits78: Data Table on Market share By Geographical Landscape 2023-2028 (%)
- Exhibits79: Chart on Geographic comparison
- Exhibits80: Data Table on Geographic comparison
- Exhibits81: Chart on APAC - Market size and forecast 2023-2028 ($ million)
- Exhibits82: Data Table on APAC - Market size and forecast 2023-2028 ($ million)
- Exhibits83: Chart on APAC - Year-over-year growth 2023-2028 (%)
- Exhibits84: Data Table on APAC - Year-over-year growth 2023-2028 (%)
- Exhibits85: Chart on Europe - Market size and forecast 2023-2028 ($ million)
- Exhibits86: Data Table on Europe - Market size and forecast 2023-2028 ($ million)
- Exhibits87: Chart on Europe - Year-over-year growth 2023-2028 (%)
- Exhibits88: Data Table on Europe - Year-over-year growth 2023-2028 (%)
- Exhibits89: Chart on North America - Market size and forecast 2023-2028 ($ million)
- Exhibits90: Data Table on North America - Market size and forecast 2023-2028 ($ million)
- Exhibits91: Chart on North America - Year-over-year growth 2023-2028 (%)
- Exhibits92: Data Table on North America - Year-over-year growth 2023-2028 (%)
- Exhibits93: Chart on Middle East and Africa - Market size and forecast 2023-2028 ($ million)
- Exhibits94: Data Table on Middle East and Africa - Market size and forecast 2023-2028 ($ million)
- Exhibits95: Chart on Middle East and Africa - Year-over-year growth 2023-2028 (%)
- Exhibits96: Data Table on Middle East and Africa - Year-over-year growth 2023-2028 (%)
- Exhibits97: Chart on South America - Market size and forecast 2023-2028 ($ million)
- Exhibits98: Data Table on South America - Market size and forecast 2023-2028 ($ million)
- Exhibits99: Chart on South America - Year-over-year growth 2023-2028 (%)
- Exhibits100: Data Table on South America - Year-over-year growth 2023-2028 (%)
- Exhibits101: Chart on China - Market size and forecast 2023-2028 ($ million)
- Exhibits102: Data Table on China - Market size and forecast 2023-2028 ($ million)
- Exhibits103: Chart on China - Year-over-year growth 2023-2028 (%)
- Exhibits104: Data Table on China - Year-over-year growth 2023-2028 (%)
- Exhibits105: Chart on India - Market size and forecast 2023-2028 ($ million)
- Exhibits106: Data Table on India - Market size and forecast 2023-2028 ($ million)
- Exhibits107: Chart on India - Year-over-year growth 2023-2028 (%)
- Exhibits108: Data Table on India - Year-over-year growth 2023-2028 (%)
- Exhibits109: Chart on US - Market size and forecast 2023-2028 ($ million)
- Exhibits110: Data Table on US - Market size and forecast 2023-2028 ($ million)
- Exhibits111: Chart on US - Year-over-year growth 2023-2028 (%)
- Exhibits112: Data Table on US - Year-over-year growth 2023-2028 (%)
- Exhibits113: Chart on Japan - Market size and forecast 2023-2028 ($ million)
- Exhibits114: Data Table on Japan - Market size and forecast 2023-2028 ($ million)
- Exhibits115: Chart on Japan - Year-over-year growth 2023-2028 (%)
- Exhibits116: Data Table on Japan - Year-over-year growth 2023-2028 (%)
- Exhibits117: Chart on South Korea - Market size and forecast 2023-2028 ($ million)
- Exhibits118: Data Table on South Korea - Market size and forecast 2023-2028 ($ million)
- Exhibits119: Chart on South Korea - Year-over-year growth 2023-2028 (%)
- Exhibits120: Data Table on South Korea - Year-over-year growth 2023-2028 (%)
- Exhibits121: Market opportunity By Geographical Landscape ($ million)
- Exhibits122: Data Tables on Market opportunity By Geographical Landscape ($ million)
- Exhibits123: Impact of drivers and challenges in 2023 and 2028
- Exhibits124: Overview on criticality of inputs and factors of differentiation
- Exhibits125: Overview on factors of disruption
- Exhibits126: Impact of key risks on business
- Exhibits127: Companies covered
- Exhibits128: Matrix on companies position and classification
- Exhibits129: Aperam SA - Overview
- Exhibits130: Aperam SA - Business segments
- Exhibits131: Aperam SA - Key offerings
- Exhibits132: Aperam SA - Segment focus
- Exhibits133: ArcelorMittal - Overview
- Exhibits134: ArcelorMittal - Business segments
- Exhibits135: ArcelorMittal - Key news
- Exhibits136: ArcelorMittal - Key offerings
- Exhibits137: ArcelorMittal - Segment focus
- Exhibits138: Baosteel Group Corp. - Overview
- Exhibits139: Baosteel Group Corp. - Product / Service
- Exhibits140: Baosteel Group Corp. - Key offerings
- Exhibits141: Cleveland Cliffs Inc. - Overview
- Exhibits142: Cleveland Cliffs Inc. - Product / Service
- Exhibits143: Cleveland Cliffs Inc. - Key news
- Exhibits144: Cleveland Cliffs Inc. - Key offerings
- Exhibits145: E United Group - Overview
- Exhibits146: E United Group - Product / Service
- Exhibits147: E United Group - Key offerings
- Exhibits148: Helander - Overview
- Exhibits149: Helander - Product / Service
- Exhibits150: Helander - Key offerings
- Exhibits151: Hunan Fushun Metal Co. Ltd. - Overview
- Exhibits152: Hunan Fushun Metal Co. Ltd. - Product / Service
- Exhibits153: Hunan Fushun Metal Co. Ltd. - Key offerings
- Exhibits154: Jindal Stainless Ltd. - Overview
- Exhibits155: Jindal Stainless Ltd. - Product / Service
- Exhibits156: Jindal Stainless Ltd. - Key offerings
- Exhibits157: Mirach Metallurgy Co. Ltd. - Overview
- Exhibits158: Mirach Metallurgy Co. Ltd. - Product / Service
- Exhibits159: Mirach Metallurgy Co. Ltd. - Key offerings
- Exhibits160: Nippon Steel Corp. - Overview
- Exhibits161: Nippon Steel Corp. - Business segments
- Exhibits162: Nippon Steel Corp. - Key news
- Exhibits163: Nippon Steel Corp. - Key offerings
- Exhibits164: Nippon Steel Corp. - Segment focus
- Exhibits165: Outokumpu Oyj - Overview
- Exhibits166: Outokumpu Oyj - Business segments
- Exhibits167: Outokumpu Oyj - Key news
- Exhibits168: Outokumpu Oyj - Key offerings
- Exhibits169: Outokumpu Oyj - Segment focus
- Exhibits170: POSCO holdings Inc. - Overview
- Exhibits171: POSCO holdings Inc. - Product / Service
- Exhibits172: POSCO holdings Inc. - Key offerings
- Exhibits173: Tata Steel - Overview
- Exhibits174: Tata Steel - Business segments
- Exhibits175: Tata Steel - Key news
- Exhibits176: Tata Steel - Key offerings
- Exhibits177: Tata Steel - Segment focus
- Exhibits178: thyssenkrupp AG - Overview
- Exhibits179: thyssenkrupp AG - Business segments
- Exhibits180: thyssenkrupp AG - Key news
- Exhibits181: thyssenkrupp AG - Key offerings
- Exhibits182: thyssenkrupp AG - Segment focus
- Exhibits183: Tianjin Pipe International Economic and Trading Corp. - Overview
- Exhibits184: Tianjin Pipe International Economic and Trading Corp. - Product / Service
- Exhibits185: Tianjin Pipe International Economic and Trading Corp. - Key offerings
- Exhibits186: Inclusions checklist
- Exhibits187: Exclusions checklist
- Exhibits188: Currency conversion rates for US$
- Exhibits189: Research methodology
- Exhibits190: Information sources
- Exhibits191: Data validation
- Exhibits192: Validation techniques employed for market sizing
- Exhibits193: Data synthesis
- Exhibits194: 360 degree market analysis
- Exhibits195: List of abbreviations
The stainless steel 400 series market is forecasted to grow by USD 11490 mn during 2023-2028, accelerating at a CAGR of 6.67% during the forecast period. The report on the stainless steel 400 series market provides a holistic analysis, market size and forecast, trends, growth drivers, and challenges, as well as vendor analysis covering around 25 vendors.
The report offers an up-to-date analysis regarding the current market scenario, the latest trends and drivers, and the overall market environment. The market is driven by economic growth in China and India boosting demand for stainless steel 400 series, upsurge in consumption of high-strength stainless steel, and corrosion resistance and excellent mechanical properties.
Technavio's stainless steel 400 series market is segmented as below:
| Market Scope | |
|---|---|
| Base Year | 2024 |
| End Year | 2028 |
| Series Year | 2024-2028 |
| Growth Momentum | Accelerate |
| YOY 2024 | 6.19% |
| CAGR | 6.67% |
| Incremental Value | $11490mn |
By End-user
- Consumer goods
- Mechanical engineering and heavy industries
- Automotive and transportation
- Building and construction
- Others
By Product Type
- Plate and sheet
- Bar and tubular
- Structural
By Geographical Landscape
- APAC
- Europe
- North America
- Middle East and Africa
- South America
This study identifies the increased penetration of stainless steel 400 series in industrial applications as one of the prime reasons driving the stainless steel 400 series market growth during the next few years. Also, growing demand for steel and stainless steel scrap and rising construction and infrastructure projects will lead to sizable demand in the market.
The report on the stainless steel 400 series market covers the following areas:
- Stainless steel 400 series market sizing
- Stainless steel 400 series market forecast
- Stainless steel 400 series market industry analysis
The robust vendor analysis is designed to help clients improve their market position, and in line with this, this report provides a detailed analysis of several leading stainless steel 400 series market vendors that include Ambica Steels Ltd., Aperam SA, ArcelorMittal, BALLKINGS, Baosteel Group Corp., Cleveland Cliffs Inc., E United Group, Helander, Hunan Fushun Metal Co. Ltd., Jindal Stainless Ltd., Metline Industries, Mirach Metallurgy Co. Ltd., Nippon Steel Corp., Outokumpu Oyj, POSCO holdings Inc., Tata Steel, thyssenkrupp AG, Tianjin Pipe International Economic and Trading Corp., Tsingshan Holding Group Co. Ltd., and Tubacex SA. Also, the stainless steel 400 series market analysis report includes information on upcoming trends and challenges that will influence market growth. This is to help companies strategize and leverage all forthcoming growth opportunities.
The study was conducted using an objective combination of primary and secondary information including inputs from key participants in the industry. The report contains a comprehensive market and vendor landscape in addition to an analysis of the key vendors.
The publisher presents a detailed picture of the market by the way of study, synthesis, and summation of data from multiple sources by an analysis of key parameters such as profit, pricing, competition, and promotions. It presents various market facets by identifying the key industry influencers. The data presented is comprehensive, reliable, and a result of extensive research - both primary and secondary. The market research reports provide a complete competitive landscape and an in-depth vendor selection methodology and analysis using qualitative and quantitative research to forecast the accurate market growth.
Table of Contents
1 Executive Summary
- 1.1 Market overview
- Executive Summary - Chart on Market Overview
- Executive Summary - Data Table on Market Overview
- Executive Summary - Chart on Global Market Characteristics
- Executive Summary - Chart on Market By Geographical Landscape
- Executive Summary - Chart on Market Segmentation by End-user
- Executive Summary - Chart on Market Segmentation by Product Type
- Executive Summary - Chart on Incremental Growth
- Executive Summary - Data Table on Incremental Growth
- Executive Summary - Chart on Company Market Positioning
2 Market Landscape
- 2.1 Market ecosystem
- Parent Market
- Data Table on - Parent Market
- 2.2 Market characteristics
- Market characteristics analysis
- 2.3 Value chain analysis
- Value Chain Analysis
3 Market Sizing
- 3.1 Market definition
- Offerings of companies included in the market definition
- 3.2 Market segment analysis
- Market segments
- 3.3 Market size 2023
- 3.4 Market outlook: Forecast for 2023-2028
- Chart on Global - Market size and forecast 2023-2028 ($ million)
- Data Table on Global - Market size and forecast 2023-2028 ($ million)
- Chart on Global Market: Year-over-year growth 2023-2028 (%)
- Data Table on Global Market: Year-over-year growth 2023-2028 (%)
4 Historic Market Size
- 4.1 Global Stainless Steel 400 Series Market 2018 - 2022
- Historic Market Size - Data Table on Global Stainless Steel 400 Series Market 2018 - 2022 ($ million)
- 4.2 End-user segment analysis 2018 - 2022
- Historic Market Size - End-user Segment 2018 - 2022 ($ million)
- 4.3 Product Type segment analysis 2018 - 2022
- Historic Market Size - Product Type Segment 2018 - 2022 ($ million)
- 4.4 Geography segment analysis 2018 - 2022
- Historic Market Size - Geography Segment 2018 - 2022 ($ million)
- 4.5 Country segment analysis 2018 - 2022
- Historic Market Size - Country Segment 2018 - 2022 ($ million)
5 Five Forces Analysis
- 5.1 Five forces summary
- Five forces analysis - Comparison between 2023 and 2028
- 5.2 Bargaining power of buyers
- Bargaining power of buyers - Impact of key factors 2023 and 2028
- 5.3 Bargaining power of suppliers
- Bargaining power of suppliers - Impact of key factors in 2023 and 2028
- 5.4 Threat of new entrants
- Threat of new entrants - Impact of key factors in 2023 and 2028
- 5.5 Threat of substitutes
- Threat of substitutes - Impact of key factors in 2023 and 2028
- 5.6 Threat of rivalry
- Threat of rivalry - Impact of key factors in 2023 and 2028
- 5.7 Market condition
- Chart on Market condition - Five forces 2023 and 2028
6 Market Segmentation by End-user
- 6.1 Market segments
- Chart on End-user - Market share 2023-2028 (%)
- Data Table on End-user - Market share 2023-2028 (%)
- 6.2 Comparison by End-user
- Chart on Comparison by End-user
- Data Table on Comparison by End-user
- 6.3 Consumer goods - Market size and forecast 2023-2028
- Chart on Consumer goods - Market size and forecast 2023-2028 ($ million)
- Data Table on Consumer goods - Market size and forecast 2023-2028 ($ million)
- Chart on Consumer goods - Year-over-year growth 2023-2028 (%)
- Data Table on Consumer goods - Year-over-year growth 2023-2028 (%)
- 6.4 Mechanical engineering and heavy industries - Market size and forecast 2023-2028
- Chart on Mechanical engineering and heavy industries - Market size and forecast 2023-2028 ($ million)
- Data Table on Mechanical engineering and heavy industries - Market size and forecast 2023-2028 ($ million)
- Chart on Mechanical engineering and heavy industries - Year-over-year growth 2023-2028 (%)
- Data Table on Mechanical engineering and heavy industries - Year-over-year growth 2023-2028 (%)
- 6.5 Automotive and transportation - Market size and forecast 2023-2028
- Chart on Automotive and transportation - Market size and forecast 2023-2028 ($ million)
- Data Table on Automotive and transportation - Market size and forecast 2023-2028 ($ million)
- Chart on Automotive and transportation - Year-over-year growth 2023-2028 (%)
- Data Table on Automotive and transportation - Year-over-year growth 2023-2028 (%)
- 6.6 Building and construction - Market size and forecast 2023-2028
- Chart on Building and construction - Market size and forecast 2023-2028 ($ million)
- Data Table on Building and construction - Market size and forecast 2023-2028 ($ million)
- Chart on Building and construction - Year-over-year growth 2023-2028 (%)
- Data Table on Building and construction - Year-over-year growth 2023-2028 (%)
- 6.7 Others - Market size and forecast 2023-2028
- Chart on Others - Market size and forecast 2023-2028 ($ million)
- Data Table on Others - Market size and forecast 2023-2028 ($ million)
- Chart on Others - Year-over-year growth 2023-2028 (%)
- Data Table on Others - Year-over-year growth 2023-2028 (%)
- 6.8 Market opportunity by End-user
- Market opportunity by End-user ($ million)
- Data Table on Market opportunity by End-user ($ million)
7 Market Segmentation by Product Type
- 7.1 Market segments
- Chart on Product Type - Market share 2023-2028 (%)
- Data Table on Product Type - Market share 2023-2028 (%)
- 7.2 Comparison by Product Type
- Chart on Comparison by Product Type
- Data Table on Comparison by Product Type
- 7.3 Plate and sheet - Market size and forecast 2023-2028
- Chart on Plate and sheet - Market size and forecast 2023-2028 ($ million)
- Data Table on Plate and sheet - Market size and forecast 2023-2028 ($ million)
- Chart on Plate and sheet - Year-over-year growth 2023-2028 (%)
- Data Table on Plate and sheet - Year-over-year growth 2023-2028 (%)
- 7.4 Bar and tubular - Market size and forecast 2023-2028
- Chart on Bar and tubular - Market size and forecast 2023-2028 ($ million)
- Data Table on Bar and tubular - Market size and forecast 2023-2028 ($ million)
- Chart on Bar and tubular - Year-over-year growth 2023-2028 (%)
- Data Table on Bar and tubular - Year-over-year growth 2023-2028 (%)
- 7.5 Structural - Market size and forecast 2023-2028
- Chart on Structural - Market size and forecast 2023-2028 ($ million)
- Data Table on Structural - Market size and forecast 2023-2028 ($ million)
- Chart on Structural - Year-over-year growth 2023-2028 (%)
- Data Table on Structural - Year-over-year growth 2023-2028 (%)
- 7.6 Market opportunity by Product Type
- Market opportunity by Product Type ($ million)
- Data Table on Market opportunity by Product Type ($ million)
8 Customer Landscape
- 8.1 Customer landscape overview
- Analysis of price sensitivity, lifecycle, customer purchase basket, adoption rates, and purchase criteria
9 Geographic Landscape
- 9.1 Geographic segmentation
- Chart on Market share By Geographical Landscape 2023-2028 (%)
- Data Table on Market share By Geographical Landscape 2023-2028 (%)
- 9.2 Geographic comparison
- Chart on Geographic comparison
- Data Table on Geographic comparison
- 9.3 APAC - Market size and forecast 2023-2028
- Chart on APAC - Market size and forecast 2023-2028 ($ million)
- Data Table on APAC - Market size and forecast 2023-2028 ($ million)
- Chart on APAC - Year-over-year growth 2023-2028 (%)
- Data Table on APAC - Year-over-year growth 2023-2028 (%)
- 9.4 Europe - Market size and forecast 2023-2028
- Chart on Europe - Market size and forecast 2023-2028 ($ million)
- Data Table on Europe - Market size and forecast 2023-2028 ($ million)
- Chart on Europe - Year-over-year growth 2023-2028 (%)
- Data Table on Europe - Year-over-year growth 2023-2028 (%)
- 9.5 North America - Market size and forecast 2023-2028
- Chart on North America - Market size and forecast 2023-2028 ($ million)
- Data Table on North America - Market size and forecast 2023-2028 ($ million)
- Chart on North America - Year-over-year growth 2023-2028 (%)
- Data Table on North America - Year-over-year growth 2023-2028 (%)
- 9.6 Middle East and Africa - Market size and forecast 2023-2028
- Chart on Middle East and Africa - Market size and forecast 2023-2028 ($ million)
- Data Table on Middle East and Africa - Market size and forecast 2023-2028 ($ million)
- Chart on Middle East and Africa - Year-over-year growth 2023-2028 (%)
- Data Table on Middle East and Africa - Year-over-year growth 2023-2028 (%)
- 9.7 South America - Market size and forecast 2023-2028
- Chart on South America - Market size and forecast 2023-2028 ($ million)
- Data Table on South America - Market size and forecast 2023-2028 ($ million)
- Chart on South America - Year-over-year growth 2023-2028 (%)
- Data Table on South America - Year-over-year growth 2023-2028 (%)
- 9.8 China - Market size and forecast 2023-2028
- Chart on China - Market size and forecast 2023-2028 ($ million)
- Data Table on China - Market size and forecast 2023-2028 ($ million)
- Chart on China - Year-over-year growth 2023-2028 (%)
- Data Table on China - Year-over-year growth 2023-2028 (%)
- 9.9 India - Market size and forecast 2023-2028
- Chart on India - Market size and forecast 2023-2028 ($ million)
- Data Table on India - Market size and forecast 2023-2028 ($ million)
- Chart on India - Year-over-year growth 2023-2028 (%)
- Data Table on India - Year-over-year growth 2023-2028 (%)
- 9.10 US - Market size and forecast 2023-2028
- Chart on US - Market size and forecast 2023-2028 ($ million)
- Data Table on US - Market size and forecast 2023-2028 ($ million)
- Chart on US - Year-over-year growth 2023-2028 (%)
- Data Table on US - Year-over-year growth 2023-2028 (%)
- 9.11 Japan - Market size and forecast 2023-2028
- Chart on Japan - Market size and forecast 2023-2028 ($ million)
- Data Table on Japan - Market size and forecast 2023-2028 ($ million)
- Chart on Japan - Year-over-year growth 2023-2028 (%)
- Data Table on Japan - Year-over-year growth 2023-2028 (%)
- 9.12 South Korea - Market size and forecast 2023-2028
- Chart on South Korea - Market size and forecast 2023-2028 ($ million)
- Data Table on South Korea - Market size and forecast 2023-2028 ($ million)
- Chart on South Korea - Year-over-year growth 2023-2028 (%)
- Data Table on South Korea - Year-over-year growth 2023-2028 (%)
- 9.13 Market opportunity By Geographical Landscape
- Market opportunity By Geographical Landscape ($ million)
- Data Tables on Market opportunity By Geographical Landscape ($ million)
10 Drivers, Challenges, and Opportunity/Restraints
- 10.1 Market drivers
- 10.2 Market challenges
- 10.3 Impact of drivers and challenges
- Impact of drivers and challenges in 2023 and 2028
- 10.4 Market opportunities/restraints
11 Competitive Landscape
- 11.1 Overview
- 11.2 Competitive Landscape
- Overview on criticality of inputs and factors of differentiation
- 11.3 Landscape disruption
- Overview on factors of disruption
- 11.4 Industry risks
- Impact of key risks on business
12 Competitive Analysis
- 12.1 Companies profiled
- Companies covered
- 12.2 Market positioning of companies
- Matrix on companies position and classification
- 12.3 Aperam SA
- Aperam SA - Overview
- Aperam SA - Business segments
- Aperam SA - Key offerings
- Aperam SA - Segment focus
- 12.4 ArcelorMittal
- ArcelorMittal - Overview
- ArcelorMittal - Business segments
- ArcelorMittal - Key news
- ArcelorMittal - Key offerings
- ArcelorMittal - Segment focus
- 12.5 Baosteel Group Corp.
- Baosteel Group Corp. - Overview
- Baosteel Group Corp. - Product / Service
- Baosteel Group Corp. - Key offerings
- 12.6 Cleveland Cliffs Inc.
- Cleveland Cliffs Inc. - Overview
- Cleveland Cliffs Inc. - Product / Service
- Cleveland Cliffs Inc. - Key news
- Cleveland Cliffs Inc. - Key offerings
- 12.7 E United Group
- E United Group - Overview
- E United Group - Product / Service
- E United Group - Key offerings
- 12.8 Helander
- Helander - Overview
- Helander - Product / Service
- Helander - Key offerings
- 12.9 Hunan Fushun Metal Co. Ltd.
- Hunan Fushun Metal Co. Ltd. - Overview
- Hunan Fushun Metal Co. Ltd. - Product / Service
- Hunan Fushun Metal Co. Ltd. - Key offerings
- 12.10 Jindal Stainless Ltd.
- Jindal Stainless Ltd. - Overview
- Jindal Stainless Ltd. - Product / Service
- Jindal Stainless Ltd. - Key offerings
- 12.11 Mirach Metallurgy Co. Ltd.
- Mirach Metallurgy Co. Ltd. - Overview
- Mirach Metallurgy Co. Ltd. - Product / Service
- Mirach Metallurgy Co. Ltd. - Key offerings
- 12.12 Nippon Steel Corp.
- Nippon Steel Corp. - Overview
- Nippon Steel Corp. - Business segments
- Nippon Steel Corp. - Key news
- Nippon Steel Corp. - Key offerings
- Nippon Steel Corp. - Segment focus
- 12.13 Outokumpu Oyj
- Outokumpu Oyj - Overview
- Outokumpu Oyj - Business segments
- Outokumpu Oyj - Key news
- Outokumpu Oyj - Key offerings
- Outokumpu Oyj - Segment focus
- 12.14 POSCO holdings Inc.
- POSCO holdings Inc. - Overview
- POSCO holdings Inc. - Product / Service
- POSCO holdings Inc. - Key offerings
- 12.15 Tata Steel
- Tata Steel - Overview
- Tata Steel - Business segments
- Tata Steel - Key news
- Tata Steel - Key offerings
- Tata Steel - Segment focus
- 12.16 thyssenkrupp AG
- thyssenkrupp AG - Overview
- thyssenkrupp AG - Business segments
- thyssenkrupp AG - Key news
- thyssenkrupp AG - Key offerings
- thyssenkrupp AG - Segment focus
- 12.17 Tianjin Pipe International Economic and Trading Corp.
- Tianjin Pipe International Economic and Trading Corp. - Overview
- Tianjin Pipe International Economic and Trading Corp. - Product / Service
- Tianjin Pipe International Economic and Trading Corp. - Key offerings
13 Appendix
- 13.1 Scope of the report
- 13.2 Inclusions and exclusions checklist
- Inclusions checklist
- Exclusions checklist
- 13.3 Currency conversion rates for US$
- Currency conversion rates for US$
- 13.4 Research methodology
- Research methodology
- 13.5 Data procurement
- Information sources
- 13.6 Data validation
- Data validation
- 13.7 Validation techniques employed for market sizing
- Validation techniques employed for market sizing
- 13.8 Data synthesis
- Data synthesis
- 13.9 360 degree market analysis
- 360 degree market analysis
- 13.10 List of abbreviations
- List of abbreviations

