|
|
市場調査レポート
商品コード
1524931
皮膚科診断機器の世界市場 2024-2028Global dermatology diagnostic devices market 2024-2028 |
||||||
|
|||||||
カスタマイズ可能
|
|||||||

| 皮膚科診断機器の世界市場 2024-2028 |
|
出版日: 2024年07月12日
発行: TechNavio
ページ情報: 英文 176 Pages
納期: 即納可能
|

全表示
- 概要
- 図表
- 目次
皮膚科診断機器市場は2023-2028年に108億6,740万米ドル、予測期間中のCAGRは10.87%で成長すると予測されます。
当レポートでは、皮膚科診断機器市場の全体的な分析、市場規模・予測、動向、成長促進要因、課題、約25のベンダーを網羅したベンダー分析などを掲載しています。
現在の市場シナリオ、最新動向と促進要因、市場環境全体に関する最新分析を提供しています。同市場は、メラノーマや自己免疫性皮膚疾患の有病率の増加、皮膚の若返りやその他の美容治療に対する意識の高まり、高度な皮膚科診断サービスに対する需要の高まりによって牽引されています。
| 市場範囲 | |
|---|---|
| 基準年 | 2024 |
| 終了年 | 2028 |
| 予測期間 | 2024-2028 |
| 成長モメンタム | 加速 |
| 前年比2024年 | 9.53% |
| CAGR | 10.87% |
| 増分額 | 108億6,740万米ドル |
本調査では、今後数年間の皮膚科診断機器市場成長を牽引する主要因の1つとして、モバイルアプリケーションにおける遠隔皮膚科の出現を挙げています。また、分子診断が皮膚科診断に新たな機会を創出し、3Dイメージング技術の出現が市場の大きな需要につながるとしています。
目次
第1章 エグゼクティブサマリー
- 市場概要
第2章 市場情勢
- 市場エコシステム
- 市場の特徴
- バリューチェーン分析
第3章 市場規模の評価
- 市場の定義
- 市場セグメント分析
- 市場規模 2023
- 市場の見通し 2023-2028
第4章 市場規模実績
- 世界皮膚科診断機器市場 2018-2022
- エンドユーザー別セグメント分析 2018-2022
- タイプ別セグメント分析 2018-2022
- 地域別セグメント分析 2018-2022
- 国別セグメント分析 2018-2022
第5章 ファイブフォース分析
- ファイブフォースの要約
- 買い手の交渉力
- 供給企業の交渉力
- 新規参入業者の脅威
- 代替品の脅威
- 競争の脅威
- 市況
第6章 市場セグメンテーション:エンドユーザー別
- 市場セグメンテーション
- 比較:エンドユーザー別
- 病院:市場規模と予測 2023-2028
- クリニック:市場規模と予測 2023-2028
- 診断ラボ:市場規模と予測 2023-2028
- 市場機会:エンドユーザー別
第7章 市場セグメンテーション:タイプ別
- 市場セグメンテーション
- 比較:タイプ別
- 画像装置:市場規模と予測 2023-2028
- 顕微鏡:市場規模と予測 2023-2028
- 免疫学的検査:市場規模と予測 2023-2028
- 分子診断:市場規模と予測 2023-2028
- その他:市場規模と予測 2023-2028
- 市場機会:タイプ別
第8章 顧客情勢
- 顧客情勢の概要
第9章 地域別情勢
- 地域別セグメンテーション
- 地域別比較
- 北米:市場規模と予測 2023-2028
- 欧州:市場規模と予測 2023-2028
- アジア:市場規模と予測 2023-2028
- 世界のその他の地域:市場規模と予測 2023-2028
- 米国:市場規模と予測 2023-2028
- 中国:市場規模と予測 2023-2028
- 英国:市場規模と予測 2023-2028
- ドイツ:市場規模と予測 2023-2028
- 日本:市場規模と予測 2023-2028
- 市場機会:地域情勢別
第10章 促進要因・課題・機会・抑制要因
- 市場促進要因
- 市場の課題
- 促進要因と課題の影響
- 市場の機会・抑制要因
第11章 競合情勢
- 概要
- 競合情勢
- 混乱の状況
- 業界のリスク
第12章 競合分析
- 企業プロファイル
- 企業の市場ポジショニング
- Agfa Gevaert NV
- Baxter International Inc.
- Bayer AG
- Caliber Imaging and Diagnostics Inc
- Canfield Scientific Inc.
- F. Hoffmann La Roche Ltd.
- Firefly Global
- FotoFinder Systems GmbH
- General Electric Co.
- HEINE Optotechnik GmbH and Co. KG
- Keyence Corp.
- KIRCHNER and WILHELM plus GmbH Co. KG
- Michelson Diagnostics Inc.
- Microcurrent Technology Inc.
- Strata Skin Sciences Inc
第13章 付録
Exhibits:
- Exhibits1: Executive Summary - Chart on Market Overview
- Exhibits2: Executive Summary - Data Table on Market Overview
- Exhibits3: Executive Summary - Chart on Global Market Characteristics
- Exhibits4: Executive Summary - Chart on Market By Geographical Landscape
- Exhibits5: Executive Summary - Chart on Market Segmentation by End-user
- Exhibits6: Executive Summary - Chart on Market Segmentation by Type
- Exhibits7: Executive Summary - Chart on Incremental Growth
- Exhibits8: Executive Summary - Data Table on Incremental Growth
- Exhibits9: Executive Summary - Chart on Company Market Positioning
- Exhibits10: Parent Market
- Exhibits11: Data Table on - Parent Market
- Exhibits12: Market characteristics analysis
- Exhibits13: Value Chain Analysis
- Exhibits14: Offerings of companies included in the market definition
- Exhibits15: Market segments
- Exhibits16: Chart on Global - Market size and forecast 2023-2028 ($ million)
- Exhibits17: Data Table on Global - Market size and forecast 2023-2028 ($ million)
- Exhibits18: Chart on Global Market: Year-over-year growth 2023-2028 (%)
- Exhibits19: Data Table on Global Market: Year-over-year growth 2023-2028 (%)
- Exhibits20: Historic Market Size - Data Table on Global Dermatology Diagnostic Devices Market 2018 - 2022 ($ million)
- Exhibits21: Historic Market Size - End-user Segment 2018 - 2022 ($ million)
- Exhibits22: Historic Market Size - Type Segment 2018 - 2022 ($ million)
- Exhibits23: Historic Market Size - Geography Segment 2018 - 2022 ($ million)
- Exhibits24: Historic Market Size - Country Segment 2018 - 2022 ($ million)
- Exhibits25: Five forces analysis - Comparison between 2023 and 2028
- Exhibits26: Bargaining power of buyers - Impact of key factors 2023 and 2028
- Exhibits27: Bargaining power of suppliers - Impact of key factors in 2023 and 2028
- Exhibits28: Threat of new entrants - Impact of key factors in 2023 and 2028
- Exhibits29: Threat of substitutes - Impact of key factors in 2023 and 2028
- Exhibits30: Threat of rivalry - Impact of key factors in 2023 and 2028
- Exhibits31: Chart on Market condition - Five forces 2023 and 2028
- Exhibits32: Chart on End-user - Market share 2023-2028 (%)
- Exhibits33: Data Table on End-user - Market share 2023-2028 (%)
- Exhibits34: Chart on Comparison by End-user
- Exhibits35: Data Table on Comparison by End-user
- Exhibits36: Chart on Hospitals - Market size and forecast 2023-2028 ($ million)
- Exhibits37: Data Table on Hospitals - Market size and forecast 2023-2028 ($ million)
- Exhibits38: Chart on Hospitals - Year-over-year growth 2023-2028 (%)
- Exhibits39: Data Table on Hospitals - Year-over-year growth 2023-2028 (%)
- Exhibits40: Chart on Clinics - Market size and forecast 2023-2028 ($ million)
- Exhibits41: Data Table on Clinics - Market size and forecast 2023-2028 ($ million)
- Exhibits42: Chart on Clinics - Year-over-year growth 2023-2028 (%)
- Exhibits43: Data Table on Clinics - Year-over-year growth 2023-2028 (%)
- Exhibits44: Chart on Diagnostic labs - Market size and forecast 2023-2028 ($ million)
- Exhibits45: Data Table on Diagnostic labs - Market size and forecast 2023-2028 ($ million)
- Exhibits46: Chart on Diagnostic labs - Year-over-year growth 2023-2028 (%)
- Exhibits47: Data Table on Diagnostic labs - Year-over-year growth 2023-2028 (%)
- Exhibits48: Market opportunity by End-user ($ million)
- Exhibits49: Data Table on Market opportunity by End-user ($ million)
- Exhibits50: Chart on Type - Market share 2023-2028 (%)
- Exhibits51: Data Table on Type - Market share 2023-2028 (%)
- Exhibits52: Chart on Comparison by Type
- Exhibits53: Data Table on Comparison by Type
- Exhibits54: Chart on Imaging devices - Market size and forecast 2023-2028 ($ million)
- Exhibits55: Data Table on Imaging devices - Market size and forecast 2023-2028 ($ million)
- Exhibits56: Chart on Imaging devices - Year-over-year growth 2023-2028 (%)
- Exhibits57: Data Table on Imaging devices - Year-over-year growth 2023-2028 (%)
- Exhibits58: Chart on Microscopes - Market size and forecast 2023-2028 ($ million)
- Exhibits59: Data Table on Microscopes - Market size and forecast 2023-2028 ($ million)
- Exhibits60: Chart on Microscopes - Year-over-year growth 2023-2028 (%)
- Exhibits61: Data Table on Microscopes - Year-over-year growth 2023-2028 (%)
- Exhibits62: Chart on Immunoassays - Market size and forecast 2023-2028 ($ million)
- Exhibits63: Data Table on Immunoassays - Market size and forecast 2023-2028 ($ million)
- Exhibits64: Chart on Immunoassays - Year-over-year growth 2023-2028 (%)
- Exhibits65: Data Table on Immunoassays - Year-over-year growth 2023-2028 (%)
- Exhibits66: Chart on Molecular diagnostics - Market size and forecast 2023-2028 ($ million)
- Exhibits67: Data Table on Molecular diagnostics - Market size and forecast 2023-2028 ($ million)
- Exhibits68: Chart on Molecular diagnostics - Year-over-year growth 2023-2028 (%)
- Exhibits69: Data Table on Molecular diagnostics - Year-over-year growth 2023-2028 (%)
- Exhibits70: Chart on Others - Market size and forecast 2023-2028 ($ million)
- Exhibits71: Data Table on Others - Market size and forecast 2023-2028 ($ million)
- Exhibits72: Chart on Others - Year-over-year growth 2023-2028 (%)
- Exhibits73: Data Table on Others - Year-over-year growth 2023-2028 (%)
- Exhibits74: Market opportunity by Type ($ million)
- Exhibits75: Data Table on Market opportunity by Type ($ million)
- Exhibits76: Analysis of price sensitivity, lifecycle, customer purchase basket, adoption rates, and purchase criteria
- Exhibits77: Chart on Market share By Geographical Landscape 2023-2028 (%)
- Exhibits78: Data Table on Market share By Geographical Landscape 2023-2028 (%)
- Exhibits79: Chart on Geographic comparison
- Exhibits80: Data Table on Geographic comparison
- Exhibits81: Chart on North America - Market size and forecast 2023-2028 ($ million)
- Exhibits82: Data Table on North America - Market size and forecast 2023-2028 ($ million)
- Exhibits83: Chart on North America - Year-over-year growth 2023-2028 (%)
- Exhibits84: Data Table on North America - Year-over-year growth 2023-2028 (%)
- Exhibits85: Chart on Europe - Market size and forecast 2023-2028 ($ million)
- Exhibits86: Data Table on Europe - Market size and forecast 2023-2028 ($ million)
- Exhibits87: Chart on Europe - Year-over-year growth 2023-2028 (%)
- Exhibits88: Data Table on Europe - Year-over-year growth 2023-2028 (%)
- Exhibits89: Chart on Asia - Market size and forecast 2023-2028 ($ million)
- Exhibits90: Data Table on Asia - Market size and forecast 2023-2028 ($ million)
- Exhibits91: Chart on Asia - Year-over-year growth 2023-2028 (%)
- Exhibits92: Data Table on Asia - Year-over-year growth 2023-2028 (%)
- Exhibits93: Chart on Rest of World (ROW) - Market size and forecast 2023-2028 ($ million)
- Exhibits94: Data Table on Rest of World (ROW) - Market size and forecast 2023-2028 ($ million)
- Exhibits95: Chart on Rest of World (ROW) - Year-over-year growth 2023-2028 (%)
- Exhibits96: Data Table on Rest of World (ROW) - Year-over-year growth 2023-2028 (%)
- Exhibits97: Chart on US - Market size and forecast 2023-2028 ($ million)
- Exhibits98: Data Table on US - Market size and forecast 2023-2028 ($ million)
- Exhibits99: Chart on US - Year-over-year growth 2023-2028 (%)
- Exhibits100: Data Table on US - Year-over-year growth 2023-2028 (%)
- Exhibits101: Chart on China - Market size and forecast 2023-2028 ($ million)
- Exhibits102: Data Table on China - Market size and forecast 2023-2028 ($ million)
- Exhibits103: Chart on China - Year-over-year growth 2023-2028 (%)
- Exhibits104: Data Table on China - Year-over-year growth 2023-2028 (%)
- Exhibits105: Chart on UK - Market size and forecast 2023-2028 ($ million)
- Exhibits106: Data Table on UK - Market size and forecast 2023-2028 ($ million)
- Exhibits107: Chart on UK - Year-over-year growth 2023-2028 (%)
- Exhibits108: Data Table on UK - Year-over-year growth 2023-2028 (%)
- Exhibits109: Chart on Germany - Market size and forecast 2023-2028 ($ million)
- Exhibits110: Data Table on Germany - Market size and forecast 2023-2028 ($ million)
- Exhibits111: Chart on Germany - Year-over-year growth 2023-2028 (%)
- Exhibits112: Data Table on Germany - Year-over-year growth 2023-2028 (%)
- Exhibits113: Chart on Japan - Market size and forecast 2023-2028 ($ million)
- Exhibits114: Data Table on Japan - Market size and forecast 2023-2028 ($ million)
- Exhibits115: Chart on Japan - Year-over-year growth 2023-2028 (%)
- Exhibits116: Data Table on Japan - Year-over-year growth 2023-2028 (%)
- Exhibits117: Market opportunity By Geographical Landscape ($ million)
- Exhibits118: Data Tables on Market opportunity By Geographical Landscape ($ million)
- Exhibits119: Impact of drivers and challenges in 2023 and 2028
- Exhibits120: Overview on criticality of inputs and factors of differentiation
- Exhibits121: Overview on factors of disruption
- Exhibits122: Impact of key risks on business
- Exhibits123: Companies covered
- Exhibits124: Matrix on companies position and classification
- Exhibits125: Agfa Gevaert NV - Overview
- Exhibits126: Agfa Gevaert NV - Business segments
- Exhibits127: Agfa Gevaert NV - Key news
- Exhibits128: Agfa Gevaert NV - Key offerings
- Exhibits129: Agfa Gevaert NV - Segment focus
- Exhibits130: Baxter International Inc. - Overview
- Exhibits131: Baxter International Inc. - Business segments
- Exhibits132: Baxter International Inc. - Key news
- Exhibits133: Baxter International Inc. - Key offerings
- Exhibits134: Baxter International Inc. - Segment focus
- Exhibits135: Bayer AG - Overview
- Exhibits136: Bayer AG - Business segments
- Exhibits137: Bayer AG - Key news
- Exhibits138: Bayer AG - Key offerings
- Exhibits139: Bayer AG - Segment focus
- Exhibits140: Caliber Imaging and Diagnostics Inc - Overview
- Exhibits141: Caliber Imaging and Diagnostics Inc - Product / Service
- Exhibits142: Caliber Imaging and Diagnostics Inc - Key offerings
- Exhibits143: Canfield Scientific Inc. - Overview
- Exhibits144: Canfield Scientific Inc. - Product / Service
- Exhibits145: Canfield Scientific Inc. - Key offerings
- Exhibits146: F. Hoffmann La Roche Ltd. - Overview
- Exhibits147: F. Hoffmann La Roche Ltd. - Business segments
- Exhibits148: F. Hoffmann La Roche Ltd. - Key news
- Exhibits149: F. Hoffmann La Roche Ltd. - Key offerings
- Exhibits150: F. Hoffmann La Roche Ltd. - Segment focus
- Exhibits151: Firefly Global - Overview
- Exhibits152: Firefly Global - Product / Service
- Exhibits153: Firefly Global - Key offerings
- Exhibits154: FotoFinder Systems GmbH - Overview
- Exhibits155: FotoFinder Systems GmbH - Product / Service
- Exhibits156: FotoFinder Systems GmbH - Key offerings
- Exhibits157: General Electric Co. - Overview
- Exhibits158: General Electric Co. - Business segments
- Exhibits159: General Electric Co. - Key news
- Exhibits160: General Electric Co. - Key offerings
- Exhibits161: General Electric Co. - Segment focus
- Exhibits162: HEINE Optotechnik GmbH and Co. KG - Overview
- Exhibits163: HEINE Optotechnik GmbH and Co. KG - Product / Service
- Exhibits164: HEINE Optotechnik GmbH and Co. KG - Key offerings
- Exhibits165: Keyence Corp. - Overview
- Exhibits166: Keyence Corp. - Product / Service
- Exhibits167: Keyence Corp. - Key offerings
- Exhibits168: KIRCHNER and WILHELM plus GmbH Co. KG - Overview
- Exhibits169: KIRCHNER and WILHELM plus GmbH Co. KG - Product / Service
- Exhibits170: KIRCHNER and WILHELM plus GmbH Co. KG - Key offerings
- Exhibits171: Michelson Diagnostics Inc. - Overview
- Exhibits172: Michelson Diagnostics Inc. - Product / Service
- Exhibits173: Michelson Diagnostics Inc. - Key offerings
- Exhibits174: Microcurrent Technology Inc. - Overview
- Exhibits175: Microcurrent Technology Inc. - Product / Service
- Exhibits176: Microcurrent Technology Inc. - Key offerings
- Exhibits177: Strata Skin Sciences Inc - Overview
- Exhibits178: Strata Skin Sciences Inc - Business segments
- Exhibits179: Strata Skin Sciences Inc - Key offerings
- Exhibits180: Strata Skin Sciences Inc - Segment focus
- Exhibits181: Inclusions checklist
- Exhibits182: Exclusions checklist
- Exhibits183: Currency conversion rates for US$
- Exhibits184: Research methodology
- Exhibits185: Information sources
- Exhibits186: Data validation
- Exhibits187: Validation techniques employed for market sizing
- Exhibits188: Data synthesis
- Exhibits189: 360 degree market analysis
- Exhibits190: List of abbreviations
The dermatology diagnostic devices market is forecasted to grow by USD 10867.4 mn during 2023-2028, accelerating at a CAGR of 10.87% during the forecast period. The report on the dermatology diagnostic devices market provides a holistic analysis, market size and forecast, trends, growth drivers, and challenges, as well as vendor analysis covering around 25 vendors.
The report offers an up-to-date analysis regarding the current market scenario, the latest trends and drivers, and the overall market environment. The market is driven by increasing prevalence of melanoma and autoimmune skin diseases, growing awareness about skin rejuvenation and other cosmetic treatments, and increasing demand for advanced dermatology diagnostic services.
Technavio's dermatology diagnostic devices market is segmented as below:
| Market Scope | |
|---|---|
| Base Year | 2024 |
| End Year | 2028 |
| Series Year | 2024-2028 |
| Growth Momentum | Accelerate |
| YOY 2024 | 9.53% |
| CAGR | 10.87% |
| Incremental Value | $10867.4mn |
By End-user
- Hospitals
- Clinics
- Diagnostic labs
By Type
- Imaging devices
- Microscopes
- Immunoassays
- Molecular diagnostics
- Others
By Geographical Landscape
- North America
- Europe
- Asia
- Rest of World (ROW)
This study identifies the emergence of tele dermatology in mobile applications as one of the prime reasons driving the dermatology diagnostic devices market growth during the next few years. Also, molecular diagnostics creating new opportunities in dermatology diagnosis and emergence of 3D imaging technology will lead to sizable demand in the market.
The report on the dermatology diagnostic devices market covers the following areas:
- Dermatology diagnostic devices market sizing
- Dermatology diagnostic devices market forecast
- Dermatology diagnostic devices market industry analysis
The robust vendor analysis is designed to help clients improve their market position, and in line with this, this report provides a detailed analysis of several leading dermatology diagnostic devices market vendors that include Abbott Laboratories, Agfa Gevaert NV, AnMo Electronics Corp., Baxter International Inc., Bayer AG, Bomtech Electronics Co. Ltd., Bruker Corp., Caliber Imaging and Diagnostics Inc, Canfield Scientific Inc., Danaher Corp., F. Hoffmann La Roche Ltd., Firefly Global, FotoFinder Systems GmbH, General Electric Co., HEINE Optotechnik GmbH and Co. KG, Keyence Corp., KIRCHNER and WILHELM plus GmbH Co. KG, Michelson Diagnostics Inc., Microcurrent Technology Inc., and Strata Skin Sciences Inc. Also, the dermatology diagnostic devices market analysis report includes information on upcoming trends and challenges that will influence market growth. This is to help companies strategize and leverage all forthcoming growth opportunities.
The study was conducted using an objective combination of primary and secondary information including inputs from key participants in the industry. The report contains a comprehensive market and vendor landscape in addition to an analysis of the key vendors.
The publisher presents a detailed picture of the market by the way of study, synthesis, and summation of data from multiple sources by an analysis of key parameters such as profit, pricing, competition, and promotions. It presents various market facets by identifying the key industry influencers. The data presented is comprehensive, reliable, and a result of extensive research - both primary and secondary. The market research reports provide a complete competitive landscape and an in-depth vendor selection methodology and analysis using qualitative and quantitative research to forecast the accurate market growth.
Table of Contents
1 Executive Summary
- 1.1 Market overview
- Executive Summary - Chart on Market Overview
- Executive Summary - Data Table on Market Overview
- Executive Summary - Chart on Global Market Characteristics
- Executive Summary - Chart on Market By Geographical Landscape
- Executive Summary - Chart on Market Segmentation by End-user
- Executive Summary - Chart on Market Segmentation by Type
- Executive Summary - Chart on Incremental Growth
- Executive Summary - Data Table on Incremental Growth
- Executive Summary - Chart on Company Market Positioning
2 Market Landscape
- 2.1 Market ecosystem
- Parent Market
- Data Table on - Parent Market
- 2.2 Market characteristics
- Market characteristics analysis
- 2.3 Value chain analysis
- Value Chain Analysis
3 Market Sizing
- 3.1 Market definition
- Offerings of companies included in the market definition
- 3.2 Market segment analysis
- Market segments
- 3.3 Market size 2023
- 3.4 Market outlook: Forecast for 2023-2028
- Chart on Global - Market size and forecast 2023-2028 ($ million)
- Data Table on Global - Market size and forecast 2023-2028 ($ million)
- Chart on Global Market: Year-over-year growth 2023-2028 (%)
- Data Table on Global Market: Year-over-year growth 2023-2028 (%)
4 Historic Market Size
- 4.1 Global Dermatology Diagnostic Devices Market 2018 - 2022
- Historic Market Size - Data Table on Global Dermatology Diagnostic Devices Market 2018 - 2022 ($ million)
- 4.2 End-user segment analysis 2018 - 2022
- Historic Market Size - End-user Segment 2018 - 2022 ($ million)
- 4.3 Type segment analysis 2018 - 2022
- Historic Market Size - Type Segment 2018 - 2022 ($ million)
- 4.4 Geography segment analysis 2018 - 2022
- Historic Market Size - Geography Segment 2018 - 2022 ($ million)
- 4.5 Country segment analysis 2018 - 2022
- Historic Market Size - Country Segment 2018 - 2022 ($ million)
5 Five Forces Analysis
- 5.1 Five forces summary
- Five forces analysis - Comparison between 2023 and 2028
- 5.2 Bargaining power of buyers
- Bargaining power of buyers - Impact of key factors 2023 and 2028
- 5.3 Bargaining power of suppliers
- Bargaining power of suppliers - Impact of key factors in 2023 and 2028
- 5.4 Threat of new entrants
- Threat of new entrants - Impact of key factors in 2023 and 2028
- 5.5 Threat of substitutes
- Threat of substitutes - Impact of key factors in 2023 and 2028
- 5.6 Threat of rivalry
- Threat of rivalry - Impact of key factors in 2023 and 2028
- 5.7 Market condition
- Chart on Market condition - Five forces 2023 and 2028
6 Market Segmentation by End-user
- 6.1 Market segments
- Chart on End-user - Market share 2023-2028 (%)
- Data Table on End-user - Market share 2023-2028 (%)
- 6.2 Comparison by End-user
- Chart on Comparison by End-user
- Data Table on Comparison by End-user
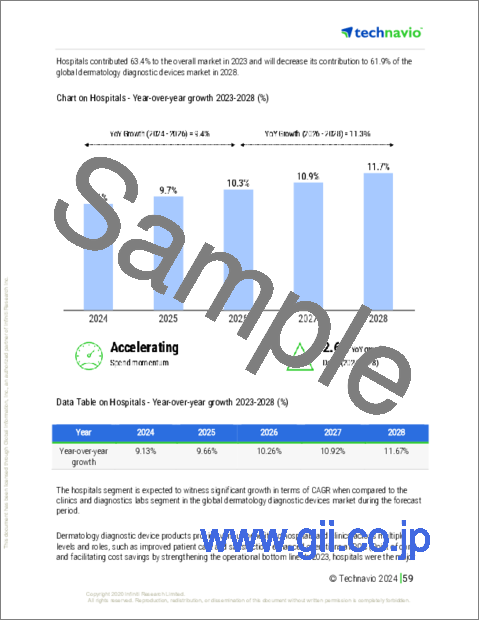
- 6.3 Hospitals - Market size and forecast 2023-2028
- Chart on Hospitals - Market size and forecast 2023-2028 ($ million)
- Data Table on Hospitals - Market size and forecast 2023-2028 ($ million)
- Chart on Hospitals - Year-over-year growth 2023-2028 (%)
- Data Table on Hospitals - Year-over-year growth 2023-2028 (%)
- 6.4 Clinics - Market size and forecast 2023-2028
- Chart on Clinics - Market size and forecast 2023-2028 ($ million)
- Data Table on Clinics - Market size and forecast 2023-2028 ($ million)
- Chart on Clinics - Year-over-year growth 2023-2028 (%)
- Data Table on Clinics - Year-over-year growth 2023-2028 (%)
- 6.5 Diagnostic labs - Market size and forecast 2023-2028
- Chart on Diagnostic labs - Market size and forecast 2023-2028 ($ million)
- Data Table on Diagnostic labs - Market size and forecast 2023-2028 ($ million)
- Chart on Diagnostic labs - Year-over-year growth 2023-2028 (%)
- Data Table on Diagnostic labs - Year-over-year growth 2023-2028 (%)
- 6.6 Market opportunity by End-user
- Market opportunity by End-user ($ million)
- Data Table on Market opportunity by End-user ($ million)
7 Market Segmentation by Type
- 7.1 Market segments
- Chart on Type - Market share 2023-2028 (%)
- Data Table on Type - Market share 2023-2028 (%)
- 7.2 Comparison by Type
- Chart on Comparison by Type
- Data Table on Comparison by Type
- 7.3 Imaging devices - Market size and forecast 2023-2028
- Chart on Imaging devices - Market size and forecast 2023-2028 ($ million)
- Data Table on Imaging devices - Market size and forecast 2023-2028 ($ million)
- Chart on Imaging devices - Year-over-year growth 2023-2028 (%)
- Data Table on Imaging devices - Year-over-year growth 2023-2028 (%)
- 7.4 Microscopes - Market size and forecast 2023-2028
- Chart on Microscopes - Market size and forecast 2023-2028 ($ million)
- Data Table on Microscopes - Market size and forecast 2023-2028 ($ million)
- Chart on Microscopes - Year-over-year growth 2023-2028 (%)
- Data Table on Microscopes - Year-over-year growth 2023-2028 (%)
- 7.5 Immunoassays - Market size and forecast 2023-2028
- Chart on Immunoassays - Market size and forecast 2023-2028 ($ million)
- Data Table on Immunoassays - Market size and forecast 2023-2028 ($ million)
- Chart on Immunoassays - Year-over-year growth 2023-2028 (%)
- Data Table on Immunoassays - Year-over-year growth 2023-2028 (%)
- 7.6 Molecular diagnostics - Market size and forecast 2023-2028
- Chart on Molecular diagnostics - Market size and forecast 2023-2028 ($ million)
- Data Table on Molecular diagnostics - Market size and forecast 2023-2028 ($ million)
- Chart on Molecular diagnostics - Year-over-year growth 2023-2028 (%)
- Data Table on Molecular diagnostics - Year-over-year growth 2023-2028 (%)
- 7.7 Others - Market size and forecast 2023-2028
- Chart on Others - Market size and forecast 2023-2028 ($ million)
- Data Table on Others - Market size and forecast 2023-2028 ($ million)
- Chart on Others - Year-over-year growth 2023-2028 (%)
- Data Table on Others - Year-over-year growth 2023-2028 (%)
- 7.8 Market opportunity by Type
- Market opportunity by Type ($ million)
- Data Table on Market opportunity by Type ($ million)
8 Customer Landscape
- 8.1 Customer landscape overview
- Analysis of price sensitivity, lifecycle, customer purchase basket, adoption rates, and purchase criteria
9 Geographic Landscape
- 9.1 Geographic segmentation
- Chart on Market share By Geographical Landscape 2023-2028 (%)
- Data Table on Market share By Geographical Landscape 2023-2028 (%)
- 9.2 Geographic comparison
- Chart on Geographic comparison
- Data Table on Geographic comparison
- 9.3 North America - Market size and forecast 2023-2028
- Chart on North America - Market size and forecast 2023-2028 ($ million)
- Data Table on North America - Market size and forecast 2023-2028 ($ million)
- Chart on North America - Year-over-year growth 2023-2028 (%)
- Data Table on North America - Year-over-year growth 2023-2028 (%)
- 9.4 Europe - Market size and forecast 2023-2028
- Chart on Europe - Market size and forecast 2023-2028 ($ million)
- Data Table on Europe - Market size and forecast 2023-2028 ($ million)
- Chart on Europe - Year-over-year growth 2023-2028 (%)
- Data Table on Europe - Year-over-year growth 2023-2028 (%)
- 9.5 Asia - Market size and forecast 2023-2028
- Chart on Asia - Market size and forecast 2023-2028 ($ million)
- Data Table on Asia - Market size and forecast 2023-2028 ($ million)
- Chart on Asia - Year-over-year growth 2023-2028 (%)
- Data Table on Asia - Year-over-year growth 2023-2028 (%)
- 9.6 Rest of World (ROW) - Market size and forecast 2023-2028
- Chart on Rest of World (ROW) - Market size and forecast 2023-2028 ($ million)
- Data Table on Rest of World (ROW) - Market size and forecast 2023-2028 ($ million)
- Chart on Rest of World (ROW) - Year-over-year growth 2023-2028 (%)
- Data Table on Rest of World (ROW) - Year-over-year growth 2023-2028 (%)
- 9.7 US - Market size and forecast 2023-2028
- Chart on US - Market size and forecast 2023-2028 ($ million)
- Data Table on US - Market size and forecast 2023-2028 ($ million)
- Chart on US - Year-over-year growth 2023-2028 (%)
- Data Table on US - Year-over-year growth 2023-2028 (%)
- 9.8 China - Market size and forecast 2023-2028
- Chart on China - Market size and forecast 2023-2028 ($ million)
- Data Table on China - Market size and forecast 2023-2028 ($ million)
- Chart on China - Year-over-year growth 2023-2028 (%)
- Data Table on China - Year-over-year growth 2023-2028 (%)
- 9.9 UK - Market size and forecast 2023-2028
- Chart on UK - Market size and forecast 2023-2028 ($ million)
- Data Table on UK - Market size and forecast 2023-2028 ($ million)
- Chart on UK - Year-over-year growth 2023-2028 (%)
- Data Table on UK - Year-over-year growth 2023-2028 (%)
- 9.10 Germany - Market size and forecast 2023-2028
- Chart on Germany - Market size and forecast 2023-2028 ($ million)
- Data Table on Germany - Market size and forecast 2023-2028 ($ million)
- Chart on Germany - Year-over-year growth 2023-2028 (%)
- Data Table on Germany - Year-over-year growth 2023-2028 (%)
- 9.11 Japan - Market size and forecast 2023-2028
- Chart on Japan - Market size and forecast 2023-2028 ($ million)
- Data Table on Japan - Market size and forecast 2023-2028 ($ million)
- Chart on Japan - Year-over-year growth 2023-2028 (%)
- Data Table on Japan - Year-over-year growth 2023-2028 (%)
- 9.12 Market opportunity By Geographical Landscape
- Market opportunity By Geographical Landscape ($ million)
- Data Tables on Market opportunity By Geographical Landscape ($ million)
10 Drivers, Challenges, and Opportunity/Restraints
- 10.1 Market drivers
- 10.2 Market challenges
- 10.3 Impact of drivers and challenges
- Impact of drivers and challenges in 2023 and 2028
- 10.4 Market opportunities/restraints
11 Competitive Landscape
- 11.1 Overview
- 11.2 Competitive Landscape
- Overview on criticality of inputs and factors of differentiation
- 11.3 Landscape disruption
- Overview on factors of disruption
- 11.4 Industry risks
- Impact of key risks on business
12 Competitive Analysis
- 12.1 Companies profiled
- Companies covered
- 12.2 Market positioning of companies
- Matrix on companies position and classification
- 12.3 Agfa Gevaert NV
- Agfa Gevaert NV - Overview
- Agfa Gevaert NV - Business segments
- Agfa Gevaert NV - Key news
- Agfa Gevaert NV - Key offerings
- Agfa Gevaert NV - Segment focus
- 12.4 Baxter International Inc.
- Baxter International Inc. - Overview
- Baxter International Inc. - Business segments
- Baxter International Inc. - Key news
- Baxter International Inc. - Key offerings
- Baxter International Inc. - Segment focus
- 12.5 Bayer AG
- Bayer AG - Overview
- Bayer AG - Business segments
- Bayer AG - Key news
- Bayer AG - Key offerings
- Bayer AG - Segment focus
- 12.6 Caliber Imaging and Diagnostics Inc
- Caliber Imaging and Diagnostics Inc - Overview
- Caliber Imaging and Diagnostics Inc - Product / Service
- Caliber Imaging and Diagnostics Inc - Key offerings
- 12.7 Canfield Scientific Inc.
- Canfield Scientific Inc. - Overview
- Canfield Scientific Inc. - Product / Service
- Canfield Scientific Inc. - Key offerings
- 12.8 F. Hoffmann La Roche Ltd.
- F. Hoffmann La Roche Ltd. - Overview
- F. Hoffmann La Roche Ltd. - Business segments
- F. Hoffmann La Roche Ltd. - Key news
- F. Hoffmann La Roche Ltd. - Key offerings
- F. Hoffmann La Roche Ltd. - Segment focus
- 12.9 Firefly Global
- Firefly Global - Overview
- Firefly Global - Product / Service
- Firefly Global - Key offerings
- 12.10 FotoFinder Systems GmbH
- FotoFinder Systems GmbH - Overview
- FotoFinder Systems GmbH - Product / Service
- FotoFinder Systems GmbH - Key offerings
- 12.11 General Electric Co.
- General Electric Co. - Overview
- General Electric Co. - Business segments
- General Electric Co. - Key news
- General Electric Co. - Key offerings
- General Electric Co. - Segment focus
- 12.12 HEINE Optotechnik GmbH and Co. KG
- HEINE Optotechnik GmbH and Co. KG - Overview
- HEINE Optotechnik GmbH and Co. KG - Product / Service
- HEINE Optotechnik GmbH and Co. KG - Key offerings
- 12.13 Keyence Corp.
- Keyence Corp. - Overview
- Keyence Corp. - Product / Service
- Keyence Corp. - Key offerings
- 12.14 KIRCHNER and WILHELM plus GmbH Co. KG
- KIRCHNER and WILHELM plus GmbH Co. KG - Overview
- KIRCHNER and WILHELM plus GmbH Co. KG - Product / Service
- KIRCHNER and WILHELM plus GmbH Co. KG - Key offerings
- 12.15 Michelson Diagnostics Inc.
- Michelson Diagnostics Inc. - Overview
- Michelson Diagnostics Inc. - Product / Service
- Michelson Diagnostics Inc. - Key offerings
- 12.16 Microcurrent Technology Inc.
- Microcurrent Technology Inc. - Overview
- Microcurrent Technology Inc. - Product / Service
- Microcurrent Technology Inc. - Key offerings
- 12.17 Strata Skin Sciences Inc
- Strata Skin Sciences Inc - Overview
- Strata Skin Sciences Inc - Business segments
- Strata Skin Sciences Inc - Key offerings
- Strata Skin Sciences Inc - Segment focus
13 Appendix
- 13.1 Scope of the report
- 13.2 Inclusions and exclusions checklist
- Inclusions checklist
- Exclusions checklist
- 13.3 Currency conversion rates for US$
- Currency conversion rates for US$
- 13.4 Research methodology
- Research methodology
- 13.5 Data procurement
- Information sources
- 13.6 Data validation
- Data validation
- 13.7 Validation techniques employed for market sizing
- Validation techniques employed for market sizing
- 13.8 Data synthesis
- Data synthesis
- 13.9 360 degree market analysis
- 360 degree market analysis
- 13.10 List of abbreviations
- List of abbreviations

