|
|
市場調査レポート
商品コード
1491543
木材・プラスチック複合材料の世界市場 2024-2028Global wood-plastic composites market 2024-2028 |
||||||
|
|||||||
カスタマイズ可能
|
|||||||

| 木材・プラスチック複合材料の世界市場 2024-2028 |
|
出版日: 2024年05月17日
発行: TechNavio
ページ情報: 英文 180 Pages
納期: 即納可能
|

全表示
- 概要
- 図表
- 目次
木材・プラスチック複合材料市場は2023-2028年に61億7,530万米ドル、予測期間中のCAGRは13.41%で成長すると予測されます。
当レポートでは、木材・プラスチック複合材料市場の全体的な分析、市場規模・予測、動向、成長促進要因、課題、約25のベンダーを網羅したベンダー分析などを掲載しています。
現在の市場シナリオ、最新動向と促進要因、市場環境全体に関する最新分析を提供しています。市場を牽引しているのは、規制遵守の必要性、インフラ投資の増加、従来の木材を上回るWPCの優れた特性などです。
| 市場範囲 | |
|---|---|
| 基準年 | 2024 |
| 終了年 | 2028 |
| 予測期間 | 2024-2028 |
| 成長モメンタム | 加速 |
| 前年比2024年 | 11.56% |
| CAGR | 13.41% |
| 増分額 | 61億7,530万米ドル |
本調査では、今後数年間の木材・プラスチック複合材料市場成長を牽引する主な要因として、広葉樹の価格上昇を挙げています。また、新素材の出現、バイオプラスチックやリサイクルプラスチックの使用増加が市場の大きな需要につながります。
目次
第1章 エグゼクティブサマリー
- 市場概要
第2章 市場情勢
- 市場エコシステム
- 市場の特徴
- バリューチェーン分析
第3章 市場規模の評価
- 市場の定義
- 市場セグメント分析
- 市場規模 2023
- 市場の見通し 2023-2028
第4章 市場規模実績
- 世界木材・プラスチック複合材料市場 2018-2022
- 製品セグメント分析 2018-2022
- エンドユーザーセグメント分析 2018-2022
- 地域別セグメント分析 2018-2022
- 国別セグメント分析 2018-2022
第5章 ファイブフォース分析
- ファイブフォースの要約
- 買い手の交渉力
- 供給企業の交渉力
- 新規参入業者の脅威
- 代替品の脅威
- 競争の脅威
- 市況
第6章 製品別の市場セグメンテーション
- 市場セグメンテーション
- 比較:製品別
- ポリエチレン:市場規模と予測 2023-2028
- ポリ塩化ビニル:市場規模と予測 2023-2028
- ポリプロピレン:市場規模と予測 2023-2028
- その他:市場規模と予測 2023-2028
- 市場機会:製品別
第7章 市場セグメンテーション:エンドユーザー別
- 市場セグメンテーション
- 比較:エンドユーザー別
- 建築・建設:市場規模と予測 2023-2028
- 自動車:市場規模と予測 2023-2028
- 工業製品と消費財:市場規模と予測 2023-2028
- その他:市場規模と予測 2023-2028
- 市場機会:エンドユーザー別
第8章 顧客情勢
- 顧客情勢の概要
第9章 地域別情勢
- 地域別セグメンテーション
- 地域別比較
- 北米:市場規模と予測 2023-2028
- アジア太平洋:市場規模と予測 2023-2028
- 欧州:市場規模と予測 2023-2028
- 中東・アフリカ:市場規模と予測 2023-2028
- 南米:市場規模と予測 2023-2028
- 米国:市場規模と予測 2023-2028
- 中国:市場規模と予測 2023-2028
- ドイツ:市場規模と予測 2023-2028
- フランス:市場規模と予測 2023-2028
- インド:市場規模と予測 2023-2028
- 市場機会:地域情勢別
第10章 促進要因・課題・機会・抑制要因
- 市場促進要因
- 市場の課題
- 促進要因と課題の影響
- 市場の機会・抑制要因
第11章 競合情勢
- 概要
- 競合情勢
- 混乱の状況
- 業界のリスク
第12章 競合分析
- 企業プロファイル
- 企業の市場ポジショニング
- AIMPLAS
- Axion Structural Innovations LLC
- Beologic N.V.
- Compagnie de Saint Gobain
- CRH Plc
- Dow Chemical Co.
- Fkur Kunststoff GmbH
- Fortune Brands Innovations Inc.
- Guangzhou Kindwood Co. Ltd.
- JELU WERK J. Ehrler GmbH and Co. KG
- RENOLIT SE
- Shanghai Seven Trust Industry Co. Ltd.
- The AZEK Co. Inc.
- Trex Co. Inc.
- UFP Industries Inc.
第13章 付録
Exhibits:
- Exhibits1: Executive Summary - Chart on Market Overview
- Exhibits2: Executive Summary - Data Table on Market Overview
- Exhibits3: Executive Summary - Chart on Global Market Characteristics
- Exhibits4: Executive Summary - Chart on Market By Geographical Landscape
- Exhibits5: Executive Summary - Chart on Market Segmentation by Product
- Exhibits6: Executive Summary - Chart on Market Segmentation by End-user
- Exhibits7: Executive Summary - Chart on Incremental Growth
- Exhibits8: Executive Summary - Data Table on Incremental Growth
- Exhibits9: Executive Summary - Chart on Company Market Positioning
- Exhibits10: Parent Market
- Exhibits11: Data Table on - Parent Market
- Exhibits12: Market characteristics analysis
- Exhibits13: Value Chain Analysis
- Exhibits14: Offerings of companies included in the market definition
- Exhibits15: Market segments
- Exhibits16: Chart on Global - Market size and forecast 2023-2028 ($ million)
- Exhibits17: Data Table on Global - Market size and forecast 2023-2028 ($ million)
- Exhibits18: Chart on Global Market: Year-over-year growth 2023-2028 (%)
- Exhibits19: Data Table on Global Market: Year-over-year growth 2023-2028 (%)
- Exhibits20: Historic Market Size - Data Table on Global Wood-Plastic Composites Market 2018 - 2022 ($ million)
- Exhibits21: Historic Market Size - Product Segment 2018 - 2022 ($ million)
- Exhibits22: Historic Market Size - End-user Segment 2018 - 2022 ($ million)
- Exhibits23: Historic Market Size - Geography Segment 2018 - 2022 ($ million)
- Exhibits24: Historic Market Size - Country Segment 2018 - 2022 ($ million)
- Exhibits25: Five forces analysis - Comparison between 2023 and 2028
- Exhibits26: Bargaining power of buyers - Impact of key factors 2023 and 2028
- Exhibits27: Bargaining power of suppliers - Impact of key factors in 2023 and 2028
- Exhibits28: Threat of new entrants - Impact of key factors in 2023 and 2028
- Exhibits29: Threat of substitutes - Impact of key factors in 2023 and 2028
- Exhibits30: Threat of rivalry - Impact of key factors in 2023 and 2028
- Exhibits31: Chart on Market condition - Five forces 2023 and 2028
- Exhibits32: Chart on Product - Market share 2023-2028 (%)
- Exhibits33: Data Table on Product - Market share 2023-2028 (%)
- Exhibits34: Chart on Comparison by Product
- Exhibits35: Data Table on Comparison by Product
- Exhibits36: Chart on Polyethylene - Market size and forecast 2023-2028 ($ million)
- Exhibits37: Data Table on Polyethylene - Market size and forecast 2023-2028 ($ million)
- Exhibits38: Chart on Polyethylene - Year-over-year growth 2023-2028 (%)
- Exhibits39: Data Table on Polyethylene - Year-over-year growth 2023-2028 (%)
- Exhibits40: Chart on Polyvinyl chloride - Market size and forecast 2023-2028 ($ million)
- Exhibits41: Data Table on Polyvinyl chloride - Market size and forecast 2023-2028 ($ million)
- Exhibits42: Chart on Polyvinyl chloride - Year-over-year growth 2023-2028 (%)
- Exhibits43: Data Table on Polyvinyl chloride - Year-over-year growth 2023-2028 (%)
- Exhibits44: Chart on Polypropylene - Market size and forecast 2023-2028 ($ million)
- Exhibits45: Data Table on Polypropylene - Market size and forecast 2023-2028 ($ million)
- Exhibits46: Chart on Polypropylene - Year-over-year growth 2023-2028 (%)
- Exhibits47: Data Table on Polypropylene - Year-over-year growth 2023-2028 (%)
- Exhibits48: Chart on Others - Market size and forecast 2023-2028 ($ million)
- Exhibits49: Data Table on Others - Market size and forecast 2023-2028 ($ million)
- Exhibits50: Chart on Others - Year-over-year growth 2023-2028 (%)
- Exhibits51: Data Table on Others - Year-over-year growth 2023-2028 (%)
- Exhibits52: Market opportunity by Product ($ million)
- Exhibits53: Data Table on Market opportunity by Product ($ million)
- Exhibits54: Chart on End-user - Market share 2023-2028 (%)
- Exhibits55: Data Table on End-user - Market share 2023-2028 (%)
- Exhibits56: Chart on Comparison by End-user
- Exhibits57: Data Table on Comparison by End-user
- Exhibits58: Chart on Building and construction - Market size and forecast 2023-2028 ($ million)
- Exhibits59: Data Table on Building and construction - Market size and forecast 2023-2028 ($ million)
- Exhibits60: Chart on Building and construction - Year-over-year growth 2023-2028 (%)
- Exhibits61: Data Table on Building and construction - Year-over-year growth 2023-2028 (%)
- Exhibits62: Chart on Automotive - Market size and forecast 2023-2028 ($ million)
- Exhibits63: Data Table on Automotive - Market size and forecast 2023-2028 ($ million)
- Exhibits64: Chart on Automotive - Year-over-year growth 2023-2028 (%)
- Exhibits65: Data Table on Automotive - Year-over-year growth 2023-2028 (%)
- Exhibits66: Chart on Industrial and consumer goods - Market size and forecast 2023-2028 ($ million)
- Exhibits67: Data Table on Industrial and consumer goods - Market size and forecast 2023-2028 ($ million)
- Exhibits68: Chart on Industrial and consumer goods - Year-over-year growth 2023-2028 (%)
- Exhibits69: Data Table on Industrial and consumer goods - Year-over-year growth 2023-2028 (%)
- Exhibits70: Chart on Others - Market size and forecast 2023-2028 ($ million)
- Exhibits71: Data Table on Others - Market size and forecast 2023-2028 ($ million)
- Exhibits72: Chart on Others - Year-over-year growth 2023-2028 (%)
- Exhibits73: Data Table on Others - Year-over-year growth 2023-2028 (%)
- Exhibits74: Market opportunity by End-user ($ million)
- Exhibits75: Data Table on Market opportunity by End-user ($ million)
- Exhibits76: Analysis of price sensitivity, lifecycle, customer purchase basket, adoption rates, and purchase criteria
- Exhibits77: Chart on Market share By Geographical Landscape 2023-2028 (%)
- Exhibits78: Data Table on Market share By Geographical Landscape 2023-2028 (%)
- Exhibits79: Chart on Geographic comparison
- Exhibits80: Data Table on Geographic comparison
- Exhibits81: Chart on North America - Market size and forecast 2023-2028 ($ million)
- Exhibits82: Data Table on North America - Market size and forecast 2023-2028 ($ million)
- Exhibits83: Chart on North America - Year-over-year growth 2023-2028 (%)
- Exhibits84: Data Table on North America - Year-over-year growth 2023-2028 (%)
- Exhibits85: Chart on APAC - Market size and forecast 2023-2028 ($ million)
- Exhibits86: Data Table on APAC - Market size and forecast 2023-2028 ($ million)
- Exhibits87: Chart on APAC - Year-over-year growth 2023-2028 (%)
- Exhibits88: Data Table on APAC - Year-over-year growth 2023-2028 (%)
- Exhibits89: Chart on Europe - Market size and forecast 2023-2028 ($ million)
- Exhibits90: Data Table on Europe - Market size and forecast 2023-2028 ($ million)
- Exhibits91: Chart on Europe - Year-over-year growth 2023-2028 (%)
- Exhibits92: Data Table on Europe - Year-over-year growth 2023-2028 (%)
- Exhibits93: Chart on Middle East and Africa - Market size and forecast 2023-2028 ($ million)
- Exhibits94: Data Table on Middle East and Africa - Market size and forecast 2023-2028 ($ million)
- Exhibits95: Chart on Middle East and Africa - Year-over-year growth 2023-2028 (%)
- Exhibits96: Data Table on Middle East and Africa - Year-over-year growth 2023-2028 (%)
- Exhibits97: Chart on South America - Market size and forecast 2023-2028 ($ million)
- Exhibits98: Data Table on South America - Market size and forecast 2023-2028 ($ million)
- Exhibits99: Chart on South America - Year-over-year growth 2023-2028 (%)
- Exhibits100: Data Table on South America - Year-over-year growth 2023-2028 (%)
- Exhibits101: Chart on US - Market size and forecast 2023-2028 ($ million)
- Exhibits102: Data Table on US - Market size and forecast 2023-2028 ($ million)
- Exhibits103: Chart on US - Year-over-year growth 2023-2028 (%)
- Exhibits104: Data Table on US - Year-over-year growth 2023-2028 (%)
- Exhibits105: Chart on China - Market size and forecast 2023-2028 ($ million)
- Exhibits106: Data Table on China - Market size and forecast 2023-2028 ($ million)
- Exhibits107: Chart on China - Year-over-year growth 2023-2028 (%)
- Exhibits108: Data Table on China - Year-over-year growth 2023-2028 (%)
- Exhibits109: Chart on Germany - Market size and forecast 2023-2028 ($ million)
- Exhibits110: Data Table on Germany - Market size and forecast 2023-2028 ($ million)
- Exhibits111: Chart on Germany - Year-over-year growth 2023-2028 (%)
- Exhibits112: Data Table on Germany - Year-over-year growth 2023-2028 (%)
- Exhibits113: Chart on France - Market size and forecast 2023-2028 ($ million)
- Exhibits114: Data Table on France - Market size and forecast 2023-2028 ($ million)
- Exhibits115: Chart on France - Year-over-year growth 2023-2028 (%)
- Exhibits116: Data Table on France - Year-over-year growth 2023-2028 (%)
- Exhibits117: Chart on India - Market size and forecast 2023-2028 ($ million)
- Exhibits118: Data Table on India - Market size and forecast 2023-2028 ($ million)
- Exhibits119: Chart on India - Year-over-year growth 2023-2028 (%)
- Exhibits120: Data Table on India - Year-over-year growth 2023-2028 (%)
- Exhibits121: Market opportunity By Geographical Landscape ($ million)
- Exhibits122: Data Tables on Market opportunity By Geographical Landscape ($ million)
- Exhibits123: Impact of drivers and challenges in 2023 and 2028
- Exhibits124: Overview on criticality of inputs and factors of differentiation
- Exhibits125: Overview on factors of disruption
- Exhibits126: Impact of key risks on business
- Exhibits127: Companies covered
- Exhibits128: Matrix on companies position and classification
- Exhibits129: AIMPLAS - Overview
- Exhibits130: AIMPLAS - Product / Service
- Exhibits131: AIMPLAS - Key offerings
- Exhibits132: Axion Structural Innovations LLC - Overview
- Exhibits133: Axion Structural Innovations LLC - Product / Service
- Exhibits134: Axion Structural Innovations LLC - Key offerings
- Exhibits135: Beologic N.V. - Overview
- Exhibits136: Beologic N.V. - Product / Service
- Exhibits137: Beologic N.V. - Key offerings
- Exhibits138: Compagnie de Saint Gobain - Overview
- Exhibits139: Compagnie de Saint Gobain - Business segments
- Exhibits140: Compagnie de Saint Gobain - Key news
- Exhibits141: Compagnie de Saint Gobain - Key offerings
- Exhibits142: Compagnie de Saint Gobain - Segment focus
- Exhibits143: CRH Plc - Overview
- Exhibits144: CRH Plc - Business segments
- Exhibits145: CRH Plc - Key offerings
- Exhibits146: CRH Plc - Segment focus
- Exhibits147: Dow Chemical Co. - Overview
- Exhibits148: Dow Chemical Co. - Business segments
- Exhibits149: Dow Chemical Co. - Key news
- Exhibits150: Dow Chemical Co. - Key offerings
- Exhibits151: Dow Chemical Co. - Segment focus
- Exhibits152: Fkur Kunststoff GmbH - Overview
- Exhibits153: Fkur Kunststoff GmbH - Product / Service
- Exhibits154: Fkur Kunststoff GmbH - Key offerings
- Exhibits155: Fortune Brands Innovations Inc. - Overview
- Exhibits156: Fortune Brands Innovations Inc. - Business segments
- Exhibits157: Fortune Brands Innovations Inc. - Key offerings
- Exhibits158: Fortune Brands Innovations Inc. - Segment focus
- Exhibits159: Guangzhou Kindwood Co. Ltd. - Overview
- Exhibits160: Guangzhou Kindwood Co. Ltd. - Product / Service
- Exhibits161: Guangzhou Kindwood Co. Ltd. - Key offerings
- Exhibits162: JELU WERK J. Ehrler GmbH and Co. KG - Overview
- Exhibits163: JELU WERK J. Ehrler GmbH and Co. KG - Product / Service
- Exhibits164: JELU WERK J. Ehrler GmbH and Co. KG - Key offerings
- Exhibits165: RENOLIT SE - Overview
- Exhibits166: RENOLIT SE - Product / Service
- Exhibits167: RENOLIT SE - Key offerings
- Exhibits168: Shanghai Seven Trust Industry Co. Ltd. - Overview
- Exhibits169: Shanghai Seven Trust Industry Co. Ltd. - Product / Service
- Exhibits170: Shanghai Seven Trust Industry Co. Ltd. - Key offerings
- Exhibits171: The AZEK Co. Inc. - Overview
- Exhibits172: The AZEK Co. Inc. - Business segments
- Exhibits173: The AZEK Co. Inc. - Key offerings
- Exhibits174: The AZEK Co. Inc. - Segment focus
- Exhibits175: Trex Co. Inc. - Overview
- Exhibits176: Trex Co. Inc. - Business segments
- Exhibits177: Trex Co. Inc. - Key offerings
- Exhibits178: Trex Co. Inc. - Segment focus
- Exhibits179: UFP Industries Inc. - Overview
- Exhibits180: UFP Industries Inc. - Business segments
- Exhibits181: UFP Industries Inc. - Key offerings
- Exhibits182: UFP Industries Inc. - Segment focus
- Exhibits183: Inclusions checklist
- Exhibits184: Exclusions checklist
- Exhibits185: Currency conversion rates for US$
- Exhibits186: Research methodology
- Exhibits187: Information sources
- Exhibits188: Data validation
- Exhibits189: Validation techniques employed for market sizing
- Exhibits190: Data synthesis
- Exhibits191: 360 degree market analysis
- Exhibits192: List of abbreviations
The wood-plastic composites market is forecasted to grow by USD 6175.3 mn during 2023-2028, accelerating at a CAGR of 13.41% during the forecast period. The report on the wood-plastic composites market provides a holistic analysis, market size and forecast, trends, growth drivers, and challenges, as well as vendor analysis covering around 25 vendors.
The report offers an up-to-date analysis regarding the current market scenario, the latest trends and drivers, and the overall market environment. The market is driven by need for compliance with regulations, increasing infrastructure investments, and superior properties of WPCs over conventional wood.
Technavio's wood-plastic composites market is segmented as below:
| Market Scope | |
|---|---|
| Base Year | 2024 |
| End Year | 2028 |
| Series Year | 2024-2028 |
| Growth Momentum | Accelerate |
| YOY 2024 | 11.56% |
| CAGR | 13.41% |
| Incremental Value | $6175.3mn |
ByProduct
- Polyethylene
- Polyvinyl chloride
- Polypropylene
- Others
ByEnd-user
- Building and construction
- Automotive
- Industrial and consumer goods
- Others
ByGeography
- North America
- APAC
- Europe
- Middle East and Africa
- South America
This study identifies the increasing prices of hardwood as one of the prime reasons driving the wood-plastic composites market growth during the next few years. Also, emergence of new materials and increasing use of bioplastics and recycled plastics will lead to sizable demand in the market.
The report on the wood-plastic composites market covers the following areas:
- Wood-plastic composites market sizing
- Wood-plastic composites market forecast
- Wood-plastic composites market industry analysis
The robust vendor analysis is designed to help clients improve their market position, and in line with this, this report provides a detailed analysis of several leading wood-plastic composites market vendors that include AIMPLAS, Axion Structural Innovations LLC, Beologic N.V., Cargill Inc., Compagnie de Saint Gobain, CRH Plc, Dow Chemical Co., Fkur Kunststoff GmbH, Fortune Brands Innovations Inc., Guangzhou Kindwood Co. Ltd., Hardy Smith Designs Pvt. Ltd., JELU WERK J. Ehrler GmbH and Co. KG, Meghmani Organics Ltd., PolyPlank AB, RENOLIT SE, Shanghai Seven Trust Industry Co. Ltd., The AZEK Co. Inc., Trex Co. Inc., TVL Engineers Pvt. Ltd., and UFP Industries Inc.. Also, the wood-plastic composites market analysis report includes information on upcoming trends and challenges that will influence market growth. This is to help companies strategize and leverage all forthcoming growth opportunities.
The study was conducted using an objective combination of primary and secondary information including inputs from key participants in the industry. The report contains a comprehensive market and vendor landscape in addition to an analysis of the key vendors.
The publisher presents a detailed picture of the market by the way of study, synthesis, and summation of data from multiple sources by an analysis of key parameters such as profit, pricing, competition, and promotions. It presents various market facets by identifying the key industry influencers. The data presented is comprehensive, reliable, and a result of extensive research - both primary and secondary. The market research reports provide a complete competitive landscape and an in-depth vendor selection methodology and analysis using qualitative and quantitative research to forecast the accurate market growth.
Table of Contents
1 Executive Summary
- 1.1 Market overview
- Executive Summary - Chart on Market Overview
- Executive Summary - Data Table on Market Overview
- Executive Summary - Chart on Global Market Characteristics
- Executive Summary - Chart on Market By Geographical Landscape
- Executive Summary - Chart on Market Segmentation by Product
- Executive Summary - Chart on Market Segmentation by End-user
- Executive Summary - Chart on Incremental Growth
- Executive Summary - Data Table on Incremental Growth
- Executive Summary - Chart on Company Market Positioning
2 Market Landscape
- 2.1 Market ecosystem
- Parent Market
- Data Table on - Parent Market
- 2.2 Market characteristics
- Market characteristics analysis
- 2.3 Value chain analysis
- Value Chain Analysis
3 Market Sizing
- 3.1 Market definition
- Offerings of companies included in the market definition
- 3.2 Market segment analysis
- Market segments
- 3.3 Market size 2023
- 3.4 Market outlook: Forecast for 2023-2028
- Chart on Global - Market size and forecast 2023-2028 ($ million)
- Data Table on Global - Market size and forecast 2023-2028 ($ million)
- Chart on Global Market: Year-over-year growth 2023-2028 (%)
- Data Table on Global Market: Year-over-year growth 2023-2028 (%)
4 Historic Market Size
- 4.1 Global Wood-Plastic Composites Market 2018 - 2022
- Historic Market Size - Data Table on Global Wood-Plastic Composites Market 2018 - 2022 ($ million)
- 4.2 Product segment analysis 2018 - 2022
- Historic Market Size - Product Segment 2018 - 2022 ($ million)
- 4.3 End-user segment analysis 2018 - 2022
- Historic Market Size - End-user Segment 2018 - 2022 ($ million)
- 4.4 Geography segment analysis 2018 - 2022
- Historic Market Size - Geography Segment 2018 - 2022 ($ million)
- 4.5 Country segment analysis 2018 - 2022
- Historic Market Size - Country Segment 2018 - 2022 ($ million)
5 Five Forces Analysis
- 5.1 Five forces summary
- Five forces analysis - Comparison between 2023 and 2028
- 5.2 Bargaining power of buyers
- Bargaining power of buyers - Impact of key factors 2023 and 2028
- 5.3 Bargaining power of suppliers
- Bargaining power of suppliers - Impact of key factors in 2023 and 2028
- 5.4 Threat of new entrants
- Threat of new entrants - Impact of key factors in 2023 and 2028
- 5.5 Threat of substitutes
- Threat of substitutes - Impact of key factors in 2023 and 2028
- 5.6 Threat of rivalry
- Threat of rivalry - Impact of key factors in 2023 and 2028
- 5.7 Market condition
- Chart on Market condition - Five forces 2023 and 2028
6 Market Segmentation by Product
- 6.1 Market segments
- Chart on Product - Market share 2023-2028 (%)
- Data Table on Product - Market share 2023-2028 (%)
- 6.2 Comparison by Product
- Chart on Comparison by Product
- Data Table on Comparison by Product
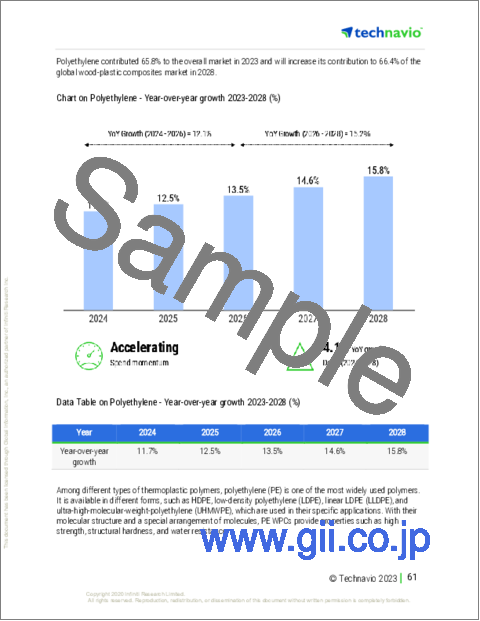
- 6.3 Polyethylene - Market size and forecast 2023-2028
- Chart on Polyethylene - Market size and forecast 2023-2028 ($ million)
- Data Table on Polyethylene - Market size and forecast 2023-2028 ($ million)
- Chart on Polyethylene - Year-over-year growth 2023-2028 (%)
- Data Table on Polyethylene - Year-over-year growth 2023-2028 (%)
- 6.4 Polyvinyl chloride - Market size and forecast 2023-2028
- Chart on Polyvinyl chloride - Market size and forecast 2023-2028 ($ million)
- Data Table on Polyvinyl chloride - Market size and forecast 2023-2028 ($ million)
- Chart on Polyvinyl chloride - Year-over-year growth 2023-2028 (%)
- Data Table on Polyvinyl chloride - Year-over-year growth 2023-2028 (%)
- 6.5 Polypropylene - Market size and forecast 2023-2028
- Chart on Polypropylene - Market size and forecast 2023-2028 ($ million)
- Data Table on Polypropylene - Market size and forecast 2023-2028 ($ million)
- Chart on Polypropylene - Year-over-year growth 2023-2028 (%)
- Data Table on Polypropylene - Year-over-year growth 2023-2028 (%)
- 6.6 Others - Market size and forecast 2023-2028
- Chart on Others - Market size and forecast 2023-2028 ($ million)
- Data Table on Others - Market size and forecast 2023-2028 ($ million)
- Chart on Others - Year-over-year growth 2023-2028 (%)
- Data Table on Others - Year-over-year growth 2023-2028 (%)
- 6.7 Market opportunity by Product
- Market opportunity by Product ($ million)
- Data Table on Market opportunity by Product ($ million)
7 Market Segmentation by End-user
- 7.1 Market segments
- Chart on End-user - Market share 2023-2028 (%)
- Data Table on End-user - Market share 2023-2028 (%)
- 7.2 Comparison by End-user
- Chart on Comparison by End-user
- Data Table on Comparison by End-user
- 7.3 Building and construction - Market size and forecast 2023-2028
- Chart on Building and construction - Market size and forecast 2023-2028 ($ million)
- Data Table on Building and construction - Market size and forecast 2023-2028 ($ million)
- Chart on Building and construction - Year-over-year growth 2023-2028 (%)
- Data Table on Building and construction - Year-over-year growth 2023-2028 (%)
- 7.4 Automotive - Market size and forecast 2023-2028
- Chart on Automotive - Market size and forecast 2023-2028 ($ million)
- Data Table on Automotive - Market size and forecast 2023-2028 ($ million)
- Chart on Automotive - Year-over-year growth 2023-2028 (%)
- Data Table on Automotive - Year-over-year growth 2023-2028 (%)
- 7.5 Industrial and consumer goods - Market size and forecast 2023-2028
- Chart on Industrial and consumer goods - Market size and forecast 2023-2028 ($ million)
- Data Table on Industrial and consumer goods - Market size and forecast 2023-2028 ($ million)
- Chart on Industrial and consumer goods - Year-over-year growth 2023-2028 (%)
- Data Table on Industrial and consumer goods - Year-over-year growth 2023-2028 (%)
- 7.6 Others - Market size and forecast 2023-2028
- Chart on Others - Market size and forecast 2023-2028 ($ million)
- Data Table on Others - Market size and forecast 2023-2028 ($ million)
- Chart on Others - Year-over-year growth 2023-2028 (%)
- Data Table on Others - Year-over-year growth 2023-2028 (%)
- 7.7 Market opportunity by End-user
- Market opportunity by End-user ($ million)
- Data Table on Market opportunity by End-user ($ million)
8 Customer Landscape
- 8.1 Customer landscape overview
- Analysis of price sensitivity, lifecycle, customer purchase basket, adoption rates, and purchase criteria
9 Geographic Landscape
- 9.1 Geographic segmentation
- Chart on Market share By Geographical Landscape 2023-2028 (%)
- Data Table on Market share By Geographical Landscape 2023-2028 (%)
- 9.2 Geographic comparison
- Chart on Geographic comparison
- Data Table on Geographic comparison
- 9.3 North America - Market size and forecast 2023-2028
- Chart on North America - Market size and forecast 2023-2028 ($ million)
- Data Table on North America - Market size and forecast 2023-2028 ($ million)
- Chart on North America - Year-over-year growth 2023-2028 (%)
- Data Table on North America - Year-over-year growth 2023-2028 (%)
- 9.4 APAC - Market size and forecast 2023-2028
- Chart on APAC - Market size and forecast 2023-2028 ($ million)
- Data Table on APAC - Market size and forecast 2023-2028 ($ million)
- Chart on APAC - Year-over-year growth 2023-2028 (%)
- Data Table on APAC - Year-over-year growth 2023-2028 (%)
- 9.5 Europe - Market size and forecast 2023-2028
- Chart on Europe - Market size and forecast 2023-2028 ($ million)
- Data Table on Europe - Market size and forecast 2023-2028 ($ million)
- Chart on Europe - Year-over-year growth 2023-2028 (%)
- Data Table on Europe - Year-over-year growth 2023-2028 (%)
- 9.6 Middle East and Africa - Market size and forecast 2023-2028
- Chart on Middle East and Africa - Market size and forecast 2023-2028 ($ million)
- Data Table on Middle East and Africa - Market size and forecast 2023-2028 ($ million)
- Chart on Middle East and Africa - Year-over-year growth 2023-2028 (%)
- Data Table on Middle East and Africa - Year-over-year growth 2023-2028 (%)
- 9.7 South America - Market size and forecast 2023-2028
- Chart on South America - Market size and forecast 2023-2028 ($ million)
- Data Table on South America - Market size and forecast 2023-2028 ($ million)
- Chart on South America - Year-over-year growth 2023-2028 (%)
- Data Table on South America - Year-over-year growth 2023-2028 (%)
- 9.8 US - Market size and forecast 2023-2028
- Chart on US - Market size and forecast 2023-2028 ($ million)
- Data Table on US - Market size and forecast 2023-2028 ($ million)
- Chart on US - Year-over-year growth 2023-2028 (%)
- Data Table on US - Year-over-year growth 2023-2028 (%)
- 9.9 China - Market size and forecast 2023-2028
- Chart on China - Market size and forecast 2023-2028 ($ million)
- Data Table on China - Market size and forecast 2023-2028 ($ million)
- Chart on China - Year-over-year growth 2023-2028 (%)
- Data Table on China - Year-over-year growth 2023-2028 (%)
- 9.10 Germany - Market size and forecast 2023-2028
- Chart on Germany - Market size and forecast 2023-2028 ($ million)
- Data Table on Germany - Market size and forecast 2023-2028 ($ million)
- Chart on Germany - Year-over-year growth 2023-2028 (%)
- Data Table on Germany - Year-over-year growth 2023-2028 (%)
- 9.11 France - Market size and forecast 2023-2028
- Chart on France - Market size and forecast 2023-2028 ($ million)
- Data Table on France - Market size and forecast 2023-2028 ($ million)
- Chart on France - Year-over-year growth 2023-2028 (%)
- Data Table on France - Year-over-year growth 2023-2028 (%)
- 9.12 India - Market size and forecast 2023-2028
- Chart on India - Market size and forecast 2023-2028 ($ million)
- Data Table on India - Market size and forecast 2023-2028 ($ million)
- Chart on India - Year-over-year growth 2023-2028 (%)
- Data Table on India - Year-over-year growth 2023-2028 (%)
- 9.13 Market opportunity By Geographical Landscape
- Market opportunity By Geographical Landscape ($ million)
- Data Tables on Market opportunity By Geographical Landscape ($ million)
10 Drivers, Challenges, and Opportunity/Restraints
- 10.1 Market drivers
- 10.2 Market challenges
- 10.3 Impact of drivers and challenges
- Impact of drivers and challenges in 2023 and 2028
- 10.4 Market opportunities/restraints
11 Competitive Landscape
- 11.1 Overview
- 11.2 Competitive Landscape
- Overview on criticality of inputs and factors of differentiation
- 11.3 Landscape disruption
- Overview on factors of disruption
- 11.4 Industry risks
- Impact of key risks on business
12 Competitive Analysis
- 12.1 Companies profiled
- Companies covered
- 12.2 Market positioning of companies
- Matrix on companies position and classification
- 12.3 AIMPLAS
- AIMPLAS - Overview
- AIMPLAS - Product / Service
- AIMPLAS - Key offerings
- 12.4 Axion Structural Innovations LLC
- Axion Structural Innovations LLC - Overview
- Axion Structural Innovations LLC - Product / Service
- Axion Structural Innovations LLC - Key offerings
- 12.5 Beologic N.V.
- Beologic N.V. - Overview
- Beologic N.V. - Product / Service
- Beologic N.V. - Key offerings
- 12.6 Compagnie de Saint Gobain
- Compagnie de Saint Gobain - Overview
- Compagnie de Saint Gobain - Business segments
- Compagnie de Saint Gobain - Key news
- Compagnie de Saint Gobain - Key offerings
- Compagnie de Saint Gobain - Segment focus
- 12.7 CRH Plc
- CRH Plc - Overview
- CRH Plc - Business segments
- CRH Plc - Key offerings
- CRH Plc - Segment focus
- 12.8 Dow Chemical Co.
- Dow Chemical Co. - Overview
- Dow Chemical Co. - Business segments
- Dow Chemical Co. - Key news
- Dow Chemical Co. - Key offerings
- Dow Chemical Co. - Segment focus
- 12.9 Fkur Kunststoff GmbH
- Fkur Kunststoff GmbH - Overview
- Fkur Kunststoff GmbH - Product / Service
- Fkur Kunststoff GmbH - Key offerings
- 12.10 Fortune Brands Innovations Inc.
- Fortune Brands Innovations Inc. - Overview
- Fortune Brands Innovations Inc. - Business segments
- Fortune Brands Innovations Inc. - Key offerings
- Fortune Brands Innovations Inc. - Segment focus
- 12.11 Guangzhou Kindwood Co. Ltd.
- Guangzhou Kindwood Co. Ltd. - Overview
- Guangzhou Kindwood Co. Ltd. - Product / Service
- Guangzhou Kindwood Co. Ltd. - Key offerings
- 12.12 JELU WERK J. Ehrler GmbH and Co. KG
- JELU WERK J. Ehrler GmbH and Co. KG - Overview
- JELU WERK J. Ehrler GmbH and Co. KG - Product / Service
- JELU WERK J. Ehrler GmbH and Co. KG - Key offerings
- 12.13 RENOLIT SE
- RENOLIT SE - Overview
- RENOLIT SE - Product / Service
- RENOLIT SE - Key offerings
- 12.14 Shanghai Seven Trust Industry Co. Ltd.
- Shanghai Seven Trust Industry Co. Ltd. - Overview
- Shanghai Seven Trust Industry Co. Ltd. - Product / Service
- Shanghai Seven Trust Industry Co. Ltd. - Key offerings
- 12.15 The AZEK Co. Inc.
- The AZEK Co. Inc. - Overview
- The AZEK Co. Inc. - Business segments
- The AZEK Co. Inc. - Key offerings
- The AZEK Co. Inc. - Segment focus
- 12.16 Trex Co. Inc.
- Trex Co. Inc. - Overview
- Trex Co. Inc. - Business segments
- Trex Co. Inc. - Key offerings
- Trex Co. Inc. - Segment focus
- 12.17 UFP Industries Inc.
- UFP Industries Inc. - Overview
- UFP Industries Inc. - Business segments
- UFP Industries Inc. - Key offerings
- UFP Industries Inc. - Segment focus
13 Appendix
- 13.1 Scope of the report
- 13.2 Inclusions and exclusions checklist
- Inclusions checklist
- Exclusions checklist
- 13.3 Currency conversion rates for US$
- Currency conversion rates for US$
- 13.4 Research methodology
- Research methodology
- 13.5 Data procurement
- Information sources
- 13.6 Data validation
- Data validation
- 13.7 Validation techniques employed for market sizing
- Validation techniques employed for market sizing
- 13.8 Data synthesis
- Data synthesis
- 13.9 360 degree market analysis
- 360 degree market analysis
- 13.10 List of abbreviations
- List of abbreviations

