|
|
市場調査レポート
商品コード
1911100
オーガニック洗濯洗剤の世界市場、2026年~2030年Global Organic Laundry Detergents Market 2026-2030 |
||||||
|
|||||||
カスタマイズ可能
|
|||||||

| オーガニック洗濯洗剤の世界市場、2026年~2030年 |
|
出版日: 2026年01月14日
発行: TechNavio
ページ情報: 英文 284 Pages
納期: 即納可能
|

概要
世界のオーガニック洗濯洗剤市場は、2025年から2030年にかけて78億7,520万米ドルの成長が見込まれ、予測期間中のCAGRは13.7%と予測されています。
本報告書では、世界のオーガニック洗濯洗剤市場に関する包括的な分析、市場規模と予測、動向、成長要因、課題に加え、約25社のベンダー分析を提供しています。
本レポートは、現在の市場状況、最新の動向と促進要因、市場環境全般に関する最新の分析を提供します。市場は、産業廃棄物の増加、環境に優しい製品への需要の高まり、厳格な環境規制によって牽引されています。
本調査は、業界の主要関係者からの情報をはじめとする一次情報と二次情報を客観的に組み合わせて実施されました。本レポートには、主要企業の分析に加え、包括的な市場規模データ、地域別分析を伴うセグメント、ベンダー情勢が含まれています。レポートには過去データと予測データが掲載されています。
| 市場範囲 | |
|---|---|
| 基準年 | 2026年 |
| 終了年 | 2030年 |
| 予測期間 | 2026年~2030年 |
| 成長モメンタム | 加速 |
| 前年比2026年 | 11.5% |
| CAGR | 13.7% |
| 増分額 | 78億7,520万米ドル |
本調査では、今後数年間における世界のオーガニック洗濯洗剤市場の成長を牽引する主要な要因の一つとして、新たな包装デザインの発展を挙げています。また、オンライン小売セクターの成長と液体オーガニック洗濯洗剤の普及拡大により、市場において相当な需要が見込まれます。
目次
第1章 エグゼクティブサマリー
第2章 Technavio分析
- 価格反応性・ライフサイクル・顧客購入バスケット・採用率・購入基準の分析
- インプットの重要性と差別化の要因
- 混乱の要因
- 促進要因と課題の影響
第3章 市場情勢
- 市場エコシステム
- 市場の特徴
- バリューチェーン分析
第4章 市場規模
- 市場の定義
- 市場セグメント分析
- 市場規模、2025年
- 市場の見通し、2025年~2030年
第5章 市場規模実績
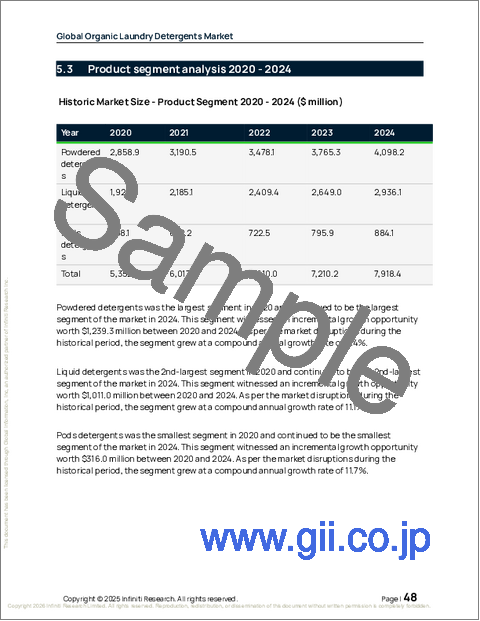
- 世界のオーガニック洗濯洗剤市場、2020年~2024年
- 流通チャネルセグメント分析、2020年~2024年
- 製品セグメント分析、2020年~2024年
- 製剤セグメント分析、2020年~2024年
- 地域別セグメント分析、2020年~2024年
- 国別セグメント分析、2020年~2024年
第6章 定性分析
- AIの影響:世界のオーガニック洗濯洗剤市場
第7章 ファイブフォース分析
- ファイブフォースの要約
- 買い手の交渉力
- 供給企業の交渉力
- 新規参入業者の脅威
- 代替品の脅威
- 競争の脅威
- 市況
第8章 市場セグメンテーション:流通チャネル別
- 比較:流通チャネル別
- オフライン
- オンライン
- 市場機会:流通チャネル別
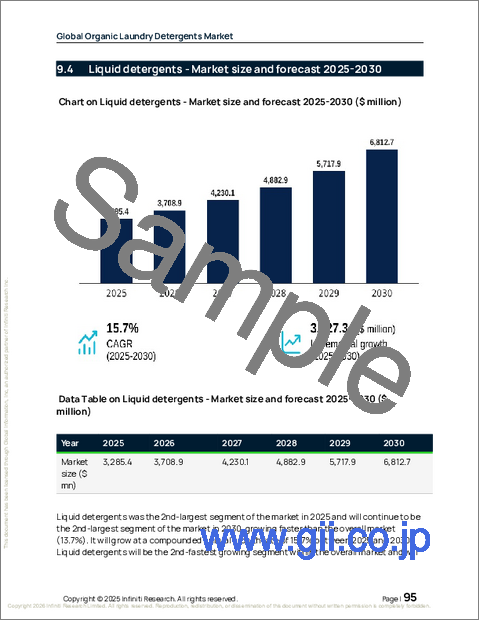
第9章 市場セグメンテーション:製品別
- 比較:製品別
- 粉末洗剤
- 液体洗剤
- ポッド洗剤
- 市場機会:製品別
第10章 市場セグメンテーション:製剤別
- 比較:製剤別
- 植物由来原料
- 酵素ベース
- 精油配合
- 市場機会:製剤別
第11章 顧客情勢
第12章 地域別情勢
- 地域別セグメンテーション
- 地域別比較
- 北米
- 米国
- カナダ
- メキシコ
- 欧州
- ドイツ
- イギリス
- フランス
- イタリア
- スペイン
- オランダ
- アジア太平洋地域
- 中国
- 日本
- インド
- 韓国
- オーストラリア
- インドネシア
- 南米
- ブラジル
- アルゼンチン
- チリ
- 中東・アフリカ
- サウジアラビア
- UAE
- 南アフリカ
- イスラエル
- トルコ
- 市場機会:地域別
第13章 促進要因、課題、機会
- 市場促進要因
- 市場の課題
- 促進要因と課題の影響
- 市場機会
第14章 競合情勢
- 概要
- 競合情勢
- 混乱の状況
- 業界のリスク
第15章 競合分析
- 企業プロファイル
- 企業ランキング指標
- 企業の市場ポジショニング
- AspenClean
- Eco Me
- EcoRoots
- Ecozone Ltd.
- Greenology Products Inc.
- Grove Collaborative Inc.
- PurposeBuilt Brands
- Rockin Green
- S.C. Johnson and Son Inc.
- Sonett GmbH
- Tandis Naturals
- Procter and Gamble Co.
- Unilever PLC
- Venus Laboratories DBA Earth Friendly Products
- Werner and Mertz GmbH

