|
|
市場調査レポート
商品コード
1544494
高速攻撃機(FAC)の世界市場、2024~2028年Global Fast Attack Craft (FAC) Market 2024-2028 |
||||||

|
|||||||
カスタマイズ可能
|
|||||||

| 高速攻撃機(FAC)の世界市場、2024~2028年 |
|
出版日: 2024年07月23日
発行: TechNavio
ページ情報: 英文 150 Pages
納期: 即納可能
|

全表示
- 概要
- 図表
- 目次
高速攻撃機(FAC)市場は2023~2028年に17億5,840万米ドル、予測期間中のCAGRは6.78%で成長すると予測されています。
当レポートでは、高速攻撃機(FAC)市場の全体的な分析、市場規模・予測、動向、成長促進要因、課題、約25のベンダーを網羅したベンダー分析などを掲載しています。
現在の市場シナリオ、最新動向と促進要因、市場環境全体に関する最新分析を提供しています。同市場は、ISR活動への注目の高まり、国家間の地政学的緊張の高まり、防衛予算の増加によって牽引されています。
| 市場範囲 | |
|---|---|
| 基準年 | 2024年 |
| 終了年 | 2028年 |
| 予測期間 | 2024~2028年 |
| 成長モメンタム | 加速 |
| 前年比[2024年] | 6.23% |
| CAGR | 6.78% |
| 増分額 | 17億5,840万米ドル |
本調査では、今後数年間の高速攻撃機(FAC)市場の成長を促進する主要要因の1つとして、軍艦に対する需要の増加を挙げています。また、高速攻撃艇の進歩やベンダーによる有機的成長戦略も市場の大きな需要につながると考えられます。
目次
第1章 エグゼクティブサマリー
- 市場概要
第2章 市場情勢
- 市場エコシステム
- 市場の特徴
- バリューチェーン分析
第3章 市場規模の評価
- 市場の定義
- 市場セグメント分析
- 市場規模 2023年
- 市場の展望 2023~2028年
第4章 市場規模実績
- 高速攻撃機(FAC)の世界市場 2018~2022年
- 用途別セグメント分析 2018~2022年
- タイプ別セグメント分析 2018~2022年
- 地域別セグメント分析 2018~2022年
- 国別セグメント分析 2018~2022年
第5章 ファイブフォース分析
- ファイブフォースの要約
- 買い手の交渉力
- 供給企業の交渉力
- 新規参入業者の脅威
- 代替品の脅威
- 競争の脅威
- 市況
第6章 市場セグメンテーション:用途別
- 市場セグメンテーション
- 比較:用途別
- 国防:市場規模と予測 2023~2028年
- 技術研究:市場規模と予測 2023~2028年
- 市場機会:用途別
第7章 市場セグメンテーション:タイプ別
- 市場セグメンテーション
- 比較:タイプ別
- ミサイル搭載FAC:市場規模と予測 2023~2028年
- ミサイル非搭載FAC:市場規模と予測 2023~2028年
- 市場機会:タイプ別
第8章 顧客情勢
- 顧客情勢概要
第9章 地域別情勢
- 地域別セグメンテーション
- 比較:地域別
- 北米:市場規模と予測 2023~2028年
- 欧州:市場規模と予測 2023~2028年
- アジア太平洋:市場規模と予測 2023~2028年
- 中東・アフリカ:市場規模と予測 2023~2028年
- 南米:市場規模と予測 2023~2028年
- 米国:市場規模と予測 2023~2028年
- 中国:市場規模と予測 2023~2028年
- 日本:市場規模と予測 2023~2028年
- 英国:市場規模と予測 2023~2028年
- イラン:市場規模と予測 2023~2028年
- 市場機会:地域情勢別
第10章 促進要因・課題・機会・抑制要因
- 市場促進要因
- 市場課題
- 促進要因と課題の影響
- 市場の機会・抑制要因
第11章 競合情勢
- 概要
- 競合情勢
- 混乱の状況
- 業界のリスク
第12章 競合分析
- 企業プロファイル
- 企業の市場ポジショニング
- BAE Systems Plc
- China Shipbuilding Trading Co. Ltd.
- CONSTRUCTIONS MECANIQUES DE NORMANDIE
- Daewoo Shipbuilding and Marine Engineering Co. Ltd.
- Damen Shipyards Group
- Fincantieri Spa
- Fr. Lurssen Werft GmbH
- Garden Reach Shipbuilders and Engineers
- Goa Shipyard Ltd.
- Hanjin Heavy Industries and Construction Holdings Co. Ltd.
- Mitsubishi Heavy Industries Ltd.
- Navantia SA
第13章 付録
Exhibits:
- Exhibits1: Executive Summary - Chart on Market Overview
- Exhibits2: Executive Summary - Data Table on Market Overview
- Exhibits3: Executive Summary - Chart on Global Market Characteristics
- Exhibits4: Executive Summary - Chart on Market By Geographical Landscape
- Exhibits5: Executive Summary - Chart on Market Segmentation by Application
- Exhibits6: Executive Summary - Chart on Market Segmentation by Type
- Exhibits7: Executive Summary - Chart on Incremental Growth
- Exhibits8: Executive Summary - Data Table on Incremental Growth
- Exhibits9: Executive Summary - Chart on Company Market Positioning
- Exhibits10: Parent Market
- Exhibits11: Data Table on - Parent Market
- Exhibits12: Market characteristics analysis
- Exhibits13: Value Chain Analysis
- Exhibits14: Offerings of companies included in the market definition
- Exhibits15: Market segments
- Exhibits16: Chart on Global - Market size and forecast 2023-2028 ($ million)
- Exhibits17: Data Table on Global - Market size and forecast 2023-2028 ($ million)
- Exhibits18: Chart on Global Market: Year-over-year growth 2023-2028 (%)
- Exhibits19: Data Table on Global Market: Year-over-year growth 2023-2028 (%)
- Exhibits20: Historic Market Size - Data Table on Global Fast Attack Craft (FAC) Market 2018 - 2022 ($ million)
- Exhibits21: Historic Market Size - Application Segment 2018 - 2022 ($ million)
- Exhibits22: Historic Market Size - Type Segment 2018 - 2022 ($ million)
- Exhibits23: Historic Market Size - Geography Segment 2018 - 2022 ($ million)
- Exhibits24: Historic Market Size - Country Segment 2018 - 2022 ($ million)
- Exhibits25: Five forces analysis - Comparison between 2023 and 2028
- Exhibits26: Bargaining power of buyers - Impact of key factors 2023 and 2028
- Exhibits27: Bargaining power of suppliers - Impact of key factors in 2023 and 2028
- Exhibits28: Threat of new entrants - Impact of key factors in 2023 and 2028
- Exhibits29: Threat of substitutes - Impact of key factors in 2023 and 2028
- Exhibits30: Threat of rivalry - Impact of key factors in 2023 and 2028
- Exhibits31: Chart on Market condition - Five forces 2023 and 2028
- Exhibits32: Chart on Application - Market share 2023-2028 (%)
- Exhibits33: Data Table on Application - Market share 2023-2028 (%)
- Exhibits34: Chart on Comparison by Application
- Exhibits35: Data Table on Comparison by Application
- Exhibits36: Chart on National defense - Market size and forecast 2023-2028 ($ million)
- Exhibits37: Data Table on National defense - Market size and forecast 2023-2028 ($ million)
- Exhibits38: Chart on National defense - Year-over-year growth 2023-2028 (%)
- Exhibits39: Data Table on National defense - Year-over-year growth 2023-2028 (%)
- Exhibits40: Chart on Technical research - Market size and forecast 2023-2028 ($ million)
- Exhibits41: Data Table on Technical research - Market size and forecast 2023-2028 ($ million)
- Exhibits42: Chart on Technical research - Year-over-year growth 2023-2028 (%)
- Exhibits43: Data Table on Technical research - Year-over-year growth 2023-2028 (%)
- Exhibits44: Market opportunity by Application ($ million)
- Exhibits45: Data Table on Market opportunity by Application ($ million)
- Exhibits46: Chart on Type - Market share 2023-2028 (%)
- Exhibits47: Data Table on Type - Market share 2023-2028 (%)
- Exhibits48: Chart on Comparison by Type
- Exhibits49: Data Table on Comparison by Type
- Exhibits50: Chart on Missile-armed FAC - Market size and forecast 2023-2028 ($ million)
- Exhibits51: Data Table on Missile-armed FAC - Market size and forecast 2023-2028 ($ million)
- Exhibits52: Chart on Missile-armed FAC - Year-over-year growth 2023-2028 (%)
- Exhibits53: Data Table on Missile-armed FAC - Year-over-year growth 2023-2028 (%)
- Exhibits54: Chart on Non-missile armed FAC - Market size and forecast 2023-2028 ($ million)
- Exhibits55: Data Table on Non-missile armed FAC - Market size and forecast 2023-2028 ($ million)
- Exhibits56: Chart on Non-missile armed FAC - Year-over-year growth 2023-2028 (%)
- Exhibits57: Data Table on Non-missile armed FAC - Year-over-year growth 2023-2028 (%)
- Exhibits58: Market opportunity by Type ($ million)
- Exhibits59: Data Table on Market opportunity by Type ($ million)
- Exhibits60: Analysis of price sensitivity, lifecycle, customer purchase basket, adoption rates, and purchase criteria
- Exhibits61: Chart on Market share By Geographical Landscape 2023-2028 (%)
- Exhibits62: Data Table on Market share By Geographical Landscape 2023-2028 (%)
- Exhibits63: Chart on Geographic comparison
- Exhibits64: Data Table on Geographic comparison
- Exhibits65: Chart on North America - Market size and forecast 2023-2028 ($ million)
- Exhibits66: Data Table on North America - Market size and forecast 2023-2028 ($ million)
- Exhibits67: Chart on North America - Year-over-year growth 2023-2028 (%)
- Exhibits68: Data Table on North America - Year-over-year growth 2023-2028 (%)
- Exhibits69: Chart on Europe - Market size and forecast 2023-2028 ($ million)
- Exhibits70: Data Table on Europe - Market size and forecast 2023-2028 ($ million)
- Exhibits71: Chart on Europe - Year-over-year growth 2023-2028 (%)
- Exhibits72: Data Table on Europe - Year-over-year growth 2023-2028 (%)
- Exhibits73: Chart on APAC - Market size and forecast 2023-2028 ($ million)
- Exhibits74: Data Table on APAC - Market size and forecast 2023-2028 ($ million)
- Exhibits75: Chart on APAC - Year-over-year growth 2023-2028 (%)
- Exhibits76: Data Table on APAC - Year-over-year growth 2023-2028 (%)
- Exhibits77: Chart on Middle East and Africa - Market size and forecast 2023-2028 ($ million)
- Exhibits78: Data Table on Middle East and Africa - Market size and forecast 2023-2028 ($ million)
- Exhibits79: Chart on Middle East and Africa - Year-over-year growth 2023-2028 (%)
- Exhibits80: Data Table on Middle East and Africa - Year-over-year growth 2023-2028 (%)
- Exhibits81: Chart on South America - Market size and forecast 2023-2028 ($ million)
- Exhibits82: Data Table on South America - Market size and forecast 2023-2028 ($ million)
- Exhibits83: Chart on South America - Year-over-year growth 2023-2028 (%)
- Exhibits84: Data Table on South America - Year-over-year growth 2023-2028 (%)
- Exhibits85: Chart on US - Market size and forecast 2023-2028 ($ million)
- Exhibits86: Data Table on US - Market size and forecast 2023-2028 ($ million)
- Exhibits87: Chart on US - Year-over-year growth 2023-2028 (%)
- Exhibits88: Data Table on US - Year-over-year growth 2023-2028 (%)
- Exhibits89: Chart on China - Market size and forecast 2023-2028 ($ million)
- Exhibits90: Data Table on China - Market size and forecast 2023-2028 ($ million)
- Exhibits91: Chart on China - Year-over-year growth 2023-2028 (%)
- Exhibits92: Data Table on China - Year-over-year growth 2023-2028 (%)
- Exhibits93: Chart on Japan - Market size and forecast 2023-2028 ($ million)
- Exhibits94: Data Table on Japan - Market size and forecast 2023-2028 ($ million)
- Exhibits95: Chart on Japan - Year-over-year growth 2023-2028 (%)
- Exhibits96: Data Table on Japan - Year-over-year growth 2023-2028 (%)
- Exhibits97: Chart on UK - Market size and forecast 2023-2028 ($ million)
- Exhibits98: Data Table on UK - Market size and forecast 2023-2028 ($ million)
- Exhibits99: Chart on UK - Year-over-year growth 2023-2028 (%)
- Exhibits100: Data Table on UK - Year-over-year growth 2023-2028 (%)
- Exhibits101: Chart on Iran - Market size and forecast 2023-2028 ($ million)
- Exhibits102: Data Table on Iran - Market size and forecast 2023-2028 ($ million)
- Exhibits103: Chart on Iran - Year-over-year growth 2023-2028 (%)
- Exhibits104: Data Table on Iran - Year-over-year growth 2023-2028 (%)
- Exhibits105: Market opportunity By Geographical Landscape ($ million)
- Exhibits106: Data Tables on Market opportunity By Geographical Landscape ($ million)
- Exhibits107: Impact of drivers and challenges in 2023 and 2028
- Exhibits108: Overview on criticality of inputs and factors of differentiation
- Exhibits109: Overview on factors of disruption
- Exhibits110: Impact of key risks on business
- Exhibits111: Companies covered
- Exhibits112: Matrix on companies position and classification
- Exhibits113: BAE Systems Plc - Overview
- Exhibits114: BAE Systems Plc - Business segments
- Exhibits115: BAE Systems Plc - Key news
- Exhibits116: BAE Systems Plc - Key offerings
- Exhibits117: BAE Systems Plc - Segment focus
- Exhibits118: China Shipbuilding Trading Co. Ltd. - Overview
- Exhibits119: China Shipbuilding Trading Co. Ltd. - Product / Service
- Exhibits120: China Shipbuilding Trading Co. Ltd. - Key offerings
- Exhibits121: CONSTRUCTIONS MECANIQUES DE NORMANDIE - Overview
- Exhibits122: CONSTRUCTIONS MECANIQUES DE NORMANDIE - Product / Service
- Exhibits123: CONSTRUCTIONS MECANIQUES DE NORMANDIE - Key offerings
- Exhibits124: Daewoo Shipbuilding and Marine Engineering Co. Ltd. - Overview
- Exhibits125: Daewoo Shipbuilding and Marine Engineering Co. Ltd. - Product / Service
- Exhibits126: Daewoo Shipbuilding and Marine Engineering Co. Ltd. - Key offerings
- Exhibits127: Damen Shipyards Group - Overview
- Exhibits128: Damen Shipyards Group - Product / Service
- Exhibits129: Damen Shipyards Group - Key offerings
- Exhibits130: Fincantieri Spa - Overview
- Exhibits131: Fincantieri Spa - Business segments
- Exhibits132: Fincantieri Spa - Key offerings
- Exhibits133: Fincantieri Spa - Segment focus
- Exhibits134: Fr. Lurssen Werft GmbH - Overview
- Exhibits135: Fr. Lurssen Werft GmbH - Product / Service
- Exhibits136: Fr. Lurssen Werft GmbH - Key offerings
- Exhibits137: Garden Reach Shipbuilders and Engineers - Overview
- Exhibits138: Garden Reach Shipbuilders and Engineers - Product / Service
- Exhibits139: Garden Reach Shipbuilders and Engineers - Key offerings
- Exhibits140: Goa Shipyard Ltd. - Overview
- Exhibits141: Goa Shipyard Ltd. - Business segments
- Exhibits142: Goa Shipyard Ltd. - Key offerings
- Exhibits143: Goa Shipyard Ltd. - Segment focus
- Exhibits144: Hanjin Heavy Industries and Construction Holdings Co. Ltd. - Overview
- Exhibits145: Hanjin Heavy Industries and Construction Holdings Co. Ltd. - Product / Service
- Exhibits146: Hanjin Heavy Industries and Construction Holdings Co. Ltd. - Key offerings
- Exhibits147: Mitsubishi Heavy Industries Ltd. - Overview
- Exhibits148: Mitsubishi Heavy Industries Ltd. - Business segments
- Exhibits149: Mitsubishi Heavy Industries Ltd. - Key news
- Exhibits150: Mitsubishi Heavy Industries Ltd. - Key offerings
- Exhibits151: Mitsubishi Heavy Industries Ltd. - Segment focus
- Exhibits152: Navantia SA - Overview
- Exhibits153: Navantia SA - Product / Service
- Exhibits154: Navantia SA - Key offerings
- Exhibits155: Inclusions checklist
- Exhibits156: Exclusions checklist
- Exhibits157: Currency conversion rates for US$
- Exhibits158: Research methodology
- Exhibits159: Information sources
- Exhibits160: Data validation
- Exhibits161: Validation techniques employed for market sizing
- Exhibits162: Data synthesis
- Exhibits163: 360 degree market analysis
- Exhibits164: List of abbreviations
The fast attack craft (FAC) market is forecasted to grow by USD 1758.4 mn during 2023-2028, accelerating at a CAGR of 6.78% during the forecast period. The report on the fast attack craft (FAC) market provides a holistic analysis, market size and forecast, trends, growth drivers, and challenges, as well as vendor analysis covering around 25 vendors.
The report offers an up-to-date analysis regarding the current market scenario, the latest trends and drivers, and the overall market environment. The market is driven by greater focus on isr operations, rising geopolitical tensions between countries, and increase in defense budgets.
Technavio's fast attack craft (FAC) market is segmented as below:
| Market Scope | |
|---|---|
| Base Year | 2024 |
| End Year | 2028 |
| Series Year | 2024-2028 |
| Growth Momentum | Accelerate |
| YOY 2024 | 6.23% |
| CAGR | 6.78% |
| Incremental Value | $1758.4 mn |
By Application
- National defense
- Technical research
By Type
- Missile-armed FAC
- Non-missile armed FAC
By Geographical Landscape
- North America
- Europe
- APAC
- Middle East and Africa
- South America
This study identifies the increasing demand for warships as one of the prime reasons driving the fast attack craft (FAC) market growth during the next few years. Also, advances in fast attack craft and organic growth strategies by vendors will lead to sizable demand in the market.
The report on the fast attack craft (FAC) market covers the following areas:
- Fast attack craft (FAC) market sizing
- Fast attack craft (FAC) market forecast
- Fast attack craft (FAC) market industry analysis
The robust vendor analysis is designed to help clients improve their market position, and in line with this, this report provides a detailed analysis of several leading fast attack craft (FAC) market vendors that include BAE Systems PLC, China Shipbuilding Trading Co. Ltd., CONSTRUCTIONS MECANIQUES DE NORMANDIE, Daewoo Shipbuilding and Marine Engineering Co. Ltd., Damen Shipyards Group, Fincantieri Spa, Fr. Lurssen Werft GmbH, Garden Reach Shipbuilders and Engineers, Goa Shipyard Ltd., Hanjin Heavy Industries and Construction Holdings Co. Ltd., Mitsubishi Heavy Industries Ltd., and Navantia SA. Also, the fast attack craft (FAC) market analysis report includes information on upcoming trends and challenges that will influence market growth. This is to help companies strategize and leverage all forthcoming growth opportunities.
The study was conducted using an objective combination of primary and secondary information including inputs from key participants in the industry. The report contains a comprehensive market and vendor landscape in addition to an analysis of the key vendors.
The publisher presents a detailed picture of the market by the way of study, synthesis, and summation of data from multiple sources by an analysis of key parameters such as profit, pricing, competition, and promotions. It presents various market facets by identifying the key industry influencers. The data presented is comprehensive, reliable, and a result of extensive research - both primary and secondary. The market research reports provide a complete competitive landscape and an in-depth vendor selection methodology and analysis using qualitative and quantitative research to forecast the accurate market growth.
Table of Contents
1 Executive Summary
- 1.1 Market overview
- Executive Summary - Chart on Market Overview
- Executive Summary - Data Table on Market Overview
- Executive Summary - Chart on Global Market Characteristics
- Executive Summary - Chart on Market By Geographical Landscape
- Executive Summary - Chart on Market Segmentation by Application
- Executive Summary - Chart on Market Segmentation by Type
- Executive Summary - Chart on Incremental Growth
- Executive Summary - Data Table on Incremental Growth
- Executive Summary - Chart on Company Market Positioning
2 Market Landscape
- 2.1 Market ecosystem
- Parent Market
- Data Table on - Parent Market
- 2.2 Market characteristics
- Market characteristics analysis
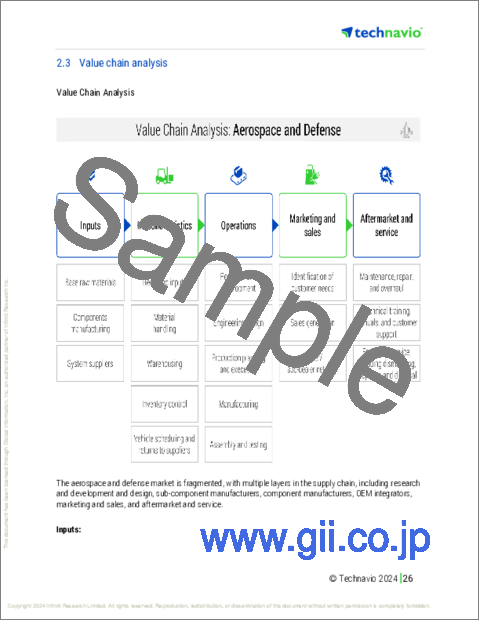
- 2.3 Value chain analysis
- Value Chain Analysis
3 Market Sizing
- 3.1 Market definition
- Offerings of companies included in the market definition
- 3.2 Market segment analysis
- Market segments
- 3.3 Market size 2023
- 3.4 Market outlook: Forecast for 2023-2028
- Chart on Global - Market size and forecast 2023-2028 ($ million)
- Data Table on Global - Market size and forecast 2023-2028 ($ million)
- Chart on Global Market: Year-over-year growth 2023-2028 (%)
- Data Table on Global Market: Year-over-year growth 2023-2028 (%)
4 Historic Market Size
- 4.1 Global Fast Attack Craft (FAC) Market 2018 - 2022
- Historic Market Size - Data Table on Global Fast Attack Craft (FAC) Market 2018 - 2022 ($ million)
- 4.2 Application segment analysis 2018 - 2022
- Historic Market Size - Application Segment 2018 - 2022 ($ million)
- 4.3 Type segment analysis 2018 - 2022
- Historic Market Size - Type Segment 2018 - 2022 ($ million)
- 4.4 Geography segment analysis 2018 - 2022
- Historic Market Size - Geography Segment 2018 - 2022 ($ million)
- 4.5 Country segment analysis 2018 - 2022
- Historic Market Size - Country Segment 2018 - 2022 ($ million)
5 Five Forces Analysis
- 5.1 Five forces summary
- Five forces analysis - Comparison between 2023 and 2028
- 5.2 Bargaining power of buyers
- Bargaining power of buyers - Impact of key factors 2023 and 2028
- 5.3 Bargaining power of suppliers
- Bargaining power of suppliers - Impact of key factors in 2023 and 2028
- 5.4 Threat of new entrants
- Threat of new entrants - Impact of key factors in 2023 and 2028
- 5.5 Threat of substitutes
- Threat of substitutes - Impact of key factors in 2023 and 2028
- 5.6 Threat of rivalry
- Threat of rivalry - Impact of key factors in 2023 and 2028
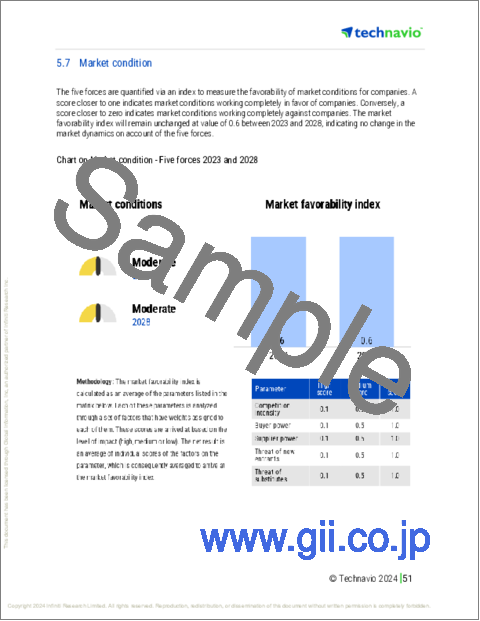
- 5.7 Market condition
- Chart on Market condition - Five forces 2023 and 2028
6 Market Segmentation by Application
- 6.1 Market segments
- Chart on Application - Market share 2023-2028 (%)
- Data Table on Application - Market share 2023-2028 (%)
- 6.2 Comparison by Application
- Chart on Comparison by Application
- Data Table on Comparison by Application
- 6.3 National defense - Market size and forecast 2023-2028
- Chart on National defense - Market size and forecast 2023-2028 ($ million)
- Data Table on National defense - Market size and forecast 2023-2028 ($ million)
- Chart on National defense - Year-over-year growth 2023-2028 (%)
- Data Table on National defense - Year-over-year growth 2023-2028 (%)
- 6.4 Technical research - Market size and forecast 2023-2028
- Chart on Technical research - Market size and forecast 2023-2028 ($ million)
- Data Table on Technical research - Market size and forecast 2023-2028 ($ million)
- Chart on Technical research - Year-over-year growth 2023-2028 (%)
- Data Table on Technical research - Year-over-year growth 2023-2028 (%)
- 6.5 Market opportunity by Application
- Market opportunity by Application ($ million)
- Data Table on Market opportunity by Application ($ million)
7 Market Segmentation by Type
- 7.1 Market segments
- Chart on Type - Market share 2023-2028 (%)
- Data Table on Type - Market share 2023-2028 (%)
- 7.2 Comparison by Type
- Chart on Comparison by Type
- Data Table on Comparison by Type
- 7.3 Missile-armed FAC - Market size and forecast 2023-2028
- Chart on Missile-armed FAC - Market size and forecast 2023-2028 ($ million)
- Data Table on Missile-armed FAC - Market size and forecast 2023-2028 ($ million)
- Chart on Missile-armed FAC - Year-over-year growth 2023-2028 (%)
- Data Table on Missile-armed FAC - Year-over-year growth 2023-2028 (%)
- 7.4 Non-missile armed FAC - Market size and forecast 2023-2028
- Chart on Non-missile armed FAC - Market size and forecast 2023-2028 ($ million)
- Data Table on Non-missile armed FAC - Market size and forecast 2023-2028 ($ million)
- Chart on Non-missile armed FAC - Year-over-year growth 2023-2028 (%)
- Data Table on Non-missile armed FAC - Year-over-year growth 2023-2028 (%)
- 7.5 Market opportunity by Type
- Market opportunity by Type ($ million)
- Data Table on Market opportunity by Type ($ million)
8 Customer Landscape
- 8.1 Customer landscape overview
- Analysis of price sensitivity, lifecycle, customer purchase basket, adoption rates, and purchase criteria
9 Geographic Landscape
- 9.1 Geographic segmentation
- Chart on Market share By Geographical Landscape 2023-2028 (%)
- Data Table on Market share By Geographical Landscape 2023-2028 (%)
- 9.2 Geographic comparison
- Chart on Geographic comparison
- Data Table on Geographic comparison
- 9.3 North America - Market size and forecast 2023-2028
- Chart on North America - Market size and forecast 2023-2028 ($ million)
- Data Table on North America - Market size and forecast 2023-2028 ($ million)
- Chart on North America - Year-over-year growth 2023-2028 (%)
- Data Table on North America - Year-over-year growth 2023-2028 (%)
- 9.4 Europe - Market size and forecast 2023-2028
- Chart on Europe - Market size and forecast 2023-2028 ($ million)
- Data Table on Europe - Market size and forecast 2023-2028 ($ million)
- Chart on Europe - Year-over-year growth 2023-2028 (%)
- Data Table on Europe - Year-over-year growth 2023-2028 (%)
- 9.5 APAC - Market size and forecast 2023-2028
- Chart on APAC - Market size and forecast 2023-2028 ($ million)
- Data Table on APAC - Market size and forecast 2023-2028 ($ million)
- Chart on APAC - Year-over-year growth 2023-2028 (%)
- Data Table on APAC - Year-over-year growth 2023-2028 (%)
- 9.6 Middle East and Africa - Market size and forecast 2023-2028
- Chart on Middle East and Africa - Market size and forecast 2023-2028 ($ million)
- Data Table on Middle East and Africa - Market size and forecast 2023-2028 ($ million)
- Chart on Middle East and Africa - Year-over-year growth 2023-2028 (%)
- Data Table on Middle East and Africa - Year-over-year growth 2023-2028 (%)
- 9.7 South America - Market size and forecast 2023-2028
- Chart on South America - Market size and forecast 2023-2028 ($ million)
- Data Table on South America - Market size and forecast 2023-2028 ($ million)
- Chart on South America - Year-over-year growth 2023-2028 (%)
- Data Table on South America - Year-over-year growth 2023-2028 (%)
- 9.8 US - Market size and forecast 2023-2028
- Chart on US - Market size and forecast 2023-2028 ($ million)
- Data Table on US - Market size and forecast 2023-2028 ($ million)
- Chart on US - Year-over-year growth 2023-2028 (%)
- Data Table on US - Year-over-year growth 2023-2028 (%)
- 9.9 China - Market size and forecast 2023-2028
- Chart on China - Market size and forecast 2023-2028 ($ million)
- Data Table on China - Market size and forecast 2023-2028 ($ million)
- Chart on China - Year-over-year growth 2023-2028 (%)
- Data Table on China - Year-over-year growth 2023-2028 (%)
- 9.10 Japan - Market size and forecast 2023-2028
- Chart on Japan - Market size and forecast 2023-2028 ($ million)
- Data Table on Japan - Market size and forecast 2023-2028 ($ million)
- Chart on Japan - Year-over-year growth 2023-2028 (%)
- Data Table on Japan - Year-over-year growth 2023-2028 (%)
- 9.11 UK - Market size and forecast 2023-2028
- Chart on UK - Market size and forecast 2023-2028 ($ million)
- Data Table on UK - Market size and forecast 2023-2028 ($ million)
- Chart on UK - Year-over-year growth 2023-2028 (%)
- Data Table on UK - Year-over-year growth 2023-2028 (%)
- 9.12 Iran - Market size and forecast 2023-2028
- Chart on Iran - Market size and forecast 2023-2028 ($ million)
- Data Table on Iran - Market size and forecast 2023-2028 ($ million)
- Chart on Iran - Year-over-year growth 2023-2028 (%)
- Data Table on Iran - Year-over-year growth 2023-2028 (%)
- 9.13 Market opportunity By Geographical Landscape
- Market opportunity By Geographical Landscape ($ million)
- Data Tables on Market opportunity By Geographical Landscape ($ million)
10 Drivers, Challenges, and Opportunity/Restraints
- 10.1 Market drivers
- 10.2 Market challenges
- 10.3 Impact of drivers and challenges
- Impact of drivers and challenges in 2023 and 2028
- 10.4 Market opportunities/restraints
11 Competitive Landscape
- 11.1 Overview
- 11.2 Competitive Landscape
- Overview on criticality of inputs and factors of differentiation
- 11.3 Landscape disruption
- Overview on factors of disruption
- 11.4 Industry risks
- Impact of key risks on business
12 Competitive Analysis
- 12.1 Companies profiled
- Companies covered
- 12.2 Market positioning of companies
- Matrix on companies position and classification
- 12.3 BAE Systems Plc
- BAE Systems Plc - Overview
- BAE Systems Plc - Business segments
- BAE Systems Plc - Key news
- BAE Systems Plc - Key offerings
- BAE Systems Plc - Segment focus
- 12.4 China Shipbuilding Trading Co. Ltd.
- China Shipbuilding Trading Co. Ltd. - Overview
- China Shipbuilding Trading Co. Ltd. - Product / Service
- China Shipbuilding Trading Co. Ltd. - Key offerings
- 12.5 CONSTRUCTIONS MECANIQUES DE NORMANDIE
- CONSTRUCTIONS MECANIQUES DE NORMANDIE - Overview
- CONSTRUCTIONS MECANIQUES DE NORMANDIE - Product / Service
- CONSTRUCTIONS MECANIQUES DE NORMANDIE - Key offerings
- 12.6 Daewoo Shipbuilding and Marine Engineering Co. Ltd.
- Daewoo Shipbuilding and Marine Engineering Co. Ltd. - Overview
- Daewoo Shipbuilding and Marine Engineering Co. Ltd. - Product / Service
- Daewoo Shipbuilding and Marine Engineering Co. Ltd. - Key offerings
- 12.7 Damen Shipyards Group
- Damen Shipyards Group - Overview
- Damen Shipyards Group - Product / Service
- Damen Shipyards Group - Key offerings
- 12.8 Fincantieri Spa
- Fincantieri Spa - Overview
- Fincantieri Spa - Business segments
- Fincantieri Spa - Key offerings
- Fincantieri Spa - Segment focus
- 12.9 Fr. Lurssen Werft GmbH
- Fr. Lurssen Werft GmbH - Overview
- Fr. Lurssen Werft GmbH - Product / Service
- Fr. Lurssen Werft GmbH - Key offerings
- 12.10 Garden Reach Shipbuilders and Engineers
- Garden Reach Shipbuilders and Engineers - Overview
- Garden Reach Shipbuilders and Engineers - Product / Service
- Garden Reach Shipbuilders and Engineers - Key offerings
- 12.11 Goa Shipyard Ltd.
- Goa Shipyard Ltd. - Overview
- Goa Shipyard Ltd. - Business segments
- Goa Shipyard Ltd. - Key offerings
- Goa Shipyard Ltd. - Segment focus
- 12.12 Hanjin Heavy Industries and Construction Holdings Co. Ltd.
- Hanjin Heavy Industries and Construction Holdings Co. Ltd. - Overview
- Hanjin Heavy Industries and Construction Holdings Co. Ltd. - Product / Service
- Hanjin Heavy Industries and Construction Holdings Co. Ltd. - Key offerings
- 12.13 Mitsubishi Heavy Industries Ltd.
- Mitsubishi Heavy Industries Ltd. - Overview
- Mitsubishi Heavy Industries Ltd. - Business segments
- Mitsubishi Heavy Industries Ltd. - Key news
- Mitsubishi Heavy Industries Ltd. - Key offerings
- Mitsubishi Heavy Industries Ltd. - Segment focus
- 12.14 Navantia SA
- Navantia SA - Overview
- Navantia SA - Product / Service
- Navantia SA - Key offerings
13 Appendix
- 13.1 Scope of the report
- 13.2 Inclusions and exclusions checklist
- Inclusions checklist
- Exclusions checklist
- 13.3 Currency conversion rates for US$
- Currency conversion rates for US$
- 13.4 Research methodology
- Research methodology
- 13.5 Data procurement
- Information sources
- 13.6 Data validation
- Data validation
- 13.7 Validation techniques employed for market sizing
- Validation techniques employed for market sizing
- 13.8 Data synthesis
- Data synthesis
- 13.9 360 degree market analysis
- 360 degree market analysis
- 13.10 List of abbreviations
- List of abbreviations

