|
|
市場調査レポート
商品コード
1557467
兵士システムの世界市場 2024年~2028年Global Soldier Systems Market 2024-2028 |
||||||

|
|||||||
カスタマイズ可能
|
|||||||


| 兵士システムの世界市場 2024年~2028年 |
|
出版日: 2024年08月16日
発行: TechNavio
ページ情報: 英文 185 Pages
納期: 即納可能
|

全表示
- 概要
- 図表
- 目次
兵士システム市場は2023年~2028年年に46億1,000万米ドル、予測期間中のCAGRは5.11%で成長すると予測されます。
当レポートでは、兵士システム市場の全体的な分析、市場規模・予測、動向、成長促進要因、課題、約25のベンダーを網羅したベンダー分析などを掲載しています。
現在の市場シナリオ、最新動向と促進要因、市場環境全体に関する最新分析を提供しています。市場は、軍事分野での展開の増加、スマートウェアラブルへの需要の高まり、新たな安全保障上の脅威に対抗するための防衛能力のアップグレードによって牽引されています。
| 市場範囲 | |
|---|---|
| 基準年 | 2024年 |
| 終了年 | 2028年 |
| 予測期間 | 2024年~2028年 |
| 成長モメンタム | 加速 |
| 前年比2024年 | 4.49% |
| CAGR | 5.11% |
| 増分額 | 46億1,000万米ドル |
本調査では、今後数年間の兵士システム市場成長を牽引する主な要因の1つとして、指向性エネルギー兵器(DEWS)の統合を挙げています。また、アクティブカモフラージュの採用や防衛用途におけるaiの浸透が進むことで、同市場は大きな需要につながります。
目次
第1章 エグゼクティブサマリー
- 市場概要
第2章 市場情勢
- 市場エコシステム
- 市場の特徴
- バリューチェーン分析
第3章 市場規模の評価
- 市場の定義
- 市場セグメント分析
- 市場規模 2023年
- 市場の見通し 2023年~2028年
第4章 市場規模実績
- 兵士システムの世界市場 2018年~2022年
- 用途別セグメント分析 2018年~2022年
- タイプセグメント分析 2018年~2022年
- 地域別セグメント分析 2018年~2022年
- 国別セグメント分析 2018年~2022年
第5章 ファイブフォース分析
- ファイブフォースの要約
- 買い手の交渉力
- 供給企業の交渉力
- 新規参入業者の脅威
- 代替品の脅威
- 競争の脅威
- 市況
第6章 市場セグメンテーション:用途別
- 市場セグメンテーション
- 比較:用途別
- 軍事:市場規模と予測 2023年~2028年
- 国土安全保障:市場規模と予測 2023年~2028年
- 市場機会:用途別
第7章 市場セグメンテーション:タイプ別
- 市場セグメンテーション
- 比較:タイプ別
- 個人の保護:市場規模と予測 2023年~2028年
- コミュニケーション:市場規模と予測 2023年~2028年
- 電力とデータのトランスミッション:市場規模と予測 2023年~2028年
- 監視とターゲット捕捉:市場規模と予測 2023年~2028年
- その他:市場規模と予測 2023年~2028年
- 市場機会:タイプ別
第8章 顧客情勢
- 顧客情勢の概要
第9章 地域別情勢
- 地域別セグメンテーション
- 地域別比較
- 北米:市場規模と予測 2023年~2028年
- 欧州:市場規模と予測 2023年~2028年
- アジア太平洋:市場規模と予測 2023年~2028年
- 中東・アフリカ:市場規模と予測 2023年~2028年
- 南米:市場規模と予測 2023年~2028年
- 米国:市場規模と予測 2023年~2028年
- ロシア:市場規模と予測 2023年~2028年
- 中国:市場規模と予測 2023年~2028年
- ドイツ:市場規模と予測 2023年~2028年
- カナダ:市場規模と予測 2023年~2028年
- 市場機会:地域情勢別
第10章 促進要因・課題・機会・抑制要因
- 市場促進要因
- 市場の課題
- 促進要因と課題の影響
- 市場の機会・抑制要因
第11章 競合情勢
- 概要
- 競合情勢
- 混乱の状況
- 業界のリスク
第12章 競合分析
- 企業プロファイル
- 企業の市場ポジショニング
- ASELSAN AS
- BAE Systems Plc
- Cisco Systems Inc.
- Elbit Systems Ltd.
- General Dynamics Corp.
- L3Harris Technologies Inc.
- Leonardo Spa
- Northrop Grumman Corp.
- RTX Corp.
- Rheinmetall AG
- Saab AB
- Singapore Technologies Engineering Ltd.
- Teledyne Technologies Inc.
- Thales Group
- Trijicon Inc.
第13章 付録
Exhibits:
- Exhibits1: Executive Summary - Chart on Market Overview
- Exhibits2: Executive Summary - Data Table on Market Overview
- Exhibits3: Executive Summary - Chart on Global Market Characteristics
- Exhibits4: Executive Summary - Chart on Market By Geographical Landscape
- Exhibits5: Executive Summary - Chart on Market Segmentation by Application
- Exhibits6: Executive Summary - Chart on Market Segmentation by Type
- Exhibits7: Executive Summary - Chart on Incremental Growth
- Exhibits8: Executive Summary - Data Table on Incremental Growth
- Exhibits9: Executive Summary - Chart on Company Market Positioning
- Exhibits10: Parent Market
- Exhibits11: Data Table on - Parent Market
- Exhibits12: Market characteristics analysis
- Exhibits13: Value Chain Analysis
- Exhibits14: Offerings of companies included in the market definition
- Exhibits15: Market segments
- Exhibits16: Chart on Global - Market size and forecast 2023-2028 ($ million)
- Exhibits17: Data Table on Global - Market size and forecast 2023-2028 ($ million)
- Exhibits18: Chart on Global Market: Year-over-year growth 2023-2028 (%)
- Exhibits19: Data Table on Global Market: Year-over-year growth 2023-2028 (%)
- Exhibits20: Historic Market Size - Data Table on Global Soldier Systems Market 2018 - 2022 ($ million)
- Exhibits21: Historic Market Size - Application Segment 2018 - 2022 ($ million)
- Exhibits22: Historic Market Size - Type Segment 2018 - 2022 ($ million)
- Exhibits23: Historic Market Size - Geography Segment 2018 - 2022 ($ million)
- Exhibits24: Historic Market Size - Country Segment 2018 - 2022 ($ million)
- Exhibits25: Five forces analysis - Comparison between 2023 and 2028
- Exhibits26: Bargaining power of buyers - Impact of key factors 2023 and 2028
- Exhibits27: Bargaining power of suppliers - Impact of key factors in 2023 and 2028
- Exhibits28: Threat of new entrants - Impact of key factors in 2023 and 2028
- Exhibits29: Threat of substitutes - Impact of key factors in 2023 and 2028
- Exhibits30: Threat of rivalry - Impact of key factors in 2023 and 2028
- Exhibits31: Chart on Market condition - Five forces 2023 and 2028
- Exhibits32: Chart on Application - Market share 2023-2028 (%)
- Exhibits33: Data Table on Application - Market share 2023-2028 (%)
- Exhibits34: Chart on Comparison by Application
- Exhibits35: Data Table on Comparison by Application
- Exhibits36: Chart on Military - Market size and forecast 2023-2028 ($ million)
- Exhibits37: Data Table on Military - Market size and forecast 2023-2028 ($ million)
- Exhibits38: Chart on Military - Year-over-year growth 2023-2028 (%)
- Exhibits39: Data Table on Military - Year-over-year growth 2023-2028 (%)
- Exhibits40: Chart on Homeland security - Market size and forecast 2023-2028 ($ million)
- Exhibits41: Data Table on Homeland security - Market size and forecast 2023-2028 ($ million)
- Exhibits42: Chart on Homeland security - Year-over-year growth 2023-2028 (%)
- Exhibits43: Data Table on Homeland security - Year-over-year growth 2023-2028 (%)
- Exhibits44: Market opportunity by Application ($ million)
- Exhibits45: Data Table on Market opportunity by Application ($ million)
- Exhibits46: Chart on Type - Market share 2023-2028 (%)
- Exhibits47: Data Table on Type - Market share 2023-2028 (%)
- Exhibits48: Chart on Comparison by Type
- Exhibits49: Data Table on Comparison by Type
- Exhibits50: Chart on Personal protection - Market size and forecast 2023-2028 ($ million)
- Exhibits51: Data Table on Personal protection - Market size and forecast 2023-2028 ($ million)
- Exhibits52: Chart on Personal protection - Year-over-year growth 2023-2028 (%)
- Exhibits53: Data Table on Personal protection - Year-over-year growth 2023-2028 (%)
- Exhibits54: Chart on Communication - Market size and forecast 2023-2028 ($ million)
- Exhibits55: Data Table on Communication - Market size and forecast 2023-2028 ($ million)
- Exhibits56: Chart on Communication - Year-over-year growth 2023-2028 (%)
- Exhibits57: Data Table on Communication - Year-over-year growth 2023-2028 (%)
- Exhibits58: Chart on Power and data transmission - Market size and forecast 2023-2028 ($ million)
- Exhibits59: Data Table on Power and data transmission - Market size and forecast 2023-2028 ($ million)
- Exhibits60: Chart on Power and data transmission - Year-over-year growth 2023-2028 (%)
- Exhibits61: Data Table on Power and data transmission - Year-over-year growth 2023-2028 (%)
- Exhibits62: Chart on Surveillance and target acquisition - Market size and forecast 2023-2028 ($ million)
- Exhibits63: Data Table on Surveillance and target acquisition - Market size and forecast 2023-2028 ($ million)
- Exhibits64: Chart on Surveillance and target acquisition - Year-over-year growth 2023-2028 (%)
- Exhibits65: Data Table on Surveillance and target acquisition - Year-over-year growth 2023-2028 (%)
- Exhibits66: Chart on Others - Market size and forecast 2023-2028 ($ million)
- Exhibits67: Data Table on Others - Market size and forecast 2023-2028 ($ million)
- Exhibits68: Chart on Others - Year-over-year growth 2023-2028 (%)
- Exhibits69: Data Table on Others - Year-over-year growth 2023-2028 (%)
- Exhibits70: Market opportunity by Type ($ million)
- Exhibits71: Data Table on Market opportunity by Type ($ million)
- Exhibits72: Analysis of price sensitivity, lifecycle, customer purchase basket, adoption rates, and purchase criteria
- Exhibits73: Chart on Market share By Geographical Landscape 2023-2028 (%)
- Exhibits74: Data Table on Market share By Geographical Landscape 2023-2028 (%)
- Exhibits75: Chart on Geographic comparison
- Exhibits76: Data Table on Geographic comparison
- Exhibits77: Chart on North America - Market size and forecast 2023-2028 ($ million)
- Exhibits78: Data Table on North America - Market size and forecast 2023-2028 ($ million)
- Exhibits79: Chart on North America - Year-over-year growth 2023-2028 (%)
- Exhibits80: Data Table on North America - Year-over-year growth 2023-2028 (%)
- Exhibits81: Chart on Europe - Market size and forecast 2023-2028 ($ million)
- Exhibits82: Data Table on Europe - Market size and forecast 2023-2028 ($ million)
- Exhibits83: Chart on Europe - Year-over-year growth 2023-2028 (%)
- Exhibits84: Data Table on Europe - Year-over-year growth 2023-2028 (%)
- Exhibits85: Chart on APAC - Market size and forecast 2023-2028 ($ million)
- Exhibits86: Data Table on APAC - Market size and forecast 2023-2028 ($ million)
- Exhibits87: Chart on APAC - Year-over-year growth 2023-2028 (%)
- Exhibits88: Data Table on APAC - Year-over-year growth 2023-2028 (%)
- Exhibits89: Chart on Middle East and Africa - Market size and forecast 2023-2028 ($ million)
- Exhibits90: Data Table on Middle East and Africa - Market size and forecast 2023-2028 ($ million)
- Exhibits91: Chart on Middle East and Africa - Year-over-year growth 2023-2028 (%)
- Exhibits92: Data Table on Middle East and Africa - Year-over-year growth 2023-2028 (%)
- Exhibits93: Chart on South America - Market size and forecast 2023-2028 ($ million)
- Exhibits94: Data Table on South America - Market size and forecast 2023-2028 ($ million)
- Exhibits95: Chart on South America - Year-over-year growth 2023-2028 (%)
- Exhibits96: Data Table on South America - Year-over-year growth 2023-2028 (%)
- Exhibits97: Chart on US - Market size and forecast 2023-2028 ($ million)
- Exhibits98: Data Table on US - Market size and forecast 2023-2028 ($ million)
- Exhibits99: Chart on US - Year-over-year growth 2023-2028 (%)
- Exhibits100: Data Table on US - Year-over-year growth 2023-2028 (%)
- Exhibits101: Chart on Russia - Market size and forecast 2023-2028 ($ million)
- Exhibits102: Data Table on Russia - Market size and forecast 2023-2028 ($ million)
- Exhibits103: Chart on Russia - Year-over-year growth 2023-2028 (%)
- Exhibits104: Data Table on Russia - Year-over-year growth 2023-2028 (%)
- Exhibits105: Chart on China - Market size and forecast 2023-2028 ($ million)
- Exhibits106: Data Table on China - Market size and forecast 2023-2028 ($ million)
- Exhibits107: Chart on China - Year-over-year growth 2023-2028 (%)
- Exhibits108: Data Table on China - Year-over-year growth 2023-2028 (%)
- Exhibits109: Chart on Germany - Market size and forecast 2023-2028 ($ million)
- Exhibits110: Data Table on Germany - Market size and forecast 2023-2028 ($ million)
- Exhibits111: Chart on Germany - Year-over-year growth 2023-2028 (%)
- Exhibits112: Data Table on Germany - Year-over-year growth 2023-2028 (%)
- Exhibits113: Chart on Canada - Market size and forecast 2023-2028 ($ million)
- Exhibits114: Data Table on Canada - Market size and forecast 2023-2028 ($ million)
- Exhibits115: Chart on Canada - Year-over-year growth 2023-2028 (%)
- Exhibits116: Data Table on Canada - Year-over-year growth 2023-2028 (%)
- Exhibits117: Market opportunity By Geographical Landscape ($ million)
- Exhibits118: Data Tables on Market opportunity By Geographical Landscape ($ million)
- Exhibits119: Impact of drivers and challenges in 2023 and 2028
- Exhibits120: Overview on criticality of inputs and factors of differentiation
- Exhibits121: Overview on factors of disruption
- Exhibits122: Impact of key risks on business
- Exhibits123: Companies covered
- Exhibits124: Matrix on companies position and classification
- Exhibits125: ASELSAN AS - Overview
- Exhibits126: ASELSAN AS - Product / Service
- Exhibits127: ASELSAN AS - Key offerings
- Exhibits128: BAE Systems Plc - Overview
- Exhibits129: BAE Systems Plc - Business segments
- Exhibits130: BAE Systems Plc - Key news
- Exhibits131: BAE Systems Plc - Key offerings
- Exhibits132: BAE Systems Plc - Segment focus
- Exhibits133: Cisco Systems Inc. - Overview
- Exhibits134: Cisco Systems Inc. - Business segments
- Exhibits135: Cisco Systems Inc. - Key news
- Exhibits136: Cisco Systems Inc. - Key offerings
- Exhibits137: Cisco Systems Inc. - Segment focus
- Exhibits138: Elbit Systems Ltd. - Overview
- Exhibits139: Elbit Systems Ltd. - Product / Service
- Exhibits140: Elbit Systems Ltd. - Key news
- Exhibits141: Elbit Systems Ltd. - Key offerings
- Exhibits142: General Dynamics Corp. - Overview
- Exhibits143: General Dynamics Corp. - Business segments
- Exhibits144: General Dynamics Corp. - Key news
- Exhibits145: General Dynamics Corp. - Key offerings
- Exhibits146: General Dynamics Corp. - Segment focus
- Exhibits147: L3Harris Technologies Inc. - Overview
- Exhibits148: L3Harris Technologies Inc. - Business segments
- Exhibits149: L3Harris Technologies Inc. - Key news
- Exhibits150: L3Harris Technologies Inc. - Key offerings
- Exhibits151: L3Harris Technologies Inc. - Segment focus
- Exhibits152: Leonardo Spa - Overview
- Exhibits153: Leonardo Spa - Business segments
- Exhibits154: Leonardo Spa - Key news
- Exhibits155: Leonardo Spa - Key offerings
- Exhibits156: Leonardo Spa - Segment focus
- Exhibits157: Northrop Grumman Corp. - Overview
- Exhibits158: Northrop Grumman Corp. - Business segments
- Exhibits159: Northrop Grumman Corp. - Key news
- Exhibits160: Northrop Grumman Corp. - Key offerings
- Exhibits161: Northrop Grumman Corp. - Segment focus
- Exhibits162: RTX Corp. - Overview
- Exhibits163: RTX Corp. - Business segments
- Exhibits164: RTX Corp. - Key news
- Exhibits165: RTX Corp. - Key offerings
- Exhibits166: RTX Corp. - Segment focus
- Exhibits167: Rheinmetall AG - Overview
- Exhibits168: Rheinmetall AG - Business segments
- Exhibits169: Rheinmetall AG - Key news
- Exhibits170: Rheinmetall AG - Key offerings
- Exhibits171: Rheinmetall AG - Segment focus
- Exhibits172: Saab AB - Overview
- Exhibits173: Saab AB - Business segments
- Exhibits174: Saab AB - Key news
- Exhibits175: Saab AB - Key offerings
- Exhibits176: Saab AB - Segment focus
- Exhibits177: Singapore Technologies Engineering Ltd. - Overview
- Exhibits178: Singapore Technologies Engineering Ltd. - Business segments
- Exhibits179: Singapore Technologies Engineering Ltd. - Key news
- Exhibits180: Singapore Technologies Engineering Ltd. - Key offerings
- Exhibits181: Singapore Technologies Engineering Ltd. - Segment focus
- Exhibits182: Teledyne Technologies Inc. - Overview
- Exhibits183: Teledyne Technologies Inc. - Business segments
- Exhibits184: Teledyne Technologies Inc. - Key news
- Exhibits185: Teledyne Technologies Inc. - Key offerings
- Exhibits186: Teledyne Technologies Inc. - Segment focus
- Exhibits187: Thales Group - Overview
- Exhibits188: Thales Group - Business segments
- Exhibits189: Thales Group - Key news
- Exhibits190: Thales Group - Key offerings
- Exhibits191: Thales Group - Segment focus
- Exhibits192: Trijicon Inc. - Overview
- Exhibits193: Trijicon Inc. - Product / Service
- Exhibits194: Trijicon Inc. - Key offerings
- Exhibits195: Inclusions checklist
- Exhibits196: Exclusions checklist
- Exhibits197: Currency conversion rates for US$
- Exhibits198: Research methodology
- Exhibits199: Information sources
- Exhibits200: Data validation
- Exhibits201: Validation techniques employed for market sizing
- Exhibits202: Data synthesis
- Exhibits203: 360 degree market analysis
- Exhibits204: List of abbreviations
The soldier systems market is forecasted to grow by USD 4610 mn during 2023-2028, accelerating at a CAGR of 5.11% during the forecast period. The report on the soldier systems market provides a holistic analysis, market size and forecast, trends, growth drivers, and challenges, as well as vendor analysis covering around 25 vendors.
The report offers an up-to-date analysis regarding the current market scenario, the latest trends and drivers, and the overall market environment. The market is driven by increased deployment by military segment, rising demand for smart wearables, and upgrade of defense capabilities to counter emerging security threats.
Technavio's soldier systems market is segmented as below:
| Market Scope | |
|---|---|
| Base Year | 2024 |
| End Year | 2028 |
| Series Year | 2024-2028 |
| Growth Momentum | Accelerate |
| YOY 2024 | 4.49% |
| CAGR | 5.11% |
| Incremental Value | $4610 mn |
By Application
- Military
- Homeland security
By Type
- Personal protection
- Communication
- Power and data transmission
- Surveillance and target acquisition
- Others
By Geographical Landscape
- North America
- Europe
- APAC
- Middle East and Africa
- South America
This study identifies the integration of directed-energy weapons (dews) as one of the prime reasons driving the soldier systems market growth during the next few years. Also, adoption of active camouflage and increasing penetration of ai in defense applications will lead to sizable demand in the market.
The report on the soldier systems market covers the following areas:
- Soldier systems market sizing
- Soldier systems market forecast
- Soldier systems market industry analysis
The robust vendor analysis is designed to help clients improve their market position, and in line with this, this report provides a detailed analysis of several leading soldier systems market vendors that include ASELSAN AS, BAE Systems Plc, BERETTA HOLDING SA, Cisco Systems Inc., Elbit Systems Ltd., General Dynamics Corp., L3Harris Technologies Inc., Leonardo Spa, Mayflower Communications Co. Inc., Northrop Grumman Corp., RTX Corp., Rheinmetall AG, Saab AB, Shoghi Communications Ltd., Singapore Technologies Engineering Ltd., Stumpp Schuele and Somappa Springs Pvt. Ltd., Teledyne Technologies Inc., Thales Group, and Trijicon Inc.. Also, the soldier systems market analysis report includes information on upcoming trends and challenges that will influence market growth. This is to help companies strategize and leverage all forthcoming growth opportunities.
The study was conducted using an objective combination of primary and secondary information including inputs from key participants in the industry. The report contains a comprehensive market and vendor landscape in addition to an analysis of the key vendors.
The publisher presents a detailed picture of the market by the way of study, synthesis, and summation of data from multiple sources by an analysis of key parameters such as profit, pricing, competition, and promotions. It presents various market facets by identifying the key industry influencers. The data presented is comprehensive, reliable, and a result of extensive research - both primary and secondary. The market research reports provide a complete competitive landscape and an in-depth vendor selection methodology and analysis using qualitative and quantitative research to forecast the accurate market growth.
Table of Contents
1 Executive Summary
- 1.1 Market overview
- Executive Summary - Chart on Market Overview
- Executive Summary - Data Table on Market Overview
- Executive Summary - Chart on Global Market Characteristics
- Executive Summary - Chart on Market By Geographical Landscape
- Executive Summary - Chart on Market Segmentation by Application
- Executive Summary - Chart on Market Segmentation by Type
- Executive Summary - Chart on Incremental Growth
- Executive Summary - Data Table on Incremental Growth
- Executive Summary - Chart on Company Market Positioning
2 Market Landscape
- 2.1 Market ecosystem
- Parent Market
- Data Table on - Parent Market
- 2.2 Market characteristics
- Market characteristics analysis
- 2.3 Value chain analysis
- Value Chain Analysis
3 Market Sizing
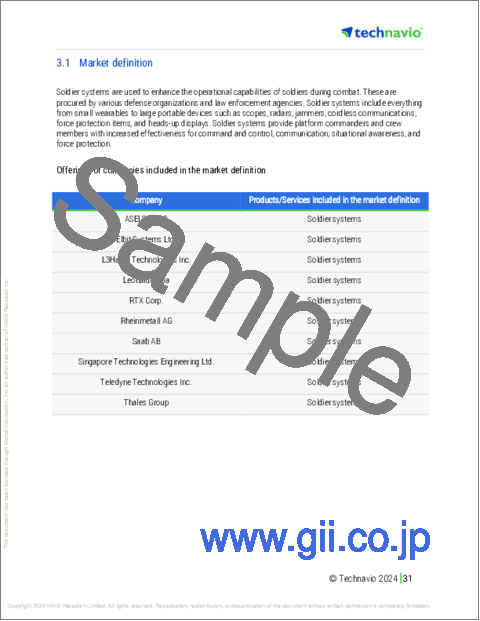
- 3.1 Market definition
- Offerings of companies included in the market definition
- 3.2 Market segment analysis
- Market segments
- 3.3 Market size 2023
- 3.4 Market outlook: Forecast for 2023-2028
- Chart on Global - Market size and forecast 2023-2028 ($ million)
- Data Table on Global - Market size and forecast 2023-2028 ($ million)
- Chart on Global Market: Year-over-year growth 2023-2028 (%)
- Data Table on Global Market: Year-over-year growth 2023-2028 (%)
4 Historic Market Size
- 4.1 Global Soldier Systems Market 2018 - 2022
- Historic Market Size - Data Table on Global Soldier Systems Market 2018 - 2022 ($ million)
- 4.2 Application segment analysis 2018 - 2022
- Historic Market Size - Application Segment 2018 - 2022 ($ million)
- 4.3 Type segment analysis 2018 - 2022
- Historic Market Size - Type Segment 2018 - 2022 ($ million)
- 4.4 Geography segment analysis 2018 - 2022
- Historic Market Size - Geography Segment 2018 - 2022 ($ million)
- 4.5 Country segment analysis 2018 - 2022
- Historic Market Size - Country Segment 2018 - 2022 ($ million)
5 Five Forces Analysis
- 5.1 Five forces summary
- Five forces analysis - Comparison between 2023 and 2028
- 5.2 Bargaining power of buyers
- Bargaining power of buyers - Impact of key factors 2023 and 2028
- 5.3 Bargaining power of suppliers
- Bargaining power of suppliers - Impact of key factors in 2023 and 2028
- 5.4 Threat of new entrants
- Threat of new entrants - Impact of key factors in 2023 and 2028
- 5.5 Threat of substitutes
- Threat of substitutes - Impact of key factors in 2023 and 2028
- 5.6 Threat of rivalry
- Threat of rivalry - Impact of key factors in 2023 and 2028
- 5.7 Market condition
- Chart on Market condition - Five forces 2023 and 2028
6 Market Segmentation by Application
- 6.1 Market segments
- Chart on Application - Market share 2023-2028 (%)
- Data Table on Application - Market share 2023-2028 (%)
- 6.2 Comparison by Application
- Chart on Comparison by Application
- Data Table on Comparison by Application
- 6.3 Military - Market size and forecast 2023-2028
- Chart on Military - Market size and forecast 2023-2028 ($ million)
- Data Table on Military - Market size and forecast 2023-2028 ($ million)
- Chart on Military - Year-over-year growth 2023-2028 (%)
- Data Table on Military - Year-over-year growth 2023-2028 (%)
- 6.4 Homeland security - Market size and forecast 2023-2028
- Chart on Homeland security - Market size and forecast 2023-2028 ($ million)
- Data Table on Homeland security - Market size and forecast 2023-2028 ($ million)
- Chart on Homeland security - Year-over-year growth 2023-2028 (%)
- Data Table on Homeland security - Year-over-year growth 2023-2028 (%)
- 6.5 Market opportunity by Application
- Market opportunity by Application ($ million)
- Data Table on Market opportunity by Application ($ million)
7 Market Segmentation by Type
- 7.1 Market segments
- Chart on Type - Market share 2023-2028 (%)
- Data Table on Type - Market share 2023-2028 (%)
- 7.2 Comparison by Type
- Chart on Comparison by Type
- Data Table on Comparison by Type
- 7.3 Personal protection - Market size and forecast 2023-2028
- Chart on Personal protection - Market size and forecast 2023-2028 ($ million)
- Data Table on Personal protection - Market size and forecast 2023-2028 ($ million)
- Chart on Personal protection - Year-over-year growth 2023-2028 (%)
- Data Table on Personal protection - Year-over-year growth 2023-2028 (%)
- 7.4 Communication - Market size and forecast 2023-2028
- Chart on Communication - Market size and forecast 2023-2028 ($ million)
- Data Table on Communication - Market size and forecast 2023-2028 ($ million)
- Chart on Communication - Year-over-year growth 2023-2028 (%)
- Data Table on Communication - Year-over-year growth 2023-2028 (%)
- 7.5 Power and data transmission - Market size and forecast 2023-2028
- Chart on Power and data transmission - Market size and forecast 2023-2028 ($ million)
- Data Table on Power and data transmission - Market size and forecast 2023-2028 ($ million)
- Chart on Power and data transmission - Year-over-year growth 2023-2028 (%)
- Data Table on Power and data transmission - Year-over-year growth 2023-2028 (%)
- 7.6 Surveillance and target acquisition - Market size and forecast 2023-2028
- Chart on Surveillance and target acquisition - Market size and forecast 2023-2028 ($ million)
- Data Table on Surveillance and target acquisition - Market size and forecast 2023-2028 ($ million)
- Chart on Surveillance and target acquisition - Year-over-year growth 2023-2028 (%)
- Data Table on Surveillance and target acquisition - Year-over-year growth 2023-2028 (%)
- 7.7 Others - Market size and forecast 2023-2028
- Chart on Others - Market size and forecast 2023-2028 ($ million)
- Data Table on Others - Market size and forecast 2023-2028 ($ million)
- Chart on Others - Year-over-year growth 2023-2028 (%)
- Data Table on Others - Year-over-year growth 2023-2028 (%)
- 7.8 Market opportunity by Type
- Market opportunity by Type ($ million)
- Data Table on Market opportunity by Type ($ million)
8 Customer Landscape
- 8.1 Customer landscape overview
- Analysis of price sensitivity, lifecycle, customer purchase basket, adoption rates, and purchase criteria
9 Geographic Landscape
- 9.1 Geographic segmentation
- Chart on Market share By Geographical Landscape 2023-2028 (%)
- Data Table on Market share By Geographical Landscape 2023-2028 (%)
- 9.2 Geographic comparison
- Chart on Geographic comparison
- Data Table on Geographic comparison
- 9.3 North America - Market size and forecast 2023-2028
- Chart on North America - Market size and forecast 2023-2028 ($ million)
- Data Table on North America - Market size and forecast 2023-2028 ($ million)
- Chart on North America - Year-over-year growth 2023-2028 (%)
- Data Table on North America - Year-over-year growth 2023-2028 (%)
- 9.4 Europe - Market size and forecast 2023-2028
- Chart on Europe - Market size and forecast 2023-2028 ($ million)
- Data Table on Europe - Market size and forecast 2023-2028 ($ million)
- Chart on Europe - Year-over-year growth 2023-2028 (%)
- Data Table on Europe - Year-over-year growth 2023-2028 (%)
- 9.5 APAC - Market size and forecast 2023-2028
- Chart on APAC - Market size and forecast 2023-2028 ($ million)
- Data Table on APAC - Market size and forecast 2023-2028 ($ million)
- Chart on APAC - Year-over-year growth 2023-2028 (%)
- Data Table on APAC - Year-over-year growth 2023-2028 (%)
- 9.6 Middle East and Africa - Market size and forecast 2023-2028
- Chart on Middle East and Africa - Market size and forecast 2023-2028 ($ million)
- Data Table on Middle East and Africa - Market size and forecast 2023-2028 ($ million)
- Chart on Middle East and Africa - Year-over-year growth 2023-2028 (%)
- Data Table on Middle East and Africa - Year-over-year growth 2023-2028 (%)
- 9.7 South America - Market size and forecast 2023-2028
- Chart on South America - Market size and forecast 2023-2028 ($ million)
- Data Table on South America - Market size and forecast 2023-2028 ($ million)
- Chart on South America - Year-over-year growth 2023-2028 (%)
- Data Table on South America - Year-over-year growth 2023-2028 (%)
- 9.8 US - Market size and forecast 2023-2028
- Chart on US - Market size and forecast 2023-2028 ($ million)
- Data Table on US - Market size and forecast 2023-2028 ($ million)
- Chart on US - Year-over-year growth 2023-2028 (%)
- Data Table on US - Year-over-year growth 2023-2028 (%)
- 9.9 Russia - Market size and forecast 2023-2028
- Chart on Russia - Market size and forecast 2023-2028 ($ million)
- Data Table on Russia - Market size and forecast 2023-2028 ($ million)
- Chart on Russia - Year-over-year growth 2023-2028 (%)
- Data Table on Russia - Year-over-year growth 2023-2028 (%)
- 9.10 China - Market size and forecast 2023-2028
- Chart on China - Market size and forecast 2023-2028 ($ million)
- Data Table on China - Market size and forecast 2023-2028 ($ million)
- Chart on China - Year-over-year growth 2023-2028 (%)
- Data Table on China - Year-over-year growth 2023-2028 (%)
- 9.11 Germany - Market size and forecast 2023-2028
- Chart on Germany - Market size and forecast 2023-2028 ($ million)
- Data Table on Germany - Market size and forecast 2023-2028 ($ million)
- Chart on Germany - Year-over-year growth 2023-2028 (%)
- Data Table on Germany - Year-over-year growth 2023-2028 (%)
- 9.12 Canada - Market size and forecast 2023-2028
- Chart on Canada - Market size and forecast 2023-2028 ($ million)
- Data Table on Canada - Market size and forecast 2023-2028 ($ million)
- Chart on Canada - Year-over-year growth 2023-2028 (%)
- Data Table on Canada - Year-over-year growth 2023-2028 (%)
- 9.13 Market opportunity By Geographical Landscape
- Market opportunity By Geographical Landscape ($ million)
- Data Tables on Market opportunity By Geographical Landscape ($ million)
10 Drivers, Challenges, and Opportunity/Restraints
- 10.1 Market drivers
- 10.2 Market challenges
- 10.3 Impact of drivers and challenges
- Impact of drivers and challenges in 2023 and 2028
- 10.4 Market opportunities/restraints
11 Competitive Landscape
- 11.1 Overview
- 11.2 Competitive Landscape
- Overview on criticality of inputs and factors of differentiation
- 11.3 Landscape disruption
- Overview on factors of disruption
- 11.4 Industry risks
- Impact of key risks on business
12 Competitive Analysis
- 12.1 Companies profiled
- Companies covered
- 12.2 Market positioning of companies
- Matrix on companies position and classification
- 12.3 ASELSAN AS
- ASELSAN AS - Overview
- ASELSAN AS - Product / Service
- ASELSAN AS - Key offerings
- 12.4 BAE Systems Plc
- BAE Systems Plc - Overview
- BAE Systems Plc - Business segments
- BAE Systems Plc - Key news
- BAE Systems Plc - Key offerings
- BAE Systems Plc - Segment focus
- 12.5 Cisco Systems Inc.
- Cisco Systems Inc. - Overview
- Cisco Systems Inc. - Business segments
- Cisco Systems Inc. - Key news
- Cisco Systems Inc. - Key offerings
- Cisco Systems Inc. - Segment focus
- 12.6 Elbit Systems Ltd.
- Elbit Systems Ltd. - Overview
- Elbit Systems Ltd. - Product / Service
- Elbit Systems Ltd. - Key news
- Elbit Systems Ltd. - Key offerings
- 12.7 General Dynamics Corp.
- General Dynamics Corp. - Overview
- General Dynamics Corp. - Business segments
- General Dynamics Corp. - Key news
- General Dynamics Corp. - Key offerings
- General Dynamics Corp. - Segment focus
- 12.8 L3Harris Technologies Inc.
- L3Harris Technologies Inc. - Overview
- L3Harris Technologies Inc. - Business segments
- L3Harris Technologies Inc. - Key news
- L3Harris Technologies Inc. - Key offerings
- L3Harris Technologies Inc. - Segment focus
- 12.9 Leonardo Spa
- Leonardo Spa - Overview
- Leonardo Spa - Business segments
- Leonardo Spa - Key news
- Leonardo Spa - Key offerings
- Leonardo Spa - Segment focus
- 12.10 Northrop Grumman Corp.
- Northrop Grumman Corp. - Overview
- Northrop Grumman Corp. - Business segments
- Northrop Grumman Corp. - Key news
- Northrop Grumman Corp. - Key offerings
- Northrop Grumman Corp. - Segment focus
- 12.11 RTX Corp.
- RTX Corp. - Overview
- RTX Corp. - Business segments
- RTX Corp. - Key news
- RTX Corp. - Key offerings
- RTX Corp. - Segment focus
- 12.12 Rheinmetall AG
- Rheinmetall AG - Overview
- Rheinmetall AG - Business segments
- Rheinmetall AG - Key news
- Rheinmetall AG - Key offerings
- Rheinmetall AG - Segment focus
- 12.13 Saab AB
- Saab AB - Overview
- Saab AB - Business segments
- Saab AB - Key news
- Saab AB - Key offerings
- Saab AB - Segment focus
- 12.14 Singapore Technologies Engineering Ltd.
- Singapore Technologies Engineering Ltd. - Overview
- Singapore Technologies Engineering Ltd. - Business segments
- Singapore Technologies Engineering Ltd. - Key news
- Singapore Technologies Engineering Ltd. - Key offerings
- Singapore Technologies Engineering Ltd. - Segment focus
- 12.15 Teledyne Technologies Inc.
- Teledyne Technologies Inc. - Overview
- Teledyne Technologies Inc. - Business segments
- Teledyne Technologies Inc. - Key news
- Teledyne Technologies Inc. - Key offerings
- Teledyne Technologies Inc. - Segment focus
- 12.16 Thales Group
- Thales Group - Overview
- Thales Group - Business segments
- Thales Group - Key news
- Thales Group - Key offerings
- Thales Group - Segment focus
- 12.17 Trijicon Inc.
- Trijicon Inc. - Overview
- Trijicon Inc. - Product / Service
- Trijicon Inc. - Key offerings
13 Appendix
- 13.1 Scope of the report
- 13.2 Inclusions and exclusions checklist
- Inclusions checklist
- Exclusions checklist
- 13.3 Currency conversion rates for US$
- Currency conversion rates for US$
- 13.4 Research methodology
- Research methodology
- 13.5 Data procurement
- Information sources
- 13.6 Data validation
- Data validation
- 13.7 Validation techniques employed for market sizing
- Validation techniques employed for market sizing
- 13.8 Data synthesis
- Data synthesis
- 13.9 360 degree market analysis
- 360 degree market analysis
- 13.10 List of abbreviations
- List of abbreviations

