|
|
市場調査レポート
商品コード
1719393
環境消毒ロボットの世界市場 2025~2029年Global Environmental Disinfection Robot Market 2025-2029 |
||||||

|
|||||||
カスタマイズ可能
|
|||||||


| 環境消毒ロボットの世界市場 2025~2029年 |
|
出版日: 2025年04月18日
発行: TechNavio
ページ情報: 英文 229 Pages
納期: 即納可能
|

全表示
- 概要
- 図表
- 目次
環境消毒ロボット市場は2024-2029年に20億2,680万米ドル、予測期間中のCAGRは49.8%で成長すると予測されています。
当レポートでは、環境消毒ロボット市場の全体的な分析、市場規模・予測、動向、成長促進要因、課題、約25のベンダーを網羅したベンダー分析などを掲載しています。
現在の市場シナリオ、最新動向と促進要因、市場環境全体に関する最新分析を提供しています。市場は、ハイズ予防のための洗浄プロトコルの変更、コンポーネントやソフトウェアのコスト削減、ヘルスケアロボットへの投資の増加によって牽引されています。
| 市場範囲 | |
|---|---|
| 基準年 | 2025 |
| 終了年 | 2029 |
| 予測期間 | 2025-2029 |
| 成長モメンタム | 加速 |
| 前年比2025年 | 34.5% |
| CAGR | 49.8% |
| 増分額 | 20億2,680万米ドル |
本調査は、業界の主要参加者からのインプットを含め、一次情報と二次情報を客観的に組み合わせて実施しました。レポートには、主要企業の分析に加え、包括的な市場規模データ、地域分析によるセグメント、ベンダー情勢が含まれています。レポートには過去データと予測データがあります。
本調査では、展開モデルの革新が今後数年間の環境消毒ロボット市場の成長を促進する主要因の1つであると特定しています。また、研究開発イニシアティブや統合・トレーニング関連サービスも市場の大きな需要につながります。
目次
第1章 エグゼクティブサマリー
- 市場概要
第2章 Technavio分析
- 価格・ライフサイクル・顧客購入バスケット・採用率・購入基準の分析
- インプットの重要性と差別化の要因
- 混乱の要因
- 促進要因と課題の影響
第3章 市場情勢
- 市場エコシステム
- 市場の特徴
- バリューチェーン分析
第4章 市場規模
- 市場の定義
- 市場セグメント分析
- 市場規模 2024
- 市場の見通し 2024-2029
第5章 市場規模実績
- 環境消毒ロボットの世界市場 2019-2023
- 技術別セグメント分析 2019-2023
- タイプ別セグメント分析 2019-2023
- 展開別セグメント分析 2019-2023
- エンドユーザー別セグメント分析 2019-2023
- 地域別セグメント分析 2019-2023
- 国別セグメント分析 2019-2023
第6章 定性分析
- AIの影響:環境消毒ロボットの世界市場
第7章 ファイブフォース分析
- ファイブフォースの要約
- 買い手の交渉力
- 供給企業の交渉力
- 新規参入業者の脅威
- 代替品の脅威
- 競争の脅威
- 市況
第8章 市場セグメンテーション:技術別
- 市場セグメント
- 比較:技術別
- UV-C:市場規模と予測 2024-2029
- HPV:市場規模と予測 2024-2029
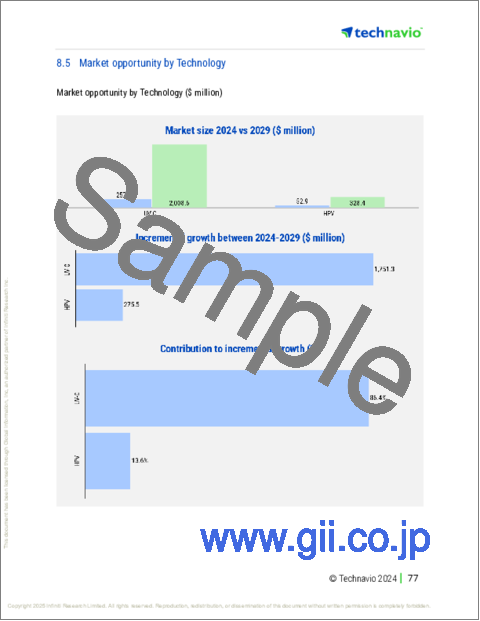
- 市場機会:技術別
第9章 市場セグメンテーション:タイプ別
- 市場セグメント
- 比較:タイプ別
- 自律移動ロボット:市場規模と予測 2024-2029
- 自動誘導ロボット:市場規模と予測 2024-2029
- 市場機会:タイプ別
第10章 市場セグメンテーション:展開別
- 市場セグメント
- 比較:展開別
- 半自律ロボット:市場規模と予測 2024-2029
- 完全自律型ロボット:市場規模と予測 2024-2029
- 市場機会:展開別
第11章 市場セグメンテーション:エンドユーザー別
- 市場セグメント
- 比較:エンドユーザー別
- 病院およびヘルスケア施設:市場規模と予測 2024-2029
- 調査機関:市場規模と予測 2024-2029
- 大学および教育機関:市場規模と予測 2024-2029
- 公共スペースと商業ビル:市場規模と予測 2024-2029
- 市場機会:エンドユーザー別
第12章 顧客情勢
- 顧客情勢の概要
第13章 地域別情勢
- 地域別セグメンテーション
- 地域別比較
- 欧州:市場規模と予測 2024-2029
- 北米:市場規模と予測 2024-2029
- アジア太平洋:市場規模と予測 2024-2029
- 中東・アフリカ:市場規模と予測 2024-2029
- 南米:市場規模と予測 2024-2029
- 米国:市場規模と予測 2024-2029
- 中国:市場規模と予測 2024-2029
- ドイツ:市場規模と予測 2024-2029
- フランス:市場規模と予測 2024-2029
- 日本:市場規模と予測 2024-2029
- 英国:市場規模と予測 2024-2029
- 韓国:市場規模と予測 2024-2029
- イタリア:市場規模と予測 2024-2029
- カナダ:市場規模と予測 2024-2029
- インド:市場規模と予測 2024-2029
- 市場機会:地域情勢別
第14章 促進要因・課題・機会・抑制要因
- 市場促進要因
- 市場の課題
- 促進要因と課題の影響
- 市場の機会・抑制要因
第15章 競合情勢
- 概要
- 競合情勢
- 混乱の状況
- 業界のリスク
第16章 競合分析
- 企業プロファイル
- 企業ランキング指数
- 企業の市場ポジショニング
- Akara Robotics Ltd.
- Altoros Americas LLC
- Ecolab Inc.
- Finsen Technologies Ltd.
- Green Instruments AS
- Mediland Enterprise Corp.
- MetraLabs GmbH
- OTSAW Digital Pte Ltd.
- PDI Inc.
- Regency Robotics Inc
- Steriliz LLC
- Surfacide
- The Clorox Co.
- TMI Robotics Technology Co. Ltd.
- Xenex Disinfection Services LLC
第17章 付録
Exhibits:
- Exhibits1: Executive Summary - Chart on Market Overview
- Exhibits2: Executive Summary - Data Table on Market Overview
- Exhibits3: Executive Summary - Chart on Global Market Characteristics
- Exhibits4: Executive Summary - Chart on Market By Geographical Landscape
- Exhibits5: Executive Summary - Chart on Market Segmentation by Technology
- Exhibits6: Executive Summary - Chart on Market Segmentation by Type
- Exhibits7: Executive Summary - Chart on Market Segmentation by Deployment
- Exhibits8: Executive Summary - Chart on Market Segmentation by End-user
- Exhibits9: Executive Summary - Chart on Incremental Growth
- Exhibits10: Executive Summary - Data Table on Incremental Growth
- Exhibits11: Executive Summary - Chart on Company Market Positioning
- Exhibits12: Analysis of price sensitivity, lifecycle, customer purchase basket, adoption rates, and purchase criteria
- Exhibits13: Overview on criticality of inputs and factors of differentiation
- Exhibits14: Overview on factors of disruption
- Exhibits15: Impact of drivers and challenges in 2024 and 2029
- Exhibits16: Parent Market
- Exhibits17: Data Table on - Parent Market
- Exhibits18: Market characteristics analysis
- Exhibits19: Value chain analysis
- Exhibits20: Offerings of companies included in the market definition
- Exhibits21: Market segments
- Exhibits22: Chart on Global - Market size and forecast 2024-2029 ($ million)
- Exhibits23: Data Table on Global - Market size and forecast 2024-2029 ($ million)
- Exhibits24: Chart on Global Market: Year-over-year growth 2024-2029 (%)
- Exhibits25: Data Table on Global Market: Year-over-year growth 2024-2029 (%)
- Exhibits26: Historic Market Size - Data Table on Global Environmental Disinfection Robot Market 2019 - 2023 ($ million)
- Exhibits27: Historic Market Size - Technology Segment 2019 - 2023 ($ million)
- Exhibits28: Historic Market Size - Type Segment 2019 - 2023 ($ million)
- Exhibits29: Historic Market Size - Deployment Segment 2019 - 2023 ($ million)
- Exhibits30: Historic Market Size - End-user Segment 2019 - 2023 ($ million)
- Exhibits31: Historic Market Size - Geography Segment 2019 - 2023 ($ million)
- Exhibits32: Historic Market Size - Country Segment 2019 - 2023 ($ million)
- Exhibits33: Five forces analysis - Comparison between 2024 and 2029
- Exhibits34: Bargaining power of buyers - Impact of key factors 2024 and 2029
- Exhibits35: Bargaining power of suppliers - Impact of key factors in 2024 and 2029
- Exhibits36: Threat of new entrants - Impact of key factors in 2024 and 2029
- Exhibits37: Threat of substitutes - Impact of key factors in 2024 and 2029
- Exhibits38: Threat of rivalry - Impact of key factors in 2024 and 2029
- Exhibits39: Chart on Market condition - Five forces 2024 and 2029
- Exhibits40: Chart on Technology - Market share 2024-2029 (%)
- Exhibits41: Data Table on Technology - Market share 2024-2029 (%)
- Exhibits42: Chart on Comparison by Technology
- Exhibits43: Data Table on Comparison by Technology
- Exhibits44: Chart on UV-C - Market size and forecast 2024-2029 ($ million)
- Exhibits45: Data Table on UV-C - Market size and forecast 2024-2029 ($ million)
- Exhibits46: Chart on UV-C - Year-over-year growth 2024-2029 (%)
- Exhibits47: Data Table on UV-C - Year-over-year growth 2024-2029 (%)
- Exhibits48: Chart on HPV - Market size and forecast 2024-2029 ($ million)
- Exhibits49: Data Table on HPV - Market size and forecast 2024-2029 ($ million)
- Exhibits50: Chart on HPV - Year-over-year growth 2024-2029 (%)
- Exhibits51: Data Table on HPV - Year-over-year growth 2024-2029 (%)
- Exhibits52: Market opportunity by Technology ($ million)
- Exhibits53: Data Table on Market opportunity by Technology ($ million)
- Exhibits54: Chart on Type - Market share 2024-2029 (%)
- Exhibits55: Data Table on Type - Market share 2024-2029 (%)
- Exhibits56: Chart on Comparison by Type
- Exhibits57: Data Table on Comparison by Type
- Exhibits58: Chart on Autonomous mobile robots - Market size and forecast 2024-2029 ($ million)
- Exhibits59: Data Table on Autonomous mobile robots - Market size and forecast 2024-2029 ($ million)
- Exhibits60: Chart on Autonomous mobile robots - Year-over-year growth 2024-2029 (%)
- Exhibits61: Data Table on Autonomous mobile robots - Year-over-year growth 2024-2029 (%)
- Exhibits62: Chart on Automated guided robots - Market size and forecast 2024-2029 ($ million)
- Exhibits63: Data Table on Automated guided robots - Market size and forecast 2024-2029 ($ million)
- Exhibits64: Chart on Automated guided robots - Year-over-year growth 2024-2029 (%)
- Exhibits65: Data Table on Automated guided robots - Year-over-year growth 2024-2029 (%)
- Exhibits66: Market opportunity by Type ($ million)
- Exhibits67: Data Table on Market opportunity by Type ($ million)
- Exhibits68: Chart on Deployment - Market share 2024-2029 (%)
- Exhibits69: Data Table on Deployment - Market share 2024-2029 (%)
- Exhibits70: Chart on Comparison by Deployment
- Exhibits71: Data Table on Comparison by Deployment
- Exhibits72: Chart on Semi-autonomous robots - Market size and forecast 2024-2029 ($ million)
- Exhibits73: Data Table on Semi-autonomous robots - Market size and forecast 2024-2029 ($ million)
- Exhibits74: Chart on Semi-autonomous robots - Year-over-year growth 2024-2029 (%)
- Exhibits75: Data Table on Semi-autonomous robots - Year-over-year growth 2024-2029 (%)
- Exhibits76: Chart on Fully autonomous robots - Market size and forecast 2024-2029 ($ million)
- Exhibits77: Data Table on Fully autonomous robots - Market size and forecast 2024-2029 ($ million)
- Exhibits78: Chart on Fully autonomous robots - Year-over-year growth 2024-2029 (%)
- Exhibits79: Data Table on Fully autonomous robots - Year-over-year growth 2024-2029 (%)
- Exhibits80: Market opportunity by Deployment ($ million)
- Exhibits81: Data Table on Market opportunity by Deployment ($ million)
- Exhibits82: Chart on End-user - Market share 2024-2029 (%)
- Exhibits83: Data Table on End-user - Market share 2024-2029 (%)
- Exhibits84: Chart on Comparison by End-user
- Exhibits85: Data Table on Comparison by End-user
- Exhibits86: Chart on Hospitals and healthcare facilities - Market size and forecast 2024-2029 ($ million)
- Exhibits87: Data Table on Hospitals and healthcare facilities - Market size and forecast 2024-2029 ($ million)
- Exhibits88: Chart on Hospitals and healthcare facilities - Year-over-year growth 2024-2029 (%)
- Exhibits89: Data Table on Hospitals and healthcare facilities - Year-over-year growth 2024-2029 (%)
- Exhibits90: Chart on Research institutes - Market size and forecast 2024-2029 ($ million)
- Exhibits91: Data Table on Research institutes - Market size and forecast 2024-2029 ($ million)
- Exhibits92: Chart on Research institutes - Year-over-year growth 2024-2029 (%)
- Exhibits93: Data Table on Research institutes - Year-over-year growth 2024-2029 (%)
- Exhibits94: Chart on Universities and educational institutions - Market size and forecast 2024-2029 ($ million)
- Exhibits95: Data Table on Universities and educational institutions - Market size and forecast 2024-2029 ($ million)
- Exhibits96: Chart on Universities and educational institutions - Year-over-year growth 2024-2029 (%)
- Exhibits97: Data Table on Universities and educational institutions - Year-over-year growth 2024-2029 (%)
- Exhibits98: Chart on Public spaces and commercial buildings - Market size and forecast 2024-2029 ($ million)
- Exhibits99: Data Table on Public spaces and commercial buildings - Market size and forecast 2024-2029 ($ million)
- Exhibits100: Chart on Public spaces and commercial buildings - Year-over-year growth 2024-2029 (%)
- Exhibits101: Data Table on Public spaces and commercial buildings - Year-over-year growth 2024-2029 (%)
- Exhibits102: Market opportunity by End-user ($ million)
- Exhibits103: Data Table on Market opportunity by End-user ($ million)
- Exhibits104: Analysis of price sensitivity, lifecycle, customer purchase basket, adoption rates, and purchase criteria
- Exhibits105: Chart on Market share By Geographical Landscape 2024-2029 (%)
- Exhibits106: Data Table on Market share By Geographical Landscape 2024-2029 (%)
- Exhibits107: Chart on Geographic comparison
- Exhibits108: Data Table on Geographic comparison
- Exhibits109: Chart on Europe - Market size and forecast 2024-2029 ($ million)
- Exhibits110: Data Table on Europe - Market size and forecast 2024-2029 ($ million)
- Exhibits111: Chart on Europe - Year-over-year growth 2024-2029 (%)
- Exhibits112: Data Table on Europe - Year-over-year growth 2024-2029 (%)
- Exhibits113: Chart on North America - Market size and forecast 2024-2029 ($ million)
- Exhibits114: Data Table on North America - Market size and forecast 2024-2029 ($ million)
- Exhibits115: Chart on North America - Year-over-year growth 2024-2029 (%)
- Exhibits116: Data Table on North America - Year-over-year growth 2024-2029 (%)
- Exhibits117: Chart on APAC - Market size and forecast 2024-2029 ($ million)
- Exhibits118: Data Table on APAC - Market size and forecast 2024-2029 ($ million)
- Exhibits119: Chart on APAC - Year-over-year growth 2024-2029 (%)
- Exhibits120: Data Table on APAC - Year-over-year growth 2024-2029 (%)
- Exhibits121: Chart on Middle East and Africa - Market size and forecast 2024-2029 ($ million)
- Exhibits122: Data Table on Middle East and Africa - Market size and forecast 2024-2029 ($ million)
- Exhibits123: Chart on Middle East and Africa - Year-over-year growth 2024-2029 (%)
- Exhibits124: Data Table on Middle East and Africa - Year-over-year growth 2024-2029 (%)
- Exhibits125: Chart on South America - Market size and forecast 2024-2029 ($ million)
- Exhibits126: Data Table on South America - Market size and forecast 2024-2029 ($ million)
- Exhibits127: Chart on South America - Year-over-year growth 2024-2029 (%)
- Exhibits128: Data Table on South America - Year-over-year growth 2024-2029 (%)
- Exhibits129: Chart on US - Market size and forecast 2024-2029 ($ million)
- Exhibits130: Data Table on US - Market size and forecast 2024-2029 ($ million)
- Exhibits131: Chart on US - Year-over-year growth 2024-2029 (%)
- Exhibits132: Data Table on US - Year-over-year growth 2024-2029 (%)
- Exhibits133: Chart on China - Market size and forecast 2024-2029 ($ million)
- Exhibits134: Data Table on China - Market size and forecast 2024-2029 ($ million)
- Exhibits135: Chart on China - Year-over-year growth 2024-2029 (%)
- Exhibits136: Data Table on China - Year-over-year growth 2024-2029 (%)
- Exhibits137: Chart on Germany - Market size and forecast 2024-2029 ($ million)
- Exhibits138: Data Table on Germany - Market size and forecast 2024-2029 ($ million)
- Exhibits139: Chart on Germany - Year-over-year growth 2024-2029 (%)
- Exhibits140: Data Table on Germany - Year-over-year growth 2024-2029 (%)
- Exhibits141: Chart on France - Market size and forecast 2024-2029 ($ million)
- Exhibits142: Data Table on France - Market size and forecast 2024-2029 ($ million)
- Exhibits143: Chart on France - Year-over-year growth 2024-2029 (%)
- Exhibits144: Data Table on France - Year-over-year growth 2024-2029 (%)
- Exhibits145: Chart on Japan - Market size and forecast 2024-2029 ($ million)
- Exhibits146: Data Table on Japan - Market size and forecast 2024-2029 ($ million)
- Exhibits147: Chart on Japan - Year-over-year growth 2024-2029 (%)
- Exhibits148: Data Table on Japan - Year-over-year growth 2024-2029 (%)
- Exhibits149: Chart on UK - Market size and forecast 2024-2029 ($ million)
- Exhibits150: Data Table on UK - Market size and forecast 2024-2029 ($ million)
- Exhibits151: Chart on UK - Year-over-year growth 2024-2029 (%)
- Exhibits152: Data Table on UK - Year-over-year growth 2024-2029 (%)
- Exhibits153: Chart on South Korea - Market size and forecast 2024-2029 ($ million)
- Exhibits154: Data Table on South Korea - Market size and forecast 2024-2029 ($ million)
- Exhibits155: Chart on South Korea - Year-over-year growth 2024-2029 (%)
- Exhibits156: Data Table on South Korea - Year-over-year growth 2024-2029 (%)
- Exhibits157: Chart on Italy - Market size and forecast 2024-2029 ($ million)
- Exhibits158: Data Table on Italy - Market size and forecast 2024-2029 ($ million)
- Exhibits159: Chart on Italy - Year-over-year growth 2024-2029 (%)
- Exhibits160: Data Table on Italy - Year-over-year growth 2024-2029 (%)
- Exhibits161: Chart on Canada - Market size and forecast 2024-2029 ($ million)
- Exhibits162: Data Table on Canada - Market size and forecast 2024-2029 ($ million)
- Exhibits163: Chart on Canada - Year-over-year growth 2024-2029 (%)
- Exhibits164: Data Table on Canada - Year-over-year growth 2024-2029 (%)
- Exhibits165: Chart on India - Market size and forecast 2024-2029 ($ million)
- Exhibits166: Data Table on India - Market size and forecast 2024-2029 ($ million)
- Exhibits167: Chart on India - Year-over-year growth 2024-2029 (%)
- Exhibits168: Data Table on India - Year-over-year growth 2024-2029 (%)
- Exhibits169: Market opportunity By Geographical Landscape ($ million)
- Exhibits170: Data Tables on Market opportunity By Geographical Landscape ($ million)
- Exhibits171: Impact of drivers and challenges in 2024 and 2029
- Exhibits172: Overview on criticality of inputs and factors of differentiation
- Exhibits173: Overview on factors of disruption
- Exhibits174: Impact of key risks on business
- Exhibits175: Companies covered
- Exhibits176: Company ranking index
- Exhibits177: Matrix on companies position and classification
- Exhibits178: Akara Robotics Ltd. - Overview
- Exhibits179: Akara Robotics Ltd. - Product / Service
- Exhibits180: Akara Robotics Ltd. - Key offerings
- Exhibits181: SWOT
- Exhibits182: Altoros Americas LLC - Overview
- Exhibits183: Altoros Americas LLC - Product / Service
- Exhibits184: Altoros Americas LLC - Key offerings
- Exhibits185: SWOT
- Exhibits186: Ecolab Inc. - Overview
- Exhibits187: Ecolab Inc. - Business segments
- Exhibits188: Ecolab Inc. - Key news
- Exhibits189: Ecolab Inc. - Key offerings
- Exhibits190: Ecolab Inc. - Segment focus
- Exhibits191: SWOT
- Exhibits192: Finsen Technologies Ltd. - Overview
- Exhibits193: Finsen Technologies Ltd. - Product / Service
- Exhibits194: Finsen Technologies Ltd. - Key news
- Exhibits195: Finsen Technologies Ltd. - Key offerings
- Exhibits196: SWOT
- Exhibits197: Green Instruments AS - Overview
- Exhibits198: Green Instruments AS - Product / Service
- Exhibits199: Green Instruments AS - Key offerings
- Exhibits200: SWOT
- Exhibits201: Mediland Enterprise Corp. - Overview
- Exhibits202: Mediland Enterprise Corp. - Product / Service
- Exhibits203: Mediland Enterprise Corp. - Key offerings
- Exhibits204: SWOT
- Exhibits205: MetraLabs GmbH - Overview
- Exhibits206: MetraLabs GmbH - Product / Service
- Exhibits207: MetraLabs GmbH - Key offerings
- Exhibits208: SWOT
- Exhibits209: OTSAW Digital Pte Ltd. - Overview
- Exhibits210: OTSAW Digital Pte Ltd. - Product / Service
- Exhibits211: OTSAW Digital Pte Ltd. - Key offerings
- Exhibits212: SWOT
- Exhibits213: PDI Inc. - Overview
- Exhibits214: PDI Inc. - Product / Service
- Exhibits215: PDI Inc. - Key offerings
- Exhibits216: SWOT
- Exhibits217: Regency Robotics Inc - Overview
- Exhibits218: Regency Robotics Inc - Product / Service
- Exhibits219: Regency Robotics Inc - Key offerings
- Exhibits220: SWOT
- Exhibits221: Steriliz LLC - Overview
- Exhibits222: Steriliz LLC - Product / Service
- Exhibits223: Steriliz LLC - Key offerings
- Exhibits224: SWOT
- Exhibits225: Surfacide - Overview
- Exhibits226: Surfacide - Product / Service
- Exhibits227: Surfacide - Key offerings
- Exhibits228: SWOT
- Exhibits229: The Clorox Co. - Overview
- Exhibits230: The Clorox Co. - Business segments
- Exhibits231: The Clorox Co. - Key news
- Exhibits232: The Clorox Co. - Key offerings
- Exhibits233: The Clorox Co. - Segment focus
- Exhibits234: SWOT
- Exhibits235: TMI Robotics Technology Co. Ltd. - Overview
- Exhibits236: TMI Robotics Technology Co. Ltd. - Product / Service
- Exhibits237: TMI Robotics Technology Co. Ltd. - Key offerings
- Exhibits238: SWOT
- Exhibits239: Xenex Disinfection Services LLC - Overview
- Exhibits240: Xenex Disinfection Services LLC - Product / Service
- Exhibits241: Xenex Disinfection Services LLC - Key offerings
- Exhibits242: SWOT
- Exhibits243: Inclusions checklist
- Exhibits244: Exclusions checklist
- Exhibits245: Currency conversion rates for US$
- Exhibits246: Research methodology
- Exhibits247: Information sources
- Exhibits248: Data validation
- Exhibits249: Validation techniques employed for market sizing
- Exhibits250: Data synthesis
- Exhibits251: 360 degree market analysis
- Exhibits252: List of abbreviations
The environmental disinfection robot market is forecasted to grow by USD 2026.8 mn during 2024-2029, accelerating at a CAGR of 49.8% during the forecast period. The report on the environmental disinfection robot market provides a holistic analysis, market size and forecast, trends, growth drivers, and challenges, as well as vendor analysis covering around 25 vendors.
The report offers an up-to-date analysis regarding the current market scenario, the latest trends and drivers, and the overall market environment. The market is driven by changes in cleaning protocols to prevent hais, reduction in component and software costs, and increased investment in healthcare robotics.
| Market Scope | |
|---|---|
| Base Year | 2025 |
| End Year | 2029 |
| Series Year | 2025-2029 |
| Growth Momentum | Accelerate |
| YOY 2025 | 34.5% |
| CAGR | 49.8% |
| Incremental Value | $2026.8 mn |
The study was conducted using an objective combination of primary and secondary information including inputs from key participants in the industry. The report contains a comprehensive market size data, segment with regional analysis and vendor landscape in addition to an analysis of the key companies. Reports have historic and forecast data.
Technavio's environmental disinfection robot market is segmented as below:
By Technology
- UV-C
- HPV
By Type
- Autonomous mobile robots
- Automated guided robots
By Geographical Landscape
- Europe
- North America
- APAC
- Middle East and Africa
- South America
This study identifies the innovations in deployment models as one of the prime reasons driving the environmental disinfection robot market growth during the next few years. Also, research and development initiatives and integration and training-related services will lead to sizable demand in the market.
The report on the environmental disinfection robot market covers the following areas:
- Environmental Disinfection Robot Market sizing
- Environmental Disinfection Robot Market forecast
- Environmental Disinfection Robot Market industry analysis
The robust vendor analysis is designed to help clients improve their market position, and in line with this, this report provides a detailed analysis of several leading environmental disinfection robot market vendors that include Akara Robotics Ltd., Altoros Americas LLC, Ecolab Inc., Finsen Technologies Ltd., Green Instruments AS, Mediland Enterprise Corp., MetraLabs GmbH, OTSAW Digital Pte Ltd., PDI Inc., Regency Robotics Inc, Shanghai Kinlong Intelligent Technology Co. Ltd., SKYTRON LLC, Steriliz LLC, Surfacide, The Clorox Co., TMI Robotics Technology Co. Ltd., UVC Cleaning Systems Inc., and Xenex Disinfection Services LLC. Also, the environmental disinfection robot market analysis report includes information on upcoming trends and challenges that will influence market growth. This is to help companies strategize and leverage all forthcoming growth opportunities.
The publisher presents a detailed picture of the market by the way of study, synthesis, and summation of data from multiple sources by an analysis of key parameters such as profit, pricing, competition, and promotions. It presents various market facets by identifying the key industry influencers. The data presented is comprehensive, reliable, and a result of extensive primary and secondary research. The market research reports provide a complete competitive landscape and an in-depth vendor selection methodology and analysis using qualitative and quantitative research to forecast accurate market growth.
Table of Contents
1 Executive Summary
- 1.1 Market overview
- Executive Summary - Chart on Market Overview
- Executive Summary - Data Table on Market Overview
- Executive Summary - Chart on Global Market Characteristics
- Executive Summary - Chart on Market By Geographical Landscape
- Executive Summary - Chart on Market Segmentation by Technology
- Executive Summary - Chart on Market Segmentation by Type
- Executive Summary - Chart on Market Segmentation by Deployment
- Executive Summary - Chart on Market Segmentation by End-user
- Executive Summary - Chart on Incremental Growth
- Executive Summary - Data Table on Incremental Growth
- Executive Summary - Chart on Company Market Positioning
2 Technavio Analysis
- 2.1 Analysis of price sensitivity, lifecycle, customer purchase basket, adoption rates, and purchase criteria
- Analysis of price sensitivity, lifecycle, customer purchase basket, adoption rates, and purchase criteria
- 2.2 Criticality of inputs and Factors of differentiation
- Overview on criticality of inputs and factors of differentiation
- 2.3 Factors of disruption
- Overview on factors of disruption
- 2.4 Impact of drivers and challenges
- Impact of drivers and challenges in 2024 and 2029
3 Market Landscape
- 3.1 Market ecosystem
- Parent Market
- Data Table on - Parent Market
- 3.2 Market characteristics
- Market characteristics analysis
- 3.3 Value chain analysis
- Value chain analysis
4 Market Sizing
- 4.1 Market definition
- Offerings of companies included in the market definition
- 4.2 Market segment analysis
- Market segments
- 4.3 Market size 2024
- 4.4 Market outlook: Forecast for 2024-2029
- Chart on Global - Market size and forecast 2024-2029 ($ million)
- Data Table on Global - Market size and forecast 2024-2029 ($ million)
- Chart on Global Market: Year-over-year growth 2024-2029 (%)
- Data Table on Global Market: Year-over-year growth 2024-2029 (%)
5 Historic Market Size
- 5.1 Global Environmental Disinfection Robot Market 2019 - 2023
- Historic Market Size - Data Table on Global Environmental Disinfection Robot Market 2019 - 2023 ($ million)
- 5.2 Technology segment analysis 2019 - 2023
- Historic Market Size - Technology Segment 2019 - 2023 ($ million)
- 5.3 Type segment analysis 2019 - 2023
- Historic Market Size - Type Segment 2019 - 2023 ($ million)
- 5.4 Deployment segment analysis 2019 - 2023
- Historic Market Size - Deployment Segment 2019 - 2023 ($ million)
- 5.5 End-user segment analysis 2019 - 2023
- Historic Market Size - End-user Segment 2019 - 2023 ($ million)
- 5.6 Geography segment analysis 2019 - 2023
- Historic Market Size - Geography Segment 2019 - 2023 ($ million)
- 5.7 Country segment analysis 2019 - 2023
- Historic Market Size - Country Segment 2019 - 2023 ($ million)
6 Qualitative Analysis
- 6.1 The AI impact on global environmental disinfection robot market
7 Five Forces Analysis
- 7.1 Five forces summary
- Five forces analysis - Comparison between 2024 and 2029
- 7.2 Bargaining power of buyers
- Bargaining power of buyers - Impact of key factors 2024 and 2029
- 7.3 Bargaining power of suppliers
- Bargaining power of suppliers - Impact of key factors in 2024 and 2029
- 7.4 Threat of new entrants
- Threat of new entrants - Impact of key factors in 2024 and 2029
- 7.5 Threat of substitutes
- Threat of substitutes - Impact of key factors in 2024 and 2029
- 7.6 Threat of rivalry
- Threat of rivalry - Impact of key factors in 2024 and 2029
- 7.7 Market condition
- Chart on Market condition - Five forces 2024 and 2029
8 Market Segmentation by Technology
- 8.1 Market segments
- Chart on Technology - Market share 2024-2029 (%)
- Data Table on Technology - Market share 2024-2029 (%)
- 8.2 Comparison by Technology
- Chart on Comparison by Technology
- Data Table on Comparison by Technology
- 8.3 UV-C - Market size and forecast 2024-2029
- Chart on UV-C - Market size and forecast 2024-2029 ($ million)
- Data Table on UV-C - Market size and forecast 2024-2029 ($ million)
- Chart on UV-C - Year-over-year growth 2024-2029 (%)
- Data Table on UV-C - Year-over-year growth 2024-2029 (%)
- 8.4 HPV - Market size and forecast 2024-2029
- Chart on HPV - Market size and forecast 2024-2029 ($ million)
- Data Table on HPV - Market size and forecast 2024-2029 ($ million)
- Chart on HPV - Year-over-year growth 2024-2029 (%)
- Data Table on HPV - Year-over-year growth 2024-2029 (%)
- 8.5 Market opportunity by Technology
- Market opportunity by Technology ($ million)
- Data Table on Market opportunity by Technology ($ million)
9 Market Segmentation by Type
- 9.1 Market segments
- Chart on Type - Market share 2024-2029 (%)
- Data Table on Type - Market share 2024-2029 (%)
- 9.2 Comparison by Type
- Chart on Comparison by Type
- Data Table on Comparison by Type
- 9.3 Autonomous mobile robots - Market size and forecast 2024-2029
- Chart on Autonomous mobile robots - Market size and forecast 2024-2029 ($ million)
- Data Table on Autonomous mobile robots - Market size and forecast 2024-2029 ($ million)
- Chart on Autonomous mobile robots - Year-over-year growth 2024-2029 (%)
- Data Table on Autonomous mobile robots - Year-over-year growth 2024-2029 (%)
- 9.4 Automated guided robots - Market size and forecast 2024-2029
- Chart on Automated guided robots - Market size and forecast 2024-2029 ($ million)
- Data Table on Automated guided robots - Market size and forecast 2024-2029 ($ million)
- Chart on Automated guided robots - Year-over-year growth 2024-2029 (%)
- Data Table on Automated guided robots - Year-over-year growth 2024-2029 (%)
- 9.5 Market opportunity by Type
- Market opportunity by Type ($ million)
- Data Table on Market opportunity by Type ($ million)
10 Market Segmentation by Deployment
- 10.1 Market segments
- Chart on Deployment - Market share 2024-2029 (%)
- Data Table on Deployment - Market share 2024-2029 (%)
- 10.2 Comparison by Deployment
- Chart on Comparison by Deployment
- Data Table on Comparison by Deployment
- 10.3 Semi-autonomous robots - Market size and forecast 2024-2029
- Chart on Semi-autonomous robots - Market size and forecast 2024-2029 ($ million)
- Data Table on Semi-autonomous robots - Market size and forecast 2024-2029 ($ million)
- Chart on Semi-autonomous robots - Year-over-year growth 2024-2029 (%)
- Data Table on Semi-autonomous robots - Year-over-year growth 2024-2029 (%)
- 10.4 Fully autonomous robots - Market size and forecast 2024-2029
- Chart on Fully autonomous robots - Market size and forecast 2024-2029 ($ million)
- Data Table on Fully autonomous robots - Market size and forecast 2024-2029 ($ million)
- Chart on Fully autonomous robots - Year-over-year growth 2024-2029 (%)
- Data Table on Fully autonomous robots - Year-over-year growth 2024-2029 (%)
- 10.5 Market opportunity by Deployment
- Market opportunity by Deployment ($ million)
- Data Table on Market opportunity by Deployment ($ million)
11 Market Segmentation by End-user
- 11.1 Market segments
- Chart on End-user - Market share 2024-2029 (%)
- Data Table on End-user - Market share 2024-2029 (%)
- 11.2 Comparison by End-user
- Chart on Comparison by End-user
- Data Table on Comparison by End-user
- 11.3 Hospitals and healthcare facilities - Market size and forecast 2024-2029
- Chart on Hospitals and healthcare facilities - Market size and forecast 2024-2029 ($ million)
- Data Table on Hospitals and healthcare facilities - Market size and forecast 2024-2029 ($ million)
- Chart on Hospitals and healthcare facilities - Year-over-year growth 2024-2029 (%)
- Data Table on Hospitals and healthcare facilities - Year-over-year growth 2024-2029 (%)
- 11.4 Research institutes - Market size and forecast 2024-2029
- Chart on Research institutes - Market size and forecast 2024-2029 ($ million)
- Data Table on Research institutes - Market size and forecast 2024-2029 ($ million)
- Chart on Research institutes - Year-over-year growth 2024-2029 (%)
- Data Table on Research institutes - Year-over-year growth 2024-2029 (%)
- 11.5 Universities and educational institutions - Market size and forecast 2024-2029
- Chart on Universities and educational institutions - Market size and forecast 2024-2029 ($ million)
- Data Table on Universities and educational institutions - Market size and forecast 2024-2029 ($ million)
- Chart on Universities and educational institutions - Year-over-year growth 2024-2029 (%)
- Data Table on Universities and educational institutions - Year-over-year growth 2024-2029 (%)
- 11.6 Public spaces and commercial buildings - Market size and forecast 2024-2029
- Chart on Public spaces and commercial buildings - Market size and forecast 2024-2029 ($ million)
- Data Table on Public spaces and commercial buildings - Market size and forecast 2024-2029 ($ million)
- Chart on Public spaces and commercial buildings - Year-over-year growth 2024-2029 (%)
- Data Table on Public spaces and commercial buildings - Year-over-year growth 2024-2029 (%)
- 11.7 Market opportunity by End-user
- Market opportunity by End-user ($ million)
- Data Table on Market opportunity by End-user ($ million)
12 Customer Landscape
- 12.1 Customer landscape overview
- Analysis of price sensitivity, lifecycle, customer purchase basket, adoption rates, and purchase criteria
13 Geographic Landscape
- 13.1 Geographic segmentation
- Chart on Market share By Geographical Landscape 2024-2029 (%)
- Data Table on Market share By Geographical Landscape 2024-2029 (%)
- 13.2 Geographic comparison
- Chart on Geographic comparison
- Data Table on Geographic comparison
- 13.3 Europe - Market size and forecast 2024-2029
- Chart on Europe - Market size and forecast 2024-2029 ($ million)
- Data Table on Europe - Market size and forecast 2024-2029 ($ million)
- Chart on Europe - Year-over-year growth 2024-2029 (%)
- Data Table on Europe - Year-over-year growth 2024-2029 (%)
- 13.4 North America - Market size and forecast 2024-2029
- Chart on North America - Market size and forecast 2024-2029 ($ million)
- Data Table on North America - Market size and forecast 2024-2029 ($ million)
- Chart on North America - Year-over-year growth 2024-2029 (%)
- Data Table on North America - Year-over-year growth 2024-2029 (%)
- 13.5 APAC - Market size and forecast 2024-2029
- Chart on APAC - Market size and forecast 2024-2029 ($ million)
- Data Table on APAC - Market size and forecast 2024-2029 ($ million)
- Chart on APAC - Year-over-year growth 2024-2029 (%)
- Data Table on APAC - Year-over-year growth 2024-2029 (%)
- 13.6 Middle East and Africa - Market size and forecast 2024-2029
- Chart on Middle East and Africa - Market size and forecast 2024-2029 ($ million)
- Data Table on Middle East and Africa - Market size and forecast 2024-2029 ($ million)
- Chart on Middle East and Africa - Year-over-year growth 2024-2029 (%)
- Data Table on Middle East and Africa - Year-over-year growth 2024-2029 (%)
- 13.7 South America - Market size and forecast 2024-2029
- Chart on South America - Market size and forecast 2024-2029 ($ million)
- Data Table on South America - Market size and forecast 2024-2029 ($ million)
- Chart on South America - Year-over-year growth 2024-2029 (%)
- Data Table on South America - Year-over-year growth 2024-2029 (%)
- 13.8 US - Market size and forecast 2024-2029
- Chart on US - Market size and forecast 2024-2029 ($ million)
- Data Table on US - Market size and forecast 2024-2029 ($ million)
- Chart on US - Year-over-year growth 2024-2029 (%)
- Data Table on US - Year-over-year growth 2024-2029 (%)
- 13.9 China - Market size and forecast 2024-2029
- Chart on China - Market size and forecast 2024-2029 ($ million)
- Data Table on China - Market size and forecast 2024-2029 ($ million)
- Chart on China - Year-over-year growth 2024-2029 (%)
- Data Table on China - Year-over-year growth 2024-2029 (%)
- 13.10 Germany - Market size and forecast 2024-2029
- Chart on Germany - Market size and forecast 2024-2029 ($ million)
- Data Table on Germany - Market size and forecast 2024-2029 ($ million)
- Chart on Germany - Year-over-year growth 2024-2029 (%)
- Data Table on Germany - Year-over-year growth 2024-2029 (%)
- 13.11 France - Market size and forecast 2024-2029
- Chart on France - Market size and forecast 2024-2029 ($ million)
- Data Table on France - Market size and forecast 2024-2029 ($ million)
- Chart on France - Year-over-year growth 2024-2029 (%)
- Data Table on France - Year-over-year growth 2024-2029 (%)
- 13.12 Japan - Market size and forecast 2024-2029
- Chart on Japan - Market size and forecast 2024-2029 ($ million)
- Data Table on Japan - Market size and forecast 2024-2029 ($ million)
- Chart on Japan - Year-over-year growth 2024-2029 (%)
- Data Table on Japan - Year-over-year growth 2024-2029 (%)
- 13.13 UK - Market size and forecast 2024-2029
- Chart on UK - Market size and forecast 2024-2029 ($ million)
- Data Table on UK - Market size and forecast 2024-2029 ($ million)
- Chart on UK - Year-over-year growth 2024-2029 (%)
- Data Table on UK - Year-over-year growth 2024-2029 (%)
- 13.14 South Korea - Market size and forecast 2024-2029
- Chart on South Korea - Market size and forecast 2024-2029 ($ million)
- Data Table on South Korea - Market size and forecast 2024-2029 ($ million)
- Chart on South Korea - Year-over-year growth 2024-2029 (%)
- Data Table on South Korea - Year-over-year growth 2024-2029 (%)
- 13.15 Italy - Market size and forecast 2024-2029
- Chart on Italy - Market size and forecast 2024-2029 ($ million)
- Data Table on Italy - Market size and forecast 2024-2029 ($ million)
- Chart on Italy - Year-over-year growth 2024-2029 (%)
- Data Table on Italy - Year-over-year growth 2024-2029 (%)
- 13.16 Canada - Market size and forecast 2024-2029
- Chart on Canada - Market size and forecast 2024-2029 ($ million)
- Data Table on Canada - Market size and forecast 2024-2029 ($ million)
- Chart on Canada - Year-over-year growth 2024-2029 (%)
- Data Table on Canada - Year-over-year growth 2024-2029 (%)
- 13.17 India - Market size and forecast 2024-2029
- Chart on India - Market size and forecast 2024-2029 ($ million)
- Data Table on India - Market size and forecast 2024-2029 ($ million)
- Chart on India - Year-over-year growth 2024-2029 (%)
- Data Table on India - Year-over-year growth 2024-2029 (%)
- 13.18 Market opportunity By Geographical Landscape
- Market opportunity By Geographical Landscape ($ million)
- Data Tables on Market opportunity By Geographical Landscape ($ million)
14 Drivers, Challenges, and Opportunity/Restraints
- 14.1 Market drivers
- 14.2 Market challenges
- 14.3 Impact of drivers and challenges
- Impact of drivers and challenges in 2024 and 2029
- 14.4 Market opportunities/restraints
15 Competitive Landscape
- 15.1 Overview
- 15.2 Competitive Landscape
- Overview on criticality of inputs and factors of differentiation
- 15.3 Landscape disruption
- Overview on factors of disruption
- 15.4 Industry risks
- Impact of key risks on business
16 Competitive Analysis
- 16.1 Companies profiled
- Companies covered
- 16.2 Company ranking index
- Company ranking index
- 16.3 Market positioning of companies
- Matrix on companies position and classification
- 16.4 Akara Robotics Ltd.
- Akara Robotics Ltd. - Overview
- Akara Robotics Ltd. - Product / Service
- Akara Robotics Ltd. - Key offerings
- SWOT
- 16.5 Altoros Americas LLC
- Altoros Americas LLC - Overview
- Altoros Americas LLC - Product / Service
- Altoros Americas LLC - Key offerings
- SWOT
- 16.6 Ecolab Inc.
- Ecolab Inc. - Overview
- Ecolab Inc. - Business segments
- Ecolab Inc. - Key news
- Ecolab Inc. - Key offerings
- Ecolab Inc. - Segment focus
- SWOT
- 16.7 Finsen Technologies Ltd.
- Finsen Technologies Ltd. - Overview
- Finsen Technologies Ltd. - Product / Service
- Finsen Technologies Ltd. - Key news
- Finsen Technologies Ltd. - Key offerings
- SWOT
- 16.8 Green Instruments AS
- Green Instruments AS - Overview
- Green Instruments AS - Product / Service
- Green Instruments AS - Key offerings
- SWOT
- 16.9 Mediland Enterprise Corp.
- Mediland Enterprise Corp. - Overview
- Mediland Enterprise Corp. - Product / Service
- Mediland Enterprise Corp. - Key offerings
- SWOT
- 16.10 MetraLabs GmbH
- MetraLabs GmbH - Overview
- MetraLabs GmbH - Product / Service
- MetraLabs GmbH - Key offerings
- SWOT
- 16.11 OTSAW Digital Pte Ltd.
- OTSAW Digital Pte Ltd. - Overview
- OTSAW Digital Pte Ltd. - Product / Service
- OTSAW Digital Pte Ltd. - Key offerings
- SWOT
- 16.12 PDI Inc.
- PDI Inc. - Overview
- PDI Inc. - Product / Service
- PDI Inc. - Key offerings
- SWOT
- 16.13 Regency Robotics Inc
- Regency Robotics Inc - Overview
- Regency Robotics Inc - Product / Service
- Regency Robotics Inc - Key offerings
- SWOT
- 16.14 Steriliz LLC
- Steriliz LLC - Overview
- Steriliz LLC - Product / Service
- Steriliz LLC - Key offerings
- SWOT
- 16.15 Surfacide
- Surfacide - Overview
- Surfacide - Product / Service
- Surfacide - Key offerings
- SWOT
- 16.16 The Clorox Co.
- The Clorox Co. - Overview
- The Clorox Co. - Business segments
- The Clorox Co. - Key news
- The Clorox Co. - Key offerings
- The Clorox Co. - Segment focus
- SWOT
- 16.17 TMI Robotics Technology Co. Ltd.
- TMI Robotics Technology Co. Ltd. - Overview
- TMI Robotics Technology Co. Ltd. - Product / Service
- TMI Robotics Technology Co. Ltd. - Key offerings
- SWOT
- 16.18 Xenex Disinfection Services LLC
- Xenex Disinfection Services LLC - Overview
- Xenex Disinfection Services LLC - Product / Service
- Xenex Disinfection Services LLC - Key offerings
- SWOT
17 Appendix
- 17.1 Scope of the report
- 17.2 Inclusions and exclusions checklist
- Inclusions checklist
- Exclusions checklist
- 17.3 Currency conversion rates for US$
- Currency conversion rates for US$
- 17.4 Research methodology
- Research methodology
- 17.5 Data procurement
- Information sources
- 17.6 Data validation
- Data validation
- 17.7 Validation techniques employed for market sizing
- Validation techniques employed for market sizing
- 17.8 Data synthesis
- Data synthesis
- 17.9 360 degree market analysis
- 360 degree market analysis
- 17.10 List of abbreviations
- List of abbreviations
