|
|
市場調査レポート
商品コード
1220803
心臓バイオマーカーの世界市場 2023-2027Global Cardiac Biomarkers Market 2023-2027 |
||||||
|
|
|||||||
|
● お客様のご希望に応じて、既存データの加工や未掲載情報(例:国別セグメント)の追加などの対応が可能です。 詳細はお問い合わせください。 |
|||||||


| 心臓バイオマーカーの世界市場 2023-2027 |
|
出版日: 2023年02月02日
発行: TechNavio
ページ情報: 英文 177 Pages
納期: 即納可能
|
- 全表示
- 概要
- 図表
- 目次
当レポートでは心臓バイオマーカーの市場規模は、2022年から2027年の間にCAGR 12.6%で78億8,086万米ドル成長すると予測しています。
当レポートでは、心臓バイオマーカー市場について、全体的な分析、市場規模と予測、動向、成長促進要因・課題、約25のベンダーを網羅したベンダー分析などを掲載しています。
現在の市場動向と促進要因、市場環境全体に関する最新の分析を提供しています。市場は、CVDの有病率の増加、高齢者人口の増加、M&Aや新製品の上市の増加によって牽引されています。
本調査では、個別化医療への注目の高まりが、今後数年間の心臓バイオマーカー市場の成長を促進する主要な理由の1つであると特定しています。また、POCのための迅速診断におけるデジタルヘルスの使用と技術の進歩は、市場の大きな需要につながるでしょう。
目次
第1章 エグゼクティブサマリー
- 市場概要
第2章 市場情勢
- 市場エコシステム
第3章 市場規模
- 市場の定義
- 市場セグメント分析
- 市場規模 2022
- 市場の見通し:2022-2027年の予測
第4章 市場規模実績
- 世界の心臓バイオマーカー市場2017-2021
- テクノロジーセグメント分析2017-2021
- 製品セグメント分析2017-2021
- エンドユーザーセグメント分析2017-2021
- 地域セグメント分析2017-2021
- 国セグメント分析2017-2021
第5章 ファイブフォース分析
- ファイブフォースの要約
- 買い手の交渉力
- 供給企業の交渉力
- 新規参入業者の脅威
- 代替品の脅威
- 競争の脅威
- 市況
第6章 テクノロジー別市場セグメンテーション
- マーケット・セグメント
- 技術別比較
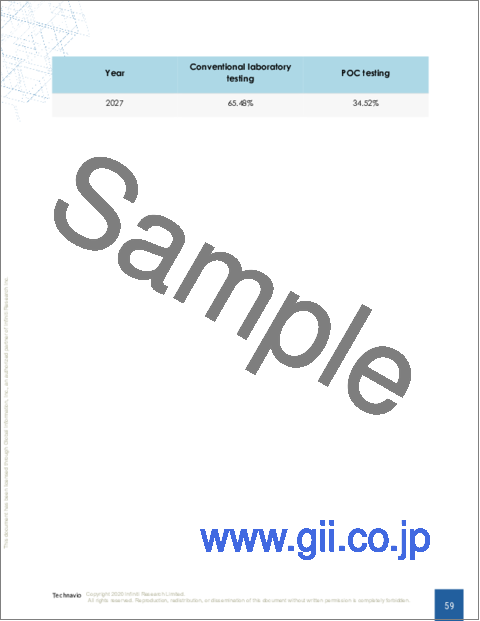
- 従来の臨床検査 - 市場規模と予測 2022-2027
- POCテスト - 市場規模と予測 2022-2027
- テクノロジー別の市場機会
第7章 製品別の市場セグメンテーション
- マーケット・セグメント
- 製品別比較
- トロポニン - 市場規模と予測 2022-2027
- BNPとNT-proBNP - 市場規模と予測 2022-2027
- CK-MB - 市場規模と予測 2022-2027
- ミオグロビン - 市場規模と予測 2022-2027
- その他 - 市場規模と予測 2022-2027
- 製品別の市場機会
第8章 エンドユーザー別市場セグメンテーション
- マーケット・セグメント
- エンドユーザー別比較
- 病院と診療所 - 市場規模と予測 2022-2027
- 診断研究所 - 市場規模と予測 2022-2027
- エンドユーザー別の市場機会
第9章 顧客情勢
- 顧客情勢の概要
第10章 地域別情勢
- 地域別セグメンテーション
- 地域別比較
- 北米 - 市場規模と予測 2022-2027
- 欧州 - 市場規模と予測 2022-2027
- アジア - 市場規模と予測 2022-2027
- その他の地域(ROW) - 市場規模と予測 2022-2027
- 米国 - 市場規模と予測 2022-2027
- ドイツ - 市場規模と予測 2022-2027
- 中国 - 市場規模と予測 2022-2027
- 英国 - 市場規模と予測 2022-2027
- インド - 市場規模と予測 2022-2027
- 地域別の市場機会
第11章 促進要因、課題、および動向
- 市場促進要因
- 市場の課題
- 促進要因と課題の影響
- 市場動向
第12章 ベンダー情勢
- 概要
- ベンダー情勢
- 混乱の状況
- 業界のリスク
第13章 ベンダー分析
- 対象ベンダー
- ベンダーの市場ポジショニング
- Abbott Laboratories
- BG Medicine Inc.
- Bio Rad Laboratories Inc.
- bioMerieux SA
- Boditech Med Inc.
- Creative Diagnostics
- Diazyme Laboratories Inc.
- F. Hoffmann La Roche Ltd.
- Lepu Medical Technology Beijing Co. Ltd.
- LifeSign LLC
- LSI Medience Corp.
- Randox Laboratories Ltd.
- Response Biomedical Corp.
- Siemens Healthineers AG
- Signosis Inc.
第14章 付録
Exhibits:
- Exhibits1: Executive Summary - Chart on Market Overview
- Exhibits2: Executive Summary - Data Table on Market Overview
- Exhibits3: Executive Summary - Chart on Global Market Characteristics
- Exhibits4: Executive Summary - Chart on Market by Geography
- Exhibits5: Executive Summary - Chart on Market Segmentation by Technology
- Exhibits6: Executive Summary - Chart on Market Segmentation by Product
- Exhibits7: Executive Summary - Chart on Market Segmentation by End-user
- Exhibits8: Executive Summary - Chart on Incremental Growth
- Exhibits9: Executive Summary - Data Table on Incremental Growth
- Exhibits10: Executive Summary - Chart on Vendor Market Positioning
- Exhibits11: Parent market
- Exhibits12: Market Characteristics
- Exhibits13: Offerings of vendors included in the market definition
- Exhibits14: Market segments
- Exhibits15: Chart on Global - Market size and forecast 2022-2027 ($ million)
- Exhibits16: Data Table on Global - Market size and forecast 2022-2027 ($ million)
- Exhibits17: Chart on Global Market: Year-over-year growth 2022-2027 (%)
- Exhibits18: Data Table on Global Market: Year-over-year growth 2022-2027 (%)
- Exhibits19: Historic Market Size - Data Table on Global cardiac biomarkers market 2017 - 2021 ($ million)
- Exhibits20: Historic Market Size - Technology Segment 2017 - 2021 ($ million)
- Exhibits21: Historic Market Size - Product Segment 2017 - 2021 ($ million)
- Exhibits22: Historic Market Size - End-user Segment 2017 - 2021 ($ million)
- Exhibits23: Historic Market Size - Geography Segment 2017 - 2021 ($ million)
- Exhibits24: Historic Market Size - Country Segment 2017 - 2021 ($ million)
- Exhibits25: Five forces analysis - Comparison between 2022 and 2027
- Exhibits26: Chart on Bargaining power of buyers - Impact of key factors 2022 and 2027
- Exhibits27: Bargaining power of suppliers - Impact of key factors in 2022 and 2027
- Exhibits28: Threat of new entrants - Impact of key factors in 2022 and 2027
- Exhibits29: Threat of substitutes - Impact of key factors in 2022 and 2027
- Exhibits30: Threat of rivalry - Impact of key factors in 2022 and 2027
- Exhibits31: Chart on Market condition - Five forces 2022 and 2027
- Exhibits32: Chart on Technology - Market share 2022-2027 (%)
- Exhibits33: Data Table on Technology - Market share 2022-2027 (%)
- Exhibits34: Chart on Comparison by Technology
- Exhibits35: Data Table on Comparison by Technology
- Exhibits36: Chart on Conventional laboratory testing - Market size and forecast 2022-2027 ($ million)
- Exhibits37: Data Table on Conventional laboratory testing - Market size and forecast 2022-2027 ($ million)
- Exhibits38: Chart on Conventional laboratory testing - Year-over-year growth 2022-2027 (%)
- Exhibits39: Data Table on Conventional laboratory testing - Year-over-year growth 2022-2027 (%)
- Exhibits40: Chart on POC testing - Market size and forecast 2022-2027 ($ million)
- Exhibits41: Data Table on POC testing - Market size and forecast 2022-2027 ($ million)
- Exhibits42: Chart on POC testing - Year-over-year growth 2022-2027 (%)
- Exhibits43: Data Table on POC testing - Year-over-year growth 2022-2027 (%)
- Exhibits44: Market opportunity by Technology ($ million)
- Exhibits45: Chart on Product - Market share 2022-2027 (%)
- Exhibits46: Data Table on Product - Market share 2022-2027 (%)
- Exhibits47: Chart on Comparison by Product
- Exhibits48: Data Table on Comparison by Product
- Exhibits49: Chart on Troponin - Market size and forecast 2022-2027 ($ million)
- Exhibits50: Data Table on Troponin - Market size and forecast 2022-2027 ($ million)
- Exhibits51: Chart on Troponin - Year-over-year growth 2022-2027 (%)
- Exhibits52: Data Table on Troponin - Year-over-year growth 2022-2027 (%)
- Exhibits53: Chart on BNP and NT-proBNP - Market size and forecast 2022-2027 ($ million)
- Exhibits54: Data Table on BNP and NT-proBNP - Market size and forecast 2022-2027 ($ million)
- Exhibits55: Chart on BNP and NT-proBNP - Year-over-year growth 2022-2027 (%)
- Exhibits56: Data Table on BNP and NT-proBNP - Year-over-year growth 2022-2027 (%)
- Exhibits57: Chart on CK-MB - Market size and forecast 2022-2027 ($ million)
- Exhibits58: Data Table on CK-MB - Market size and forecast 2022-2027 ($ million)
- Exhibits59: Chart on CK-MB - Year-over-year growth 2022-2027 (%)
- Exhibits60: Data Table on CK-MB - Year-over-year growth 2022-2027 (%)
- Exhibits61: Chart on Myoglobin - Market size and forecast 2022-2027 ($ million)
- Exhibits62: Data Table on Myoglobin - Market size and forecast 2022-2027 ($ million)
- Exhibits63: Chart on Myoglobin - Year-over-year growth 2022-2027 (%)
- Exhibits64: Data Table on Myoglobin - Year-over-year growth 2022-2027 (%)
- Exhibits65: Chart on Others - Market size and forecast 2022-2027 ($ million)
- Exhibits66: Data Table on Others - Market size and forecast 2022-2027 ($ million)
- Exhibits67: Chart on Others - Year-over-year growth 2022-2027 (%)
- Exhibits68: Data Table on Others - Year-over-year growth 2022-2027 (%)
- Exhibits69: Market opportunity by Product ($ million)
- Exhibits70: Chart on End-user - Market share 2022-2027 (%)
- Exhibits71: Data Table on End-user - Market share 2022-2027 (%)
- Exhibits72: Chart on Comparison by End-user
- Exhibits73: Data Table on Comparison by End-user
- Exhibits74: Chart on Hospitals and clinics - Market size and forecast 2022-2027 ($ million)
- Exhibits75: Data Table on Hospitals and clinics - Market size and forecast 2022-2027 ($ million)
- Exhibits76: Chart on Hospitals and clinics - Year-over-year growth 2022-2027 (%)
- Exhibits77: Data Table on Hospitals and clinics - Year-over-year growth 2022-2027 (%)
- Exhibits78: Chart on Diagnostic laboratories - Market size and forecast 2022-2027 ($ million)
- Exhibits79: Data Table on Diagnostic laboratories - Market size and forecast 2022-2027 ($ million)
- Exhibits80: Chart on Diagnostic laboratories - Year-over-year growth 2022-2027 (%)
- Exhibits81: Data Table on Diagnostic laboratories - Year-over-year growth 2022-2027 (%)
- Exhibits82: Market opportunity by End-user ($ million)
- Exhibits83: Analysis of price sensitivity, lifecycle, customer purchase basket, adoption rates, and purchase criteria
- Exhibits84: Chart on Market share by geography 2022-2027 (%)
- Exhibits85: Data Table on Market share by geography 2022-2027 (%)
- Exhibits86: Chart on Geographic comparison
- Exhibits87: Data Table on Geographic comparison
- Exhibits88: Chart on North America - Market size and forecast 2022-2027 ($ million)
- Exhibits89: Data Table on North America - Market size and forecast 2022-2027 ($ million)
- Exhibits90: Chart on North America - Year-over-year growth 2022-2027 (%)
- Exhibits91: Data Table on North America - Year-over-year growth 2022-2027 (%)
- Exhibits92: Chart on Europe - Market size and forecast 2022-2027 ($ million)
- Exhibits93: Data Table on Europe - Market size and forecast 2022-2027 ($ million)
- Exhibits94: Chart on Europe - Year-over-year growth 2022-2027 (%)
- Exhibits95: Data Table on Europe - Year-over-year growth 2022-2027 (%)
- Exhibits96: Chart on Asia - Market size and forecast 2022-2027 ($ million)
- Exhibits97: Data Table on Asia - Market size and forecast 2022-2027 ($ million)
- Exhibits98: Chart on Asia - Year-over-year growth 2022-2027 (%)
- Exhibits99: Data Table on Asia - Year-over-year growth 2022-2027 (%)
- Exhibits100: Chart on Rest of World (ROW) - Market size and forecast 2022-2027 ($ million)
- Exhibits101: Data Table on Rest of World (ROW) - Market size and forecast 2022-2027 ($ million)
- Exhibits102: Chart on Rest of World (ROW) - Year-over-year growth 2022-2027 (%)
- Exhibits103: Data Table on Rest of World (ROW) - Year-over-year growth 2022-2027 (%)
- Exhibits104: Chart on US - Market size and forecast 2022-2027 ($ million)
- Exhibits105: Data Table on US - Market size and forecast 2022-2027 ($ million)
- Exhibits106: Chart on US - Year-over-year growth 2022-2027 (%)
- Exhibits107: Data Table on US - Year-over-year growth 2022-2027 (%)
- Exhibits108: Chart on Germany - Market size and forecast 2022-2027 ($ million)
- Exhibits109: Data Table on Germany - Market size and forecast 2022-2027 ($ million)
- Exhibits110: Chart on Germany - Year-over-year growth 2022-2027 (%)
- Exhibits111: Data Table on Germany - Year-over-year growth 2022-2027 (%)
- Exhibits112: Chart on China - Market size and forecast 2022-2027 ($ million)
- Exhibits113: Data Table on China - Market size and forecast 2022-2027 ($ million)
- Exhibits114: Chart on China - Year-over-year growth 2022-2027 (%)
- Exhibits115: Data Table on China - Year-over-year growth 2022-2027 (%)
- Exhibits116: Chart on UK - Market size and forecast 2022-2027 ($ million)
- Exhibits117: Data Table on UK - Market size and forecast 2022-2027 ($ million)
- Exhibits118: Chart on UK - Year-over-year growth 2022-2027 (%)
- Exhibits119: Data Table on UK - Year-over-year growth 2022-2027 (%)
- Exhibits120: Chart on India - Market size and forecast 2022-2027 ($ million)
- Exhibits121: Data Table on India - Market size and forecast 2022-2027 ($ million)
- Exhibits122: Chart on India - Year-over-year growth 2022-2027 (%)
- Exhibits123: Data Table on India - Year-over-year growth 2022-2027 (%)
- Exhibits124: Market opportunity by geography ($ million)
- Exhibits125: Impact of drivers and challenges in 2022 and 2027
- Exhibits126: Overview on Criticality of inputs and Factors of differentiation
- Exhibits127: Overview on factors of disruption
- Exhibits128: Impact of key risks on business
- Exhibits129: Vendors covered
- Exhibits130: Matrix on vendor position and classification
- Exhibits131: Abbott Laboratories - Overview
- Exhibits132: Abbott Laboratories - Business segments
- Exhibits133: Abbott Laboratories - Key news
- Exhibits134: Abbott Laboratories - Key offerings
- Exhibits135: Abbott Laboratories - Segment focus
- Exhibits136: BG Medicine Inc. - Overview
- Exhibits137: BG Medicine Inc. - Product / Service
- Exhibits138: BG Medicine Inc. - Key offerings
- Exhibits139: Bio Rad Laboratories Inc. - Overview
- Exhibits140: Bio Rad Laboratories Inc. - Business segments
- Exhibits141: Bio Rad Laboratories Inc. - Key news
- Exhibits142: Bio Rad Laboratories Inc. - Key offerings
- Exhibits143: Bio Rad Laboratories Inc. - Segment focus
- Exhibits144: bioMerieux SA - Overview
- Exhibits145: bioMerieux SA - Product / Service
- Exhibits146: bioMerieux SA - Key news
- Exhibits147: bioMerieux SA - Key offerings
- Exhibits148: Boditech Med Inc. - Overview
- Exhibits149: Boditech Med Inc. - Key offerings
- Exhibits150: Creative Diagnostics - Overview
- Exhibits151: Creative Diagnostics - Product / Service
- Exhibits152: Creative Diagnostics - Key offerings
- Exhibits153: Diazyme Laboratories Inc. - Overview
- Exhibits154: Diazyme Laboratories Inc. - Product / Service
- Exhibits155: Diazyme Laboratories Inc. - Key offerings
- Exhibits156: F. Hoffmann La Roche Ltd. - Overview
- Exhibits157: F. Hoffmann La Roche Ltd. - Business segments
- Exhibits158: F. Hoffmann La Roche Ltd. - Key news
- Exhibits159: F. Hoffmann La Roche Ltd. - Key offerings
- Exhibits160: F. Hoffmann La Roche Ltd. - Segment focus
- Exhibits161: Lepu Medical Technology Beijing Co. Ltd. - Overview
- Exhibits162: Lepu Medical Technology Beijing Co. Ltd. - Product / Service
- Exhibits163: Lepu Medical Technology Beijing Co. Ltd. - Key offerings
- Exhibits164: LifeSign LLC - Overview
- Exhibits165: LifeSign LLC - Product / Service
- Exhibits166: LifeSign LLC - Key offerings
- Exhibits167: LSI Medience Corp. - Overview
- Exhibits168: LSI Medience Corp. - Product / Service
- Exhibits169: LSI Medience Corp. - Key offerings
- Exhibits170: Randox Laboratories Ltd. - Overview
- Exhibits171: Randox Laboratories Ltd. - Product / Service
- Exhibits172: Randox Laboratories Ltd. - Key offerings
- Exhibits173: Response Biomedical Corp. - Overview
- Exhibits174: Response Biomedical Corp. - Product / Service
- Exhibits175: Response Biomedical Corp. - Key offerings
- Exhibits176: Siemens Healthineers AG - Overview
- Exhibits177: Siemens Healthineers AG - Business segments
- Exhibits178: Siemens Healthineers AG - Key news
- Exhibits179: Siemens Healthineers AG - Key offerings
- Exhibits180: Siemens Healthineers AG - Segment focus
- Exhibits181: Signosis Inc. - Overview
- Exhibits182: Signosis Inc. - Product / Service
- Exhibits183: Signosis Inc. - Key offerings
- Exhibits184: Inclusions checklist
- Exhibits185: Exclusions checklist
- Exhibits186: Currency conversion rates for US$
- Exhibits187: Research methodology
- Exhibits188: Validation techniques employed for market sizing
- Exhibits189: Information sources
- Exhibits190: List of abbreviations
Technavio has been monitoring the cardiac biomarkers market and is forecast to grow by $7880.86 mn during 2022-2027, accelerating at a CAGR of 12.6% during the forecast period. Our report on the cardiac biomarkers market provides a holistic analysis, market size and forecast, trends, growth drivers, and challenges, as well as vendor analysis covering around 25 vendors.
The report offers an up-to-date analysis regarding the current market scenario, the latest trends and drivers, and the overall market environment. The market is driven by increasing prevalence of CVDs, growing geriatric population, and rising number of M&A and new product launches.
Technavio's cardiac biomarkers market is segmented as below:
By Technology
- Conventional laboratory testing
- POC testing
By Product
- Troponin
- BNP and NT-proBNP
- CK-MB
- Myoglobin
- Others
By End-user
- Hospitals
- clinics
- Diagnostic laboratories
By Geography
- North America
- Europe
- Asia
- Rest of World (ROW)
This study identifies the increased focus on personalized medicine as one of the prime reasons driving the cardiac biomarkers market growth during the next few years. Also, use of digital health in rapid diagnostics for POC and advances in technology will lead to sizable demand in the market.
Technavio presents a detailed picture of the market by the way of study, synthesis, and summation of data from multiple sources by an analysis of key parameters. Our report on the cardiac biomarkers market covers the following areas:
- Cardiac biomarkers market sizing
- Cardiac biomarkers market forecast
- Cardiac biomarkers market industry analysis
Technavio's robust vendor analysis is designed to help clients improve their market position, and in line with this, this report provides a detailed analysis of several leading cardiac biomarkers market vendors that include Abbott Laboratories, Advanced ImmunoChemical Inc., BG Medicine Inc., Bio Rad Laboratories Inc., bioMerieux SA, Boditech Med Inc., Creative Diagnostics, Danaher Corp., Diazyme Laboratories Inc., F. Hoffmann La Roche Ltd., Lepu Medical Technology Beijing Co. Ltd., LifeSign LLC, LSI Medience Corp., Noavaran Payesh Aani Salamat. Co., Oy Medix Biochemica Ab, Randox Laboratories Ltd., Response Biomedical Corp., Siemens Healthineers AG, Signosis Inc., AgPlus Diagnostics Ltd., and Tosoh Corp. Also, the cardiac biomarkers market analysis report includes information on upcoming trends and challenges that will influence market growth. This is to help companies strategize and leverage all forthcoming growth opportunities.
The study was conducted using an objective combination of primary and secondary information including inputs from key participants in the industry. The report contains a comprehensive market and vendor landscape in addition to an analysis of the key vendors.
Technavio presents a detailed picture of the market by the way of study, synthesis, and summation of data from multiple sources by an analysis of key parameters such as profit, pricing, competition, and promotions. It presents various market facets by identifying the key industry influencers. The data presented is comprehensive, reliable, and a result of extensive research - both primary and secondary. Technavio's market research reports provide a complete competitive landscape and an in-depth vendor selection methodology and analysis using qualitative and quantitative research to forecast accurate market growth.
Table of Contents
1 Executive Summary
- 1.1 Market overview
- Exhibit 01: Executive Summary - Chart on Market Overview
- Exhibit 02: Executive Summary - Data Table on Market Overview
- Exhibit 03: Executive Summary - Chart on Global Market Characteristics
- Exhibit 04: Executive Summary - Chart on Market by Geography
- Exhibit 05: Executive Summary - Chart on Market Segmentation by Technology
- Exhibit 06: Executive Summary - Chart on Market Segmentation by Product
- Exhibit 07: Executive Summary - Chart on Market Segmentation by End-user
- Exhibit 08: Executive Summary - Chart on Incremental Growth
- Exhibit 09: Executive Summary - Data Table on Incremental Growth
- Exhibit 10: Executive Summary - Chart on Vendor Market Positioning
2 Market Landscape
- 2.1 Market ecosystem
- Exhibit 11: Parent market
- Exhibit 12: Market Characteristics
3 Market Sizing
- 3.1 Market definition
- Exhibit 13: Offerings of vendors included in the market definition
- 3.2 Market segment analysis
- Exhibit 14: Market segments
- 3.3 Market size 2022
- 3.4 Market outlook: Forecast for 2022-2027
- Exhibit 15: Chart on Global - Market size and forecast 2022-2027 ($ million)
- Exhibit 16: Data Table on Global - Market size and forecast 2022-2027 ($ million)
- Exhibit 17: Chart on Global Market: Year-over-year growth 2022-2027 (%)
- Exhibit 18: Data Table on Global Market: Year-over-year growth 2022-2027 (%)
4 Historic Market Size
- 4.1 Global cardiac biomarkers market 2017 - 2021
- Exhibit 19: Historic Market Size - Data Table on Global cardiac biomarkers market 2017 - 2021 ($ million)
- 4.2 Technology Segment Analysis 2017 - 2021
- Exhibit 20: Historic Market Size - Technology Segment 2017 - 2021 ($ million)
- 4.3 Product Segment Analysis 2017 - 2021
- Exhibit 21: Historic Market Size - Product Segment 2017 - 2021 ($ million)
- 4.4 End-user Segment Analysis 2017 - 2021
- Exhibit 22: Historic Market Size - End-user Segment 2017 - 2021 ($ million)
- 4.5 Geography Segment Analysis 2017 - 2021
- Exhibit 23: Historic Market Size - Geography Segment 2017 - 2021 ($ million)
- 4.6 Country Segment Analysis 2017 - 2021
- Exhibit 24: Historic Market Size - Country Segment 2017 - 2021 ($ million)
5 Five Forces Analysis
- 5.1 Five forces summary
- Exhibit 25: Five forces analysis - Comparison between 2022 and 2027
- 5.2 Bargaining power of buyers
- Exhibit 26: Chart on Bargaining power of buyers - Impact of key factors 2022 and 2027
- 5.3 Bargaining power of suppliers
- Exhibit 27: Bargaining power of suppliers - Impact of key factors in 2022 and 2027
- 5.4 Threat of new entrants
- Exhibit 28: Threat of new entrants - Impact of key factors in 2022 and 2027
- 5.5 Threat of substitutes
- Exhibit 29: Threat of substitutes - Impact of key factors in 2022 and 2027
- 5.6 Threat of rivalry
- Exhibit 30: Threat of rivalry - Impact of key factors in 2022 and 2027
- 5.7 Market condition
- Exhibit 31: Chart on Market condition - Five forces 2022 and 2027
6 Market Segmentation by Technology
- 6.1 Market segments
- Exhibit 32: Chart on Technology - Market share 2022-2027 (%)
- Exhibit 33: Data Table on Technology - Market share 2022-2027 (%)
- 6.2 Comparison by Technology
- Exhibit 34: Chart on Comparison by Technology
- Exhibit 35: Data Table on Comparison by Technology
- 6.3 Conventional laboratory testing - Market size and forecast 2022-2027
- Exhibit 36: Chart on Conventional laboratory testing - Market size and forecast 2022-2027 ($ million)
- Exhibit 37: Data Table on Conventional laboratory testing - Market size and forecast 2022-2027 ($ million)
- Exhibit 38: Chart on Conventional laboratory testing - Year-over-year growth 2022-2027 (%)
- Exhibit 39: Data Table on Conventional laboratory testing - Year-over-year growth 2022-2027 (%)
- 6.4 POC testing - Market size and forecast 2022-2027
- Exhibit 40: Chart on POC testing - Market size and forecast 2022-2027 ($ million)
- Exhibit 41: Data Table on POC testing - Market size and forecast 2022-2027 ($ million)
- Exhibit 42: Chart on POC testing - Year-over-year growth 2022-2027 (%)
- Exhibit 43: Data Table on POC testing - Year-over-year growth 2022-2027 (%)
- 6.5 Market opportunity by Technology
- Exhibit 44: Market opportunity by Technology ($ million)
7 Market Segmentation by Product
- 7.1 Market segments
- Exhibit 45: Chart on Product - Market share 2022-2027 (%)
- Exhibit 46: Data Table on Product - Market share 2022-2027 (%)
- 7.2 Comparison by Product
- Exhibit 47: Chart on Comparison by Product
- Exhibit 48: Data Table on Comparison by Product
- 7.3 Troponin - Market size and forecast 2022-2027
- Exhibit 49: Chart on Troponin - Market size and forecast 2022-2027 ($ million)
- Exhibit 50: Data Table on Troponin - Market size and forecast 2022-2027 ($ million)
- Exhibit 51: Chart on Troponin - Year-over-year growth 2022-2027 (%)
- Exhibit 52: Data Table on Troponin - Year-over-year growth 2022-2027 (%)
- 7.4 BNP and NT-proBNP - Market size and forecast 2022-2027
- Exhibit 53: Chart on BNP and NT-proBNP - Market size and forecast 2022-2027 ($ million)
- Exhibit 54: Data Table on BNP and NT-proBNP - Market size and forecast 2022-2027 ($ million)
- Exhibit 55: Chart on BNP and NT-proBNP - Year-over-year growth 2022-2027 (%)
- Exhibit 56: Data Table on BNP and NT-proBNP - Year-over-year growth 2022-2027 (%)
- 7.5 CK-MB - Market size and forecast 2022-2027
- Exhibit 57: Chart on CK-MB - Market size and forecast 2022-2027 ($ million)
- Exhibit 58: Data Table on CK-MB - Market size and forecast 2022-2027 ($ million)
- Exhibit 59: Chart on CK-MB - Year-over-year growth 2022-2027 (%)
- Exhibit 60: Data Table on CK-MB - Year-over-year growth 2022-2027 (%)
- 7.6 Myoglobin - Market size and forecast 2022-2027
- Exhibit 61: Chart on Myoglobin - Market size and forecast 2022-2027 ($ million)
- Exhibit 62: Data Table on Myoglobin - Market size and forecast 2022-2027 ($ million)
- Exhibit 63: Chart on Myoglobin - Year-over-year growth 2022-2027 (%)
- Exhibit 64: Data Table on Myoglobin - Year-over-year growth 2022-2027 (%)
- 7.7 Others - Market size and forecast 2022-2027
- Exhibit 65: Chart on Others - Market size and forecast 2022-2027 ($ million)
- Exhibit 66: Data Table on Others - Market size and forecast 2022-2027 ($ million)
- Exhibit 67: Chart on Others - Year-over-year growth 2022-2027 (%)
- Exhibit 68: Data Table on Others - Year-over-year growth 2022-2027 (%)
- 7.8 Market opportunity by Product
- Exhibit 69: Market opportunity by Product ($ million)
8 Market Segmentation by End-user
- 8.1 Market segments
- Exhibit 70: Chart on End-user - Market share 2022-2027 (%)
- Exhibit 71: Data Table on End-user - Market share 2022-2027 (%)
- 8.2 Comparison by End-user
- Exhibit 72: Chart on Comparison by End-user
- Exhibit 73: Data Table on Comparison by End-user
- 8.3 Hospitals and clinics - Market size and forecast 2022-2027
- Exhibit 74: Chart on Hospitals and clinics - Market size and forecast 2022-2027 ($ million)
- Exhibit 75: Data Table on Hospitals and clinics - Market size and forecast 2022-2027 ($ million)
- Exhibit 76: Chart on Hospitals and clinics - Year-over-year growth 2022-2027 (%)
- Exhibit 77: Data Table on Hospitals and clinics - Year-over-year growth 2022-2027 (%)
- 8.4 Diagnostic laboratories - Market size and forecast 2022-2027
- Exhibit 78: Chart on Diagnostic laboratories - Market size and forecast 2022-2027 ($ million)
- Exhibit 79: Data Table on Diagnostic laboratories - Market size and forecast 2022-2027 ($ million)
- Exhibit 80: Chart on Diagnostic laboratories - Year-over-year growth 2022-2027 (%)
- Exhibit 81: Data Table on Diagnostic laboratories - Year-over-year growth 2022-2027 (%)
- 8.5 Market opportunity by End-user
- Exhibit 82: Market opportunity by End-user ($ million)
9 Customer Landscape
- 9.1 Customer landscape overview
- Exhibit 83: Analysis of price sensitivity, lifecycle, customer purchase basket, adoption rates, and purchase criteria
10 Geographic Landscape
- 10.1 Geographic segmentation
- Exhibit 84: Chart on Market share by geography 2022-2027 (%)
- Exhibit 85: Data Table on Market share by geography 2022-2027 (%)
- 10.2 Geographic comparison
- Exhibit 86: Chart on Geographic comparison
- Exhibit 87: Data Table on Geographic comparison
- 10.3 North America - Market size and forecast 2022-2027
- Exhibit 88: Chart on North America - Market size and forecast 2022-2027 ($ million)
- Exhibit 89: Data Table on North America - Market size and forecast 2022-2027 ($ million)
- Exhibit 90: Chart on North America - Year-over-year growth 2022-2027 (%)
- Exhibit 91: Data Table on North America - Year-over-year growth 2022-2027 (%)
- 10.4 Europe - Market size and forecast 2022-2027
- Exhibit 92: Chart on Europe - Market size and forecast 2022-2027 ($ million)
- Exhibit 93: Data Table on Europe - Market size and forecast 2022-2027 ($ million)
- Exhibit 94: Chart on Europe - Year-over-year growth 2022-2027 (%)
- Exhibit 95: Data Table on Europe - Year-over-year growth 2022-2027 (%)
- 10.5 Asia - Market size and forecast 2022-2027
- Exhibit 96: Chart on Asia - Market size and forecast 2022-2027 ($ million)
- Exhibit 97: Data Table on Asia - Market size and forecast 2022-2027 ($ million)
- Exhibit 98: Chart on Asia - Year-over-year growth 2022-2027 (%)
- Exhibit 99: Data Table on Asia - Year-over-year growth 2022-2027 (%)
- 10.6 Rest of World (ROW) - Market size and forecast 2022-2027
- Exhibit 100: Chart on Rest of World (ROW) - Market size and forecast 2022-2027 ($ million)
- Exhibit 101: Data Table on Rest of World (ROW) - Market size and forecast 2022-2027 ($ million)
- Exhibit 102: Chart on Rest of World (ROW) - Year-over-year growth 2022-2027 (%)
- Exhibit 103: Data Table on Rest of World (ROW) - Year-over-year growth 2022-2027 (%)
- 10.7 US - Market size and forecast 2022-2027
- Exhibit 104: Chart on US - Market size and forecast 2022-2027 ($ million)
- Exhibit 105: Data Table on US - Market size and forecast 2022-2027 ($ million)
- Exhibit 106: Chart on US - Year-over-year growth 2022-2027 (%)
- Exhibit 107: Data Table on US - Year-over-year growth 2022-2027 (%)
- 10.8 Germany - Market size and forecast 2022-2027
- Exhibit 108: Chart on Germany - Market size and forecast 2022-2027 ($ million)
- Exhibit 109: Data Table on Germany - Market size and forecast 2022-2027 ($ million)
- Exhibit 110: Chart on Germany - Year-over-year growth 2022-2027 (%)
- Exhibit 111: Data Table on Germany - Year-over-year growth 2022-2027 (%)
- 10.9 China - Market size and forecast 2022-2027
- Exhibit 112: Chart on China - Market size and forecast 2022-2027 ($ million)
- Exhibit 113: Data Table on China - Market size and forecast 2022-2027 ($ million)
- Exhibit 114: Chart on China - Year-over-year growth 2022-2027 (%)
- Exhibit 115: Data Table on China - Year-over-year growth 2022-2027 (%)
- 10.10 UK - Market size and forecast 2022-2027
- Exhibit 116: Chart on UK - Market size and forecast 2022-2027 ($ million)
- Exhibit 117: Data Table on UK - Market size and forecast 2022-2027 ($ million)
- Exhibit 118: Chart on UK - Year-over-year growth 2022-2027 (%)
- Exhibit 119: Data Table on UK - Year-over-year growth 2022-2027 (%)
- 10.11 India - Market size and forecast 2022-2027
- Exhibit 120: Chart on India - Market size and forecast 2022-2027 ($ million)
- Exhibit 121: Data Table on India - Market size and forecast 2022-2027 ($ million)
- Exhibit 122: Chart on India - Year-over-year growth 2022-2027 (%)
- Exhibit 123: Data Table on India - Year-over-year growth 2022-2027 (%)
- 10.12 Market opportunity by geography
- Exhibit 124: Market opportunity by geography ($ million)
11 Drivers, Challenges, and Trends
- 11.1 Market drivers
- 11.2 Market challenges
- 11.3 Impact of drivers and challenges
- Exhibit 125: Impact of drivers and challenges in 2022 and 2027
- 11.4 Market trends
12 Vendor Landscape
- 12.1 Overview
- 12.2 Vendor landscape
- Exhibit 126: Overview on Criticality of inputs and Factors of differentiation
- 12.3 Landscape disruption
- Exhibit 127: Overview on factors of disruption
- 12.4 Industry risks
- Exhibit 128: Impact of key risks on business
13 Vendor Analysis
- 13.1 Vendors covered
- Exhibit 129: Vendors covered
- 13.2 Market positioning of vendors
- Exhibit 130: Matrix on vendor position and classification
- 13.3 Abbott Laboratories
- Exhibit 131: Abbott Laboratories - Overview
- Exhibit 132: Abbott Laboratories - Business segments
- Exhibit 133: Abbott Laboratories - Key news
- Exhibit 134: Abbott Laboratories - Key offerings
- Exhibit 135: Abbott Laboratories - Segment focus
- 13.4 BG Medicine Inc.
- Exhibit 136: BG Medicine Inc. - Overview
- Exhibit 137: BG Medicine Inc. - Product / Service
- Exhibit 138: BG Medicine Inc. - Key offerings
- 13.5 Bio Rad Laboratories Inc.
- Exhibit 139: Bio Rad Laboratories Inc. - Overview
- Exhibit 140: Bio Rad Laboratories Inc. - Business segments
- Exhibit 141: Bio Rad Laboratories Inc. - Key news
- Exhibit 142: Bio Rad Laboratories Inc. - Key offerings
- Exhibit 143: Bio Rad Laboratories Inc. - Segment focus
- 13.6 bioMerieux SA
- Exhibit 144: bioMerieux SA - Overview
- Exhibit 145: bioMerieux SA - Product / Service
- Exhibit 146: bioMerieux SA - Key news
- Exhibit 147: bioMerieux SA - Key offerings
- 13.7 Boditech Med Inc.
- Exhibit 148: Boditech Med Inc. - Overview
- Exhibit 149: Boditech Med Inc. - Key offerings
- 13.8 Creative Diagnostics
- Exhibit 150: Creative Diagnostics - Overview
- Exhibit 151: Creative Diagnostics - Product / Service
- Exhibit 152: Creative Diagnostics - Key offerings
- 13.9 Diazyme Laboratories Inc.
- Exhibit 153: Diazyme Laboratories Inc. - Overview
- Exhibit 154: Diazyme Laboratories Inc. - Product / Service
- Exhibit 155: Diazyme Laboratories Inc. - Key offerings
- 13.10 F. Hoffmann La Roche Ltd.
- Exhibit 156: F. Hoffmann La Roche Ltd. - Overview
- Exhibit 157: F. Hoffmann La Roche Ltd. - Business segments
- Exhibit 158: F. Hoffmann La Roche Ltd. - Key news
- Exhibit 159: F. Hoffmann La Roche Ltd. - Key offerings
- Exhibit 160: F. Hoffmann La Roche Ltd. - Segment focus
- 13.11 Lepu Medical Technology Beijing Co. Ltd.
- Exhibit 161: Lepu Medical Technology Beijing Co. Ltd. - Overview
- Exhibit 162: Lepu Medical Technology Beijing Co. Ltd. - Product / Service
- Exhibit 163: Lepu Medical Technology Beijing Co. Ltd. - Key offerings
- 13.12 LifeSign LLC
- Exhibit 164: LifeSign LLC - Overview
- Exhibit 165: LifeSign LLC - Product / Service
- Exhibit 166: LifeSign LLC - Key offerings
- 13.13 LSI Medience Corp.
- Exhibit 167: LSI Medience Corp. - Overview
- Exhibit 168: LSI Medience Corp. - Product / Service
- Exhibit 169: LSI Medience Corp. - Key offerings
- 13.14 Randox Laboratories Ltd.
- Exhibit 170: Randox Laboratories Ltd. - Overview
- Exhibit 171: Randox Laboratories Ltd. - Product / Service
- Exhibit 172: Randox Laboratories Ltd. - Key offerings
- 13.15 Response Biomedical Corp.
- Exhibit 173: Response Biomedical Corp. - Overview
- Exhibit 174: Response Biomedical Corp. - Product / Service
- Exhibit 175: Response Biomedical Corp. - Key offerings
- 13.16 Siemens Healthineers AG
- Exhibit 176: Siemens Healthineers AG - Overview
- Exhibit 177: Siemens Healthineers AG - Business segments
- Exhibit 178: Siemens Healthineers AG - Key news
- Exhibit 179: Siemens Healthineers AG - Key offerings
- Exhibit 180: Siemens Healthineers AG - Segment focus
- 13.17 Signosis Inc.
- Exhibit 181: Signosis Inc. - Overview
- Exhibit 182: Signosis Inc. - Product / Service
- Exhibit 183: Signosis Inc. - Key offerings
14 Appendix
- 14.1 Scope of the report
- 14.2 Inclusions and exclusions checklist
- Exhibit 184: Inclusions checklist
- Exhibit 185: Exclusions checklist
- 14.3 Currency conversion rates for US$
- Exhibit 186: Currency conversion rates for US$
- 14.4 Research methodology
- Exhibit 187: Research methodology
- Exhibit 188: Validation techniques employed for market sizing
- Exhibit 189: Information sources
- 14.5 List of abbreviations
- Exhibit 190: List of abbreviations
- investments in R and D by biotechnology firms and federal agencies: Biotechnology companies and research organizations are investing significantly in R and D activities to develop new technologies to improve the quality and standards of their products. They are investing in proteomics, drug testing, high-throughput screening, combinational chemistry, and the development of highly innovative environment-friendly biotechnology reagents. Increased R and D has led to improved healthcare access in the US, countries in Europe, as well as in emerging markets such as China and India, which drives the demand for biotechnology reagents.