|
|
市場調査レポート
商品コード
1645464
四肢用製品の世界市場 (2025~2029年)Global Extremity Products Market 2025-2029 |
||||||

|
|||||||
カスタマイズ可能
|
|||||||


| 四肢用製品の世界市場 (2025~2029年) |
|
出版日: 2025年01月09日
発行: TechNavio
ページ情報: 英文 196 Pages
納期: 即納可能
|

全表示
- 概要
- 図表
- 目次
四肢用製品市場は2024~2029年に20億7,780万米ドル、予測期間中のCAGRは9.7%で成長すると予測されています。
この調査レポートは、四肢用製品市場の全体分析、市場規模・予測、動向、成長促進要因、課題、約25のベンダーを網羅したベンダー分析などを掲載しています。
現在の市場シナリオ、最新動向と促進要因、市場環境全体に関する最新分析を提供しています。市場は、整形外科疾患の有病率の上昇、四肢用製品に対する認識と投資の高まり、高齢者人口の増加によって牽引されています。
| 市場範囲 | |
|---|---|
| 基準年 | 2025年 |
| 終了年 | 2029年 |
| 予測期間 | 2025~2029年 |
| 成長モメンタム | 加速 |
| 前年比2025年 | 8.6% |
| CAGR | 9.7% |
| 増分額 | 20億7,780万米ドル |
本調査では、今後数年間における四肢用製品市場の成長を促進する主な要因の1つとして、整形外科学会数の増加を挙げています。また、M&A活動の増加やデジタルエンゲージメントの増加も市場の大きな需要につながります。
目次
第1章 エグゼクティブサマリー
- 市場概要
第2章 Technavioの分析
- 価格感度・ライフサイクル・顧客購入バスケット・採用率・購入基準の分析
- インプットの重要性と差別化の要因
- ディスラプションの要因
- 促進要因と課題の影響
第3章 市場情勢
- 市場エコシステム
- 市場の特徴
- バリューチェーン分析
第4章 市場規模
- 市場の定義
- 市場セグメント分析
- 市場規模 (2024年)
- 市場展望 (2024~2029年)
第5章 市場規模実績
- 四肢用製品の世界市場 (2019~2023年)
- タイプ別セグメント分析 (2019~2023年)
- エンドユーザー別セグメント分析 (2019~2023年)
- 地域別セグメント分析 (2019~2023年)
- 国別セグメント分析 (2019~2023年)
第6章 定性分析
- AIの影響:四肢用製品の世界市場
第7章 ファイブフォース分析
- ファイブフォースの要約
- 買い手の交渉力
- 供給企業の交渉力
- 新規参入業者の脅威
- 代替品の脅威
- 競争の脅威
- 市況
第8章 市場セグメンテーション:タイプ別
- 市場セグメント
- 比較:タイプ別
- 上肢:市場規模と予測 (2024~2029年)
- 下肢:市場規模と予測 (2024~2029年)
- 市場機会:タイプ別
第9章 市場セグメンテーション:エンドユーザー別
- 市場セグメント
- 比較:エンドユーザー別
- 病院:市場規模と予測 (2024~2029年)
- クリニック:市場規模と予測 (2024~2029年)
- ASC:市場規模と予測 (2024~2029年)
- 市場機会:エンドユーザー別
第10章 顧客情勢
- 顧客情勢の概要
第11章 地域別情勢
- 地域別セグメンテーション
- 地域別比較
- 北米:市場規模と予測 (2024~2029年)
- 欧州:市場規模と予測 (2024~2029年)
- アジア:市場規模と予測 (2024~2029年)
- 世界のその他の地域:市場規模と予測 (2024~2029年)
- 米国:市場規模と予測 (2024~2029年)
- 英国:市場規模と予測 (2024~2029年)
- カナダ:市場規模と予測 (2024~2029年)
- 中国:市場規模と予測 (2024~2029年)
- インド:市場規模と予測 (2024~2029年)
- ドイツ:市場規模と予測 (2024~2029年)
- フランス:市場規模と予測 (2024~2029年)
- 日本:市場規模と予測 (2024~2029年)
- 韓国:市場規模と予測 (2024~2029年)
- イタリア:市場規模と予測 (2024~2029年)
- 市場機会:地域情勢別
第12章 促進要因・課題・機会・抑制要因
- 市場促進要因
- 市場の課題
- 促進要因と課題の影響
- 市場の機会・抑制要因
第13章 競合情勢
- 概要
- 競合情勢
- ディスラプションの状況
- 業界のリスク
第14章 競合分析
- 企業プロファイル
- 企業ランキング指数
- 企業の市場ポジショニング
- Acumed LLC
- Arthrex Inc.
- Aspire Medical Innovation
- Breg Inc.
- Conmed Corp.
- Exactech Inc.
- Extremity Medical LLC
- In2Bones Corp.
- Johnson and Johnson Inc.
- Skeletal Dynamics LLC
- Smith and Nephew plc
- Stryker Corp.
- Wright Medical Group NV
- Zimmer Biomet Holdings Inc.
第15章 付録
Exhibits:
- Exhibits1: Executive Summary - Chart on Market Overview
- Exhibits2: Executive Summary - Data Table on Market Overview
- Exhibits3: Executive Summary - Chart on Global Market Characteristics
- Exhibits4: Executive Summary - Chart on Market By Geographical Landscape
- Exhibits5: Executive Summary - Chart on Market Segmentation by Type
- Exhibits6: Executive Summary - Chart on Market Segmentation by End-user
- Exhibits7: Executive Summary - Chart on Incremental Growth
- Exhibits8: Executive Summary - Data Table on Incremental Growth
- Exhibits9: Executive Summary - Chart on Company Market Positioning
- Exhibits10: Analysis of price sensitivity, lifecycle, customer purchase basket, adoption rates, and purchase criteria
- Exhibits11: Overview on criticality of inputs and factors of differentiation
- Exhibits12: Overview on factors of disruption
- Exhibits13: Impact of drivers and challenges in 2024 and 2029
- Exhibits14: Parent Market
- Exhibits15: Data Table on - Parent Market
- Exhibits16: Market characteristics analysis
- Exhibits17: Value chain analysis
- Exhibits18: Offerings of companies included in the market definition
- Exhibits19: Market segments
- Exhibits20: Chart on Global - Market size and forecast 2024-2029 ($ million)
- Exhibits21: Data Table on Global - Market size and forecast 2024-2029 ($ million)
- Exhibits22: Chart on Global Market: Year-over-year growth 2024-2029 (%)
- Exhibits23: Data Table on Global Market: Year-over-year growth 2024-2029 (%)
- Exhibits24: Historic Market Size - Data Table on Global Extremity Products Market 2019 - 2023 ($ million)
- Exhibits25: Historic Market Size - Type Segment 2019 - 2023 ($ million)
- Exhibits26: Historic Market Size - End-user Segment 2019 - 2023 ($ million)
- Exhibits27: Historic Market Size - Geography Segment 2019 - 2023 ($ million)
- Exhibits28: Historic Market Size - Country Segment 2019 - 2023 ($ million)
- Exhibits29: Five forces analysis - Comparison between 2024 and 2029
- Exhibits30: Bargaining power of buyers - Impact of key factors 2024 and 2029
- Exhibits31: Bargaining power of suppliers - Impact of key factors in 2024 and 2029
- Exhibits32: Threat of new entrants - Impact of key factors in 2024 and 2029
- Exhibits33: Threat of substitutes - Impact of key factors in 2024 and 2029
- Exhibits34: Threat of rivalry - Impact of key factors in 2024 and 2029
- Exhibits35: Chart on Market condition - Five forces 2024 and 2029
- Exhibits36: Chart on Type - Market share 2024-2029 (%)
- Exhibits37: Data Table on Type - Market share 2024-2029 (%)
- Exhibits38: Chart on Comparison by Type
- Exhibits39: Data Table on Comparison by Type
- Exhibits40: Chart on Upper extremities - Market size and forecast 2024-2029 ($ million)
- Exhibits41: Data Table on Upper extremities - Market size and forecast 2024-2029 ($ million)
- Exhibits42: Chart on Upper extremities - Year-over-year growth 2024-2029 (%)
- Exhibits43: Data Table on Upper extremities - Year-over-year growth 2024-2029 (%)
- Exhibits44: Chart on Lower extremities - Market size and forecast 2024-2029 ($ million)
- Exhibits45: Data Table on Lower extremities - Market size and forecast 2024-2029 ($ million)
- Exhibits46: Chart on Lower extremities - Year-over-year growth 2024-2029 (%)
- Exhibits47: Data Table on Lower extremities - Year-over-year growth 2024-2029 (%)
- Exhibits48: Market opportunity by Type ($ million)
- Exhibits49: Data Table on Market opportunity by Type ($ million)
- Exhibits50: Chart on End-user - Market share 2024-2029 (%)
- Exhibits51: Data Table on End-user - Market share 2024-2029 (%)
- Exhibits52: Chart on Comparison by End-user
- Exhibits53: Data Table on Comparison by End-user
- Exhibits54: Chart on Hospitals - Market size and forecast 2024-2029 ($ million)
- Exhibits55: Data Table on Hospitals - Market size and forecast 2024-2029 ($ million)
- Exhibits56: Chart on Hospitals - Year-over-year growth 2024-2029 (%)
- Exhibits57: Data Table on Hospitals - Year-over-year growth 2024-2029 (%)
- Exhibits58: Chart on Clinics - Market size and forecast 2024-2029 ($ million)
- Exhibits59: Data Table on Clinics - Market size and forecast 2024-2029 ($ million)
- Exhibits60: Chart on Clinics - Year-over-year growth 2024-2029 (%)
- Exhibits61: Data Table on Clinics - Year-over-year growth 2024-2029 (%)
- Exhibits62: Chart on ASCs - Market size and forecast 2024-2029 ($ million)
- Exhibits63: Data Table on ASCs - Market size and forecast 2024-2029 ($ million)
- Exhibits64: Chart on ASCs - Year-over-year growth 2024-2029 (%)
- Exhibits65: Data Table on ASCs - Year-over-year growth 2024-2029 (%)
- Exhibits66: Market opportunity by End-user ($ million)
- Exhibits67: Data Table on Market opportunity by End-user ($ million)
- Exhibits68: Analysis of price sensitivity, lifecycle, customer purchase basket, adoption rates, and purchase criteria
- Exhibits69: Chart on Market share By Geographical Landscape 2024-2029 (%)
- Exhibits70: Data Table on Market share By Geographical Landscape 2024-2029 (%)
- Exhibits71: Chart on Geographic comparison
- Exhibits72: Data Table on Geographic comparison
- Exhibits73: Chart on North America - Market size and forecast 2024-2029 ($ million)
- Exhibits74: Data Table on North America - Market size and forecast 2024-2029 ($ million)
- Exhibits75: Chart on North America - Year-over-year growth 2024-2029 (%)
- Exhibits76: Data Table on North America - Year-over-year growth 2024-2029 (%)
- Exhibits77: Chart on Europe - Market size and forecast 2024-2029 ($ million)
- Exhibits78: Data Table on Europe - Market size and forecast 2024-2029 ($ million)
- Exhibits79: Chart on Europe - Year-over-year growth 2024-2029 (%)
- Exhibits80: Data Table on Europe - Year-over-year growth 2024-2029 (%)
- Exhibits81: Chart on Asia - Market size and forecast 2024-2029 ($ million)
- Exhibits82: Data Table on Asia - Market size and forecast 2024-2029 ($ million)
- Exhibits83: Chart on Asia - Year-over-year growth 2024-2029 (%)
- Exhibits84: Data Table on Asia - Year-over-year growth 2024-2029 (%)
- Exhibits85: Chart on Rest of World (ROW) - Market size and forecast 2024-2029 ($ million)
- Exhibits86: Data Table on Rest of World (ROW) - Market size and forecast 2024-2029 ($ million)
- Exhibits87: Chart on Rest of World (ROW) - Year-over-year growth 2024-2029 (%)
- Exhibits88: Data Table on Rest of World (ROW) - Year-over-year growth 2024-2029 (%)
- Exhibits89: Chart on US - Market size and forecast 2024-2029 ($ million)
- Exhibits90: Data Table on US - Market size and forecast 2024-2029 ($ million)
- Exhibits91: Chart on US - Year-over-year growth 2024-2029 (%)
- Exhibits92: Data Table on US - Year-over-year growth 2024-2029 (%)
- Exhibits93: Chart on UK - Market size and forecast 2024-2029 ($ million)
- Exhibits94: Data Table on UK - Market size and forecast 2024-2029 ($ million)
- Exhibits95: Chart on UK - Year-over-year growth 2024-2029 (%)
- Exhibits96: Data Table on UK - Year-over-year growth 2024-2029 (%)
- Exhibits97: Chart on Canada - Market size and forecast 2024-2029 ($ million)
- Exhibits98: Data Table on Canada - Market size and forecast 2024-2029 ($ million)
- Exhibits99: Chart on Canada - Year-over-year growth 2024-2029 (%)
- Exhibits100: Data Table on Canada - Year-over-year growth 2024-2029 (%)
- Exhibits101: Chart on China - Market size and forecast 2024-2029 ($ million)
- Exhibits102: Data Table on China - Market size and forecast 2024-2029 ($ million)
- Exhibits103: Chart on China - Year-over-year growth 2024-2029 (%)
- Exhibits104: Data Table on China - Year-over-year growth 2024-2029 (%)
- Exhibits105: Chart on India - Market size and forecast 2024-2029 ($ million)
- Exhibits106: Data Table on India - Market size and forecast 2024-2029 ($ million)
- Exhibits107: Chart on India - Year-over-year growth 2024-2029 (%)
- Exhibits108: Data Table on India - Year-over-year growth 2024-2029 (%)
- Exhibits109: Chart on Germany - Market size and forecast 2024-2029 ($ million)
- Exhibits110: Data Table on Germany - Market size and forecast 2024-2029 ($ million)
- Exhibits111: Chart on Germany - Year-over-year growth 2024-2029 (%)
- Exhibits112: Data Table on Germany - Year-over-year growth 2024-2029 (%)
- Exhibits113: Chart on France - Market size and forecast 2024-2029 ($ million)
- Exhibits114: Data Table on France - Market size and forecast 2024-2029 ($ million)
- Exhibits115: Chart on France - Year-over-year growth 2024-2029 (%)
- Exhibits116: Data Table on France - Year-over-year growth 2024-2029 (%)
- Exhibits117: Chart on Japan - Market size and forecast 2024-2029 ($ million)
- Exhibits118: Data Table on Japan - Market size and forecast 2024-2029 ($ million)
- Exhibits119: Chart on Japan - Year-over-year growth 2024-2029 (%)
- Exhibits120: Data Table on Japan - Year-over-year growth 2024-2029 (%)
- Exhibits121: Chart on South Korea - Market size and forecast 2024-2029 ($ million)
- Exhibits122: Data Table on South Korea - Market size and forecast 2024-2029 ($ million)
- Exhibits123: Chart on South Korea - Year-over-year growth 2024-2029 (%)
- Exhibits124: Data Table on South Korea - Year-over-year growth 2024-2029 (%)
- Exhibits125: Chart on Italy - Market size and forecast 2024-2029 ($ million)
- Exhibits126: Data Table on Italy - Market size and forecast 2024-2029 ($ million)
- Exhibits127: Chart on Italy - Year-over-year growth 2024-2029 (%)
- Exhibits128: Data Table on Italy - Year-over-year growth 2024-2029 (%)
- Exhibits129: Market opportunity By Geographical Landscape ($ million)
- Exhibits130: Data Tables on Market opportunity By Geographical Landscape ($ million)
- Exhibits131: Impact of drivers and challenges in 2024 and 2029
- Exhibits132: Overview on criticality of inputs and factors of differentiation
- Exhibits133: Overview on factors of disruption
- Exhibits134: Impact of key risks on business
- Exhibits135: Companies covered
- Exhibits136: Company ranking index
- Exhibits137: Matrix on companies position and classification
- Exhibits138: 3-Point Products - Overview
- Exhibits139: 3-Point Products - Product / Service
- Exhibits140: 3-Point Products - Key offerings
- Exhibits141: SWOT
- Exhibits142: Acumed LLC - Overview
- Exhibits143: Acumed LLC - Product / Service
- Exhibits144: Acumed LLC - Key offerings
- Exhibits145: SWOT
- Exhibits146: Arthrex Inc. - Overview
- Exhibits147: Arthrex Inc. - Product / Service
- Exhibits148: Arthrex Inc. - Key offerings
- Exhibits149: SWOT
- Exhibits150: Aspire Medical Innovation - Overview
- Exhibits151: Aspire Medical Innovation - Product / Service
- Exhibits152: Aspire Medical Innovation - Key offerings
- Exhibits153: SWOT
- Exhibits154: Breg Inc. - Overview
- Exhibits155: Breg Inc. - Product / Service
- Exhibits156: Breg Inc. - Key offerings
- Exhibits157: SWOT
- Exhibits158: Conmed Corp. - Overview
- Exhibits159: Conmed Corp. - Product / Service
- Exhibits160: Conmed Corp. - Key offerings
- Exhibits161: SWOT
- Exhibits162: Exactech Inc. - Overview
- Exhibits163: Exactech Inc. - Product / Service
- Exhibits164: Exactech Inc. - Key offerings
- Exhibits165: SWOT
- Exhibits166: Extremity Medical LLC - Overview
- Exhibits167: Extremity Medical LLC - Product / Service
- Exhibits168: Extremity Medical LLC - Key offerings
- Exhibits169: SWOT
- Exhibits170: In2Bones Corp. - Overview
- Exhibits171: In2Bones Corp. - Product / Service
- Exhibits172: In2Bones Corp. - Key offerings
- Exhibits173: SWOT
- Exhibits174: Johnson and Johnson Inc. - Overview
- Exhibits175: Johnson and Johnson Inc. - Business segments
- Exhibits176: Johnson and Johnson Inc. - Key news
- Exhibits177: Johnson and Johnson Inc. - Key offerings
- Exhibits178: Johnson and Johnson Inc. - Segment focus
- Exhibits179: SWOT
- Exhibits180: Skeletal Dynamics LLC - Overview
- Exhibits181: Skeletal Dynamics LLC - Product / Service
- Exhibits182: Skeletal Dynamics LLC - Key offerings
- Exhibits183: SWOT
- Exhibits184: Smith and Nephew plc - Overview
- Exhibits185: Smith and Nephew plc - Business segments
- Exhibits186: Smith and Nephew plc - Key news
- Exhibits187: Smith and Nephew plc - Key offerings
- Exhibits188: Smith and Nephew plc - Segment focus
- Exhibits189: SWOT
- Exhibits190: Stryker Corp. - Overview
- Exhibits191: Stryker Corp. - Business segments
- Exhibits192: Stryker Corp. - Key news
- Exhibits193: Stryker Corp. - Key offerings
- Exhibits194: Stryker Corp. - Segment focus
- Exhibits195: SWOT
- Exhibits196: Wright Medical Group NV - Overview
- Exhibits197: Wright Medical Group NV - Product / Service
- Exhibits198: Wright Medical Group NV - Key offerings
- Exhibits199: SWOT
- Exhibits200: Zimmer Biomet Holdings Inc. - Overview
- Exhibits201: Zimmer Biomet Holdings Inc. - Business segments
- Exhibits202: Zimmer Biomet Holdings Inc. - Key news
- Exhibits203: Zimmer Biomet Holdings Inc. - Key offerings
- Exhibits204: Zimmer Biomet Holdings Inc. - Segment focus
- Exhibits205: SWOT
- Exhibits206: Inclusions checklist
- Exhibits207: Exclusions checklist
- Exhibits208: Currency conversion rates for US$
- Exhibits209: Research methodology
- Exhibits210: Information sources
- Exhibits211: Data validation
- Exhibits212: Validation techniques employed for market sizing
- Exhibits213: Data synthesis
- Exhibits214: 360 degree market analysis
- Exhibits215: List of abbreviations
The extremity products market is forecasted to grow by $ 2077.8 mn during 2024-2029, accelerating at a CAGR of 9.7% during the forecast period. The report on the extremity products market provides a holistic analysis, market size and forecast, trends, growth drivers, and challenges, as well as vendor analysis covering around 25 vendors.
The report offers an up-to-date analysis regarding the current market scenario, the latest trends and drivers, and the overall market environment. The market is driven by rising prevalence of orthopedic conditions, rising awareness and investment in extremity products, and growing geriatric population.
| Market Scope | |
|---|---|
| Base Year | 2025 |
| End Year | 2029 |
| Series Year | 2025-2029 |
| Growth Momentum | Accelerate |
| YOY 2025 | 8.6% |
| CAGR | 9.7% |
| Incremental Value | $2077.8 mn |
Technavio's extremity products market is segmented as below:
By Type
- Upper extremities
- Lower extremities
By End-user
- Hospitals
- Clinics
- ASCs
By Geographical Landscape
- North America
- Europe
- Asia
- Rest of World (ROW)
This study identifies the growing number of orthopedic conferences as one of the prime reasons driving the extremity products market growth during the next few years. Also, increasing mergers and acquisitions activities and increasing digital engagement will lead to sizable demand in the market.
The report on the extremity products market covers the following areas:
- Extremity Products Market sizing
- Extremity Products Market forecast
- Extremity Products Market industry analysis
The robust vendor analysis is designed to help clients improve their market position, and in line with this, this report provides a detailed analysis of several leading extremity products market vendors that include 3-Point Products, Acumed LLC, Arthrex Inc., Artificial Limbs Manufacturing Corp. of India, Aspire Medical Innovation, Bone Foam Inc., Breg Inc., Conmed Corp., Exactech Inc., Extremity Medical LLC, In2Bones Corp., Johnson and Johnson Inc., Owens and Minor Inc., Skeletal Dynamics LLC, Smith and Nephew plc, Stryker Corp., TriMed Inc., Waldemar Link GmbH and Co. KG, Wright Medical Group NV, and Zimmer Biomet Holdings Inc.. Also, the extremity products market analysis report includes information on upcoming trends and challenges that will influence market growth. This is to help companies strategize and leverage all forthcoming growth opportunities.
The study was conducted using an objective combination of primary and secondary information including inputs from key participants in the industry. The report contains a comprehensive market and vendor landscape in addition to an analysis of the key vendors.
The publisher presents a detailed picture of the market by the way of study, synthesis, and summation of data from multiple sources by an analysis of key parameters such as profit, pricing, competition, and promotions. It presents various market facets by identifying the key industry influencers. The data presented is comprehensive, reliable, and a result of extensive primary and secondary research. The market research reports provide a complete competitive landscape and an in-depth vendor selection methodology and analysis using qualitative and quantitative research to forecast accurate market growth.
Table of Contents
1 Executive Summary
- 1.1 Market overview
- Executive Summary - Chart on Market Overview
- Executive Summary - Data Table on Market Overview
- Executive Summary - Chart on Global Market Characteristics
- Executive Summary - Chart on Market By Geographical Landscape
- Executive Summary - Chart on Market Segmentation by Type
- Executive Summary - Chart on Market Segmentation by End-user
- Executive Summary - Chart on Incremental Growth
- Executive Summary - Data Table on Incremental Growth
- Executive Summary - Chart on Company Market Positioning
2 Technavio Analysis
- 2.1 Analysis of price sensitivity, lifecycle, customer purchase basket, adoption rates, and purchase criteria
- Analysis of price sensitivity, lifecycle, customer purchase basket, adoption rates, and purchase criteria
- 2.2 Criticality of inputs and Factors of differentiation
- Overview on criticality of inputs and factors of differentiation
- 2.3 Factors of disruption
- Overview on factors of disruption
- 2.4 Impact of drivers and challenges
- Impact of drivers and challenges in 2024 and 2029
3 Market Landscape
- 3.1 Market ecosystem
- Parent Market
- Data Table on - Parent Market
- 3.2 Market characteristics
- Market characteristics analysis
- 3.3 Value chain analysis
- Value chain analysis
4 Market Sizing
- 4.1 Market definition
- Offerings of companies included in the market definition
- 4.2 Market segment analysis
- Market segments
- 4.3 Market size 2024
- 4.4 Market outlook: Forecast for 2024-2029
- Chart on Global - Market size and forecast 2024-2029 ($ million)
- Data Table on Global - Market size and forecast 2024-2029 ($ million)
- Chart on Global Market: Year-over-year growth 2024-2029 (%)
- Data Table on Global Market: Year-over-year growth 2024-2029 (%)
5 Historic Market Size
- 5.1 Global Extremity Products Market 2019 - 2023
- Historic Market Size - Data Table on Global Extremity Products Market 2019 - 2023 ($ million)
- 5.2 Type segment analysis 2019 - 2023
- Historic Market Size - Type Segment 2019 - 2023 ($ million)
- 5.3 End-user segment analysis 2019 - 2023
- Historic Market Size - End-user Segment 2019 - 2023 ($ million)
- 5.4 Geography segment analysis 2019 - 2023
- Historic Market Size - Geography Segment 2019 - 2023 ($ million)
- 5.5 Country segment analysis 2019 - 2023
- Historic Market Size - Country Segment 2019 - 2023 ($ million)
6 Qualitative Analysis
- 6.1 The AI impact on Global Extremity Products Market
7 Five Forces Analysis
- 7.1 Five forces summary
- Five forces analysis - Comparison between 2024 and 2029
- 7.2 Bargaining power of buyers
- Bargaining power of buyers - Impact of key factors 2024 and 2029
- 7.3 Bargaining power of suppliers
- Bargaining power of suppliers - Impact of key factors in 2024 and 2029
- 7.4 Threat of new entrants
- Threat of new entrants - Impact of key factors in 2024 and 2029
- 7.5 Threat of substitutes
- Threat of substitutes - Impact of key factors in 2024 and 2029
- 7.6 Threat of rivalry
- Threat of rivalry - Impact of key factors in 2024 and 2029
- 7.7 Market condition
- Chart on Market condition - Five forces 2024 and 2029
8 Market Segmentation by Type
- 8.1 Market segments
- Chart on Type - Market share 2024-2029 (%)
- Data Table on Type - Market share 2024-2029 (%)
- 8.2 Comparison by Type
- Chart on Comparison by Type
- Data Table on Comparison by Type
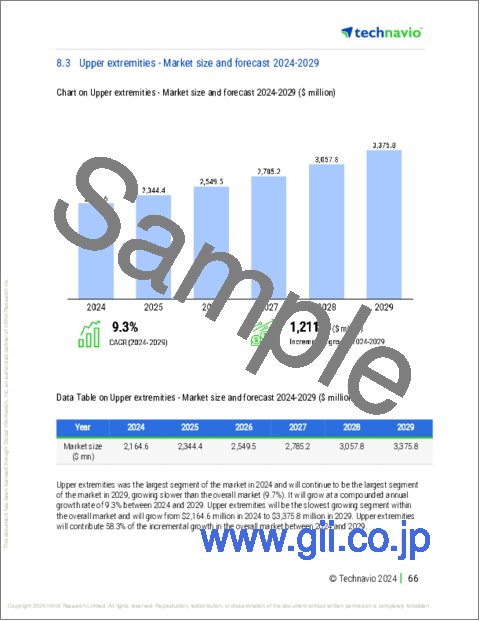
- 8.3 Upper extremities - Market size and forecast 2024-2029
- Chart on Upper extremities - Market size and forecast 2024-2029 ($ million)
- Data Table on Upper extremities - Market size and forecast 2024-2029 ($ million)
- Chart on Upper extremities - Year-over-year growth 2024-2029 (%)
- Data Table on Upper extremities - Year-over-year growth 2024-2029 (%)
- 8.4 Lower extremities - Market size and forecast 2024-2029
- Chart on Lower extremities - Market size and forecast 2024-2029 ($ million)
- Data Table on Lower extremities - Market size and forecast 2024-2029 ($ million)
- Chart on Lower extremities - Year-over-year growth 2024-2029 (%)
- Data Table on Lower extremities - Year-over-year growth 2024-2029 (%)
- 8.5 Market opportunity by Type
- Market opportunity by Type ($ million)
- Data Table on Market opportunity by Type ($ million)
9 Market Segmentation by End-user
- 9.1 Market segments
- Chart on End-user - Market share 2024-2029 (%)
- Data Table on End-user - Market share 2024-2029 (%)
- 9.2 Comparison by End-user
- Chart on Comparison by End-user
- Data Table on Comparison by End-user
- 9.3 Hospitals - Market size and forecast 2024-2029
- Chart on Hospitals - Market size and forecast 2024-2029 ($ million)
- Data Table on Hospitals - Market size and forecast 2024-2029 ($ million)
- Chart on Hospitals - Year-over-year growth 2024-2029 (%)
- Data Table on Hospitals - Year-over-year growth 2024-2029 (%)
- 9.4 Clinics - Market size and forecast 2024-2029
- Chart on Clinics - Market size and forecast 2024-2029 ($ million)
- Data Table on Clinics - Market size and forecast 2024-2029 ($ million)
- Chart on Clinics - Year-over-year growth 2024-2029 (%)
- Data Table on Clinics - Year-over-year growth 2024-2029 (%)
- 9.5 ASCs - Market size and forecast 2024-2029
- Chart on ASCs - Market size and forecast 2024-2029 ($ million)
- Data Table on ASCs - Market size and forecast 2024-2029 ($ million)
- Chart on ASCs - Year-over-year growth 2024-2029 (%)
- Data Table on ASCs - Year-over-year growth 2024-2029 (%)
- 9.6 Market opportunity by End-user
- Market opportunity by End-user ($ million)
- Data Table on Market opportunity by End-user ($ million)
10 Customer Landscape
- 10.1 Customer landscape overview
- Analysis of price sensitivity, lifecycle, customer purchase basket, adoption rates, and purchase criteria
11 Geographic Landscape
- 11.1 Geographic segmentation
- Chart on Market share By Geographical Landscape 2024-2029 (%)
- Data Table on Market share By Geographical Landscape 2024-2029 (%)
- 11.2 Geographic comparison
- Chart on Geographic comparison
- Data Table on Geographic comparison
- 11.3 North America - Market size and forecast 2024-2029
- Chart on North America - Market size and forecast 2024-2029 ($ million)
- Data Table on North America - Market size and forecast 2024-2029 ($ million)
- Chart on North America - Year-over-year growth 2024-2029 (%)
- Data Table on North America - Year-over-year growth 2024-2029 (%)
- 11.4 Europe - Market size and forecast 2024-2029
- Chart on Europe - Market size and forecast 2024-2029 ($ million)
- Data Table on Europe - Market size and forecast 2024-2029 ($ million)
- Chart on Europe - Year-over-year growth 2024-2029 (%)
- Data Table on Europe - Year-over-year growth 2024-2029 (%)
- 11.5 Asia - Market size and forecast 2024-2029
- Chart on Asia - Market size and forecast 2024-2029 ($ million)
- Data Table on Asia - Market size and forecast 2024-2029 ($ million)
- Chart on Asia - Year-over-year growth 2024-2029 (%)
- Data Table on Asia - Year-over-year growth 2024-2029 (%)
- 11.6 Rest of World (ROW) - Market size and forecast 2024-2029
- Chart on Rest of World (ROW) - Market size and forecast 2024-2029 ($ million)
- Data Table on Rest of World (ROW) - Market size and forecast 2024-2029 ($ million)
- Chart on Rest of World (ROW) - Year-over-year growth 2024-2029 (%)
- Data Table on Rest of World (ROW) - Year-over-year growth 2024-2029 (%)
- 11.7 US - Market size and forecast 2024-2029
- Chart on US - Market size and forecast 2024-2029 ($ million)
- Data Table on US - Market size and forecast 2024-2029 ($ million)
- Chart on US - Year-over-year growth 2024-2029 (%)
- Data Table on US - Year-over-year growth 2024-2029 (%)
- 11.8 UK - Market size and forecast 2024-2029
- Chart on UK - Market size and forecast 2024-2029 ($ million)
- Data Table on UK - Market size and forecast 2024-2029 ($ million)
- Chart on UK - Year-over-year growth 2024-2029 (%)
- Data Table on UK - Year-over-year growth 2024-2029 (%)
- 11.9 Canada - Market size and forecast 2024-2029
- Chart on Canada - Market size and forecast 2024-2029 ($ million)
- Data Table on Canada - Market size and forecast 2024-2029 ($ million)
- Chart on Canada - Year-over-year growth 2024-2029 (%)
- Data Table on Canada - Year-over-year growth 2024-2029 (%)
- 11.10 China - Market size and forecast 2024-2029
- Chart on China - Market size and forecast 2024-2029 ($ million)
- Data Table on China - Market size and forecast 2024-2029 ($ million)
- Chart on China - Year-over-year growth 2024-2029 (%)
- Data Table on China - Year-over-year growth 2024-2029 (%)
- 11.11 India - Market size and forecast 2024-2029
- Chart on India - Market size and forecast 2024-2029 ($ million)
- Data Table on India - Market size and forecast 2024-2029 ($ million)
- Chart on India - Year-over-year growth 2024-2029 (%)
- Data Table on India - Year-over-year growth 2024-2029 (%)
- 11.12 Germany - Market size and forecast 2024-2029
- Chart on Germany - Market size and forecast 2024-2029 ($ million)
- Data Table on Germany - Market size and forecast 2024-2029 ($ million)
- Chart on Germany - Year-over-year growth 2024-2029 (%)
- Data Table on Germany - Year-over-year growth 2024-2029 (%)
- 11.13 France - Market size and forecast 2024-2029
- Chart on France - Market size and forecast 2024-2029 ($ million)
- Data Table on France - Market size and forecast 2024-2029 ($ million)
- Chart on France - Year-over-year growth 2024-2029 (%)
- Data Table on France - Year-over-year growth 2024-2029 (%)
- 11.14 Japan - Market size and forecast 2024-2029
- Chart on Japan - Market size and forecast 2024-2029 ($ million)
- Data Table on Japan - Market size and forecast 2024-2029 ($ million)
- Chart on Japan - Year-over-year growth 2024-2029 (%)
- Data Table on Japan - Year-over-year growth 2024-2029 (%)
- 11.15 South Korea - Market size and forecast 2024-2029
- Chart on South Korea - Market size and forecast 2024-2029 ($ million)
- Data Table on South Korea - Market size and forecast 2024-2029 ($ million)
- Chart on South Korea - Year-over-year growth 2024-2029 (%)
- Data Table on South Korea - Year-over-year growth 2024-2029 (%)
- 11.16 Italy - Market size and forecast 2024-2029
- Chart on Italy - Market size and forecast 2024-2029 ($ million)
- Data Table on Italy - Market size and forecast 2024-2029 ($ million)
- Chart on Italy - Year-over-year growth 2024-2029 (%)
- Data Table on Italy - Year-over-year growth 2024-2029 (%)
- 11.17 Market opportunity By Geographical Landscape
- Market opportunity By Geographical Landscape ($ million)
- Data Tables on Market opportunity By Geographical Landscape ($ million)
12 Drivers, Challenges, and Opportunity/Restraints
- 12.1 Market drivers
- 12.2 Market challenges
- 12.3 Impact of drivers and challenges
- Impact of drivers and challenges in 2024 and 2029
- 12.4 Market opportunities/restraints
13 Competitive Landscape
- 13.1 Overview
- 13.2 Competitive Landscape
- Overview on criticality of inputs and factors of differentiation
- 13.3 Landscape disruption
- Overview on factors of disruption
- 13.4 Industry risks
- Impact of key risks on business
14 Competitive Analysis
- 14.1 Companies profiled
- Companies covered
- 14.2 Company ranking index
- Company ranking index
- 14.3 Market positioning of companies
- Matrix on companies position and classification
- 3-Point Products
- 3-Point Products - Overview
- 3-Point Products - Product / Service
- 3-Point Products - Key offerings
- SWOT
- 14.5 Acumed LLC
- Acumed LLC - Overview
- Acumed LLC - Product / Service
- Acumed LLC - Key offerings
- SWOT
- 14.6 Arthrex Inc.
- Arthrex Inc. - Overview
- Arthrex Inc. - Product / Service
- Arthrex Inc. - Key offerings
- SWOT
- 14.7 Aspire Medical Innovation
- Aspire Medical Innovation - Overview
- Aspire Medical Innovation - Product / Service
- Aspire Medical Innovation - Key offerings
- SWOT
- 14.8 Breg Inc.
- Breg Inc. - Overview
- Breg Inc. - Product / Service
- Breg Inc. - Key offerings
- SWOT
- 14.9 Conmed Corp.
- Conmed Corp. - Overview
- Conmed Corp. - Product / Service
- Conmed Corp. - Key offerings
- SWOT
- 14.10 Exactech Inc.
- Exactech Inc. - Overview
- Exactech Inc. - Product / Service
- Exactech Inc. - Key offerings
- SWOT
- 14.11 Extremity Medical LLC
- Extremity Medical LLC - Overview
- Extremity Medical LLC - Product / Service
- Extremity Medical LLC - Key offerings
- SWOT
- 14.12 In2Bones Corp.
- In2Bones Corp. - Overview
- In2Bones Corp. - Product / Service
- In2Bones Corp. - Key offerings
- SWOT
- 14.13 Johnson and Johnson Inc.
- Johnson and Johnson Inc. - Overview
- Johnson and Johnson Inc. - Business segments
- Johnson and Johnson Inc. - Key news
- Johnson and Johnson Inc. - Key offerings
- Johnson and Johnson Inc. - Segment focus
- SWOT
- 14.14 Skeletal Dynamics LLC
- Skeletal Dynamics LLC - Overview
- Skeletal Dynamics LLC - Product / Service
- Skeletal Dynamics LLC - Key offerings
- SWOT
- 14.15 Smith and Nephew plc
- Smith and Nephew plc - Overview
- Smith and Nephew plc - Business segments
- Smith and Nephew plc - Key news
- Smith and Nephew plc - Key offerings
- Smith and Nephew plc - Segment focus
- SWOT
- 14.16 Stryker Corp.
- Stryker Corp. - Overview
- Stryker Corp. - Business segments
- Stryker Corp. - Key news
- Stryker Corp. - Key offerings
- Stryker Corp. - Segment focus
- SWOT
- 14.17 Wright Medical Group NV
- Wright Medical Group NV - Overview
- Wright Medical Group NV - Product / Service
- Wright Medical Group NV - Key offerings
- SWOT
- 14.18 Zimmer Biomet Holdings Inc.
- Zimmer Biomet Holdings Inc. - Overview
- Zimmer Biomet Holdings Inc. - Business segments
- Zimmer Biomet Holdings Inc. - Key news
- Zimmer Biomet Holdings Inc. - Key offerings
- Zimmer Biomet Holdings Inc. - Segment focus
- SWOT
15 Appendix
- 15.1 Scope of the report
- 15.2 Inclusions and exclusions checklist
- Inclusions checklist
- Exclusions checklist
- 15.3 Currency conversion rates for US$
- Currency conversion rates for US$
- 15.4 Research methodology
- Research methodology
- 15.5 Data procurement
- Information sources
- 15.6 Data validation
- Data validation
- 15.7 Validation techniques employed for market sizing
- Validation techniques employed for market sizing
- 15.8 Data synthesis
- Data synthesis
- 15.9 360 degree market analysis
- 360 degree market analysis
- 15.10 List of abbreviations
- List of abbreviations

