|
|
市場調査レポート
商品コード
1908330
粉塵抑制システムの世界市場、2026年~2030年Global Dust Suppression Systems Market 2026-2030 |
||||||
|
|||||||
カスタマイズ可能
|
|||||||

| 粉塵抑制システムの世界市場、2026年~2030年 |
|
出版日: 2026年01月14日
発行: TechNavio
ページ情報: 英文 293 Pages
納期: 即納可能
|

概要
世界の粉塵抑制システム市場は、2025年から2030年の間に54億980万米ドルの成長が見込まれ、予測期間中のCAGRは5.7%と予測されています。
本報告書では、世界の粉塵抑制システム市場に関する包括的な分析、市場規模と予測、動向、成長要因、課題に加え、約25社のベンダー分析を提供しています。
本レポートは、現在の市場状況、最新の動向と促進要因、市場環境全般に関する最新の分析を提供します。市場の成長は、鉱業および鉱物加工活動の拡大、新興経済国におけるインフラ開発の急増、先進的な湿式抑制技術の採用増加によって牽引されています。
本調査は、業界の主要関係者からの情報をはじめとする一次情報と二次情報を客観的に組み合わせて実施されました。本レポートには、主要企業の分析に加え、包括的な市場規模データ、地域別分析を伴うセグメント、ベンダー情勢が含まれています。レポートには過去データと予測データが掲載されています。
| 市場範囲 | |
|---|---|
| 基準年 | 2026年 |
| 終了年 | 2030年 |
| 予測期間 | 2026年~2030年 |
| 成長モメンタム | 加速 |
| 前年比2026年 | 5.4% |
| CAGR | 5.7% |
| 増分額 | 54億980万米ドル |
本調査では、今後数年間における世界の粉塵抑制システム市場の成長を牽引する主な要因の一つとして、持続可能なソリューションへの移行が挙げられます。また、遠隔監視と自動化の進展、および労働安全衛生への注目の高まりが、市場において相当な需要を生み出すものと見込まれます。
目次
第1章 エグゼクティブサマリー
第2章 Technavio分析
- 価格反応性・ライフサイクル・顧客購入バスケット・採用率・購入基準の分析
- インプットの重要性と差別化の要因
- 混乱の要因
- 促進要因と課題の影響
第3章 市場情勢
- 市場エコシステム
- 市場の特徴
- バリューチェーン分析
第4章 市場規模
- 市場の定義
- 市場セグメント分析
- 市場規模、2025年
- 市場の見通し、2025年~2030年
第5章 市場規模実績
- 世界の粉塵抑制システム市場、2020年~2024年
- 製品セグメント分析、2020年~2024年
- エンドユーザーセグメント分析、2020年~2024年
- モビリティタイプセグメント分析、2020年~2024年
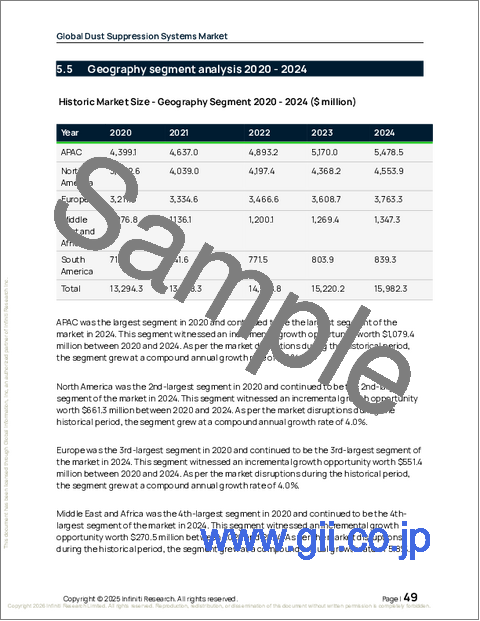
- 地域別セグメント分析、2020年~2024年
- 国別セグメント分析、2020年~2024年
第6章 定性分析
- AIの影響:世界の粉塵抑制システム市場
第7章 ファイブフォース分析
- ファイブフォースの要約
- 買い手の交渉力
- 供給企業の交渉力
- 新規参入業者の脅威
- 代替品の脅威
- 競争の脅威
- 市況
第8章 市場セグメンテーション:製品別
- 比較:製品別
- 湿式システム
- 乾式システム
- 市場機会:製品別
第9章 市場セグメンテーション:エンドユーザー別
- 比較:エンドユーザー別
- 建設
- 鉱業
- エネルギー
- 化学
- その他
- 市場機会:エンドユーザー別
第10章 市場セグメンテーション:モビリティタイプ別
- 比較:モビリティタイプ別
- 据置型
- ポータブル
- 市場機会:モビリティタイプ別
第11章 顧客情勢
第12章 地域別情勢
- 地域別セグメンテーション
- 地域別比較
- アジア太平洋地域
- 中国
- 日本
- インド
- 韓国
- オーストラリア
- インドネシア
- 北米
- 米国
- カナダ
- メキシコ
- 欧州
- ドイツ
- イギリス
- フランス
- イタリア
- スペイン
- オランダ
- 中東・アフリカ
- 南アフリカ
- サウジアラビア
- UAE
- トルコ
- イスラエル
- 南米
- ブラジル
- アルゼンチン
- チリ
- 市場機会:地域別
第13章 促進要因、課題、機会
- 市場促進要因
- 市場の課題
- 促進要因と課題の影響
- 市場機会
第14章 競合情勢
- 概要
- 競合情勢
- 混乱の状況
- 業界のリスク
第15章 競合分析
- 企業プロファイル
- 企業ランキング指標
- 企業の市場ポジショニング
- BASF SE
- Beltran Technologies Inc.
- Camfil AB
- Company Wrench Ltd.
- Donaldson Co. Inc.
- DSH Systems Ltd.
- Dust Control Technologies Inc.
- Duztech AB
- EmiControls GmbH
- Nederman Holding AB
- Parker Hannifin Corp.
- Quaker Houghton
- Savic Group
- Sly Inc.
- Spraying Systems Co.

