|
|
市場調査レポート
商品コード
1557405
可視光通信の世界市場 2024年~2028年Global Visible Light Communication Market 2024-2028 |
||||||

|
|||||||
カスタマイズ可能
|
|||||||

| 可視光通信の世界市場 2024年~2028年 |
|
出版日: 2024年08月14日
発行: TechNavio
ページ情報: 英文 186 Pages
納期: 即納可能
|

全表示
- 概要
- 図表
- 目次
可視光通信市場は2023年~2028年年に3,160億1,770万米ドル、予測期間中のCAGRは89.62%で成長すると予測されます。
当レポートでは、可視光通信市場の全体的な分析、市場規模・予測、動向、成長促進要因、課題、約25のベンダーを網羅したベンダー分析などを掲載しています。
現在の市場シナリオ、最新動向と促進要因、市場環境全体に関する最新分析を提供しています。市場は、産業におけるプロセス自動化の浸透、データ転送の高速化と安全性、より広い帯域幅の利用可能性によって牽引されています。
| 市場範囲 | |
|---|---|
| 基準年 | 2024年 |
| 終了年 | 2028年 |
| 予測期間 | 2024年~2028年 |
| 成長モメンタム | 加速 |
| 前年比2024年 | 82.31% |
| CAGR | 89.62% |
| 増分額 | 3,160億1,770万米ドル |
本調査では、今後数年間の可視光通信市場成長を牽引する主要因の1つとして、VLCベースの5Gネットワークを挙げています。また、LEDの採用やエンドユーザー向けアプリケーションの増加は、市場の大きな需要につながります。
目次
第1章 エグゼクティブサマリー
- 市場概要
第2章 市場情勢
- 市場エコシステム
- 市場の特徴
- バリューチェーン分析
第3章 市場規模の評価
- 市場の定義
- 市場セグメント分析
- 市場規模 2023年
- 市場の見通し 2023年~2028年
第4章 市場規模実績
- 可視光通信の世界市場 2018年~2022年
- 用途別セグメント分析 2018年~2022年
- エンドユーザーセグメント分析 2018年~2022年
- 地域別セグメント分析 2018年~2022年
- 国別セグメント分析 2018年~2022年
第5章 ファイブフォース分析
- ファイブフォースの要約
- 買い手の交渉力
- 供給企業の交渉力
- 新規参入業者の脅威
- 代替品の脅威
- 競争の脅威
- 市況
第6章 市場セグメンテーション:用途別
- 市場セグメンテーション
- 比較:用途別
- 屋内ネットワーク:市場規模と予測 2023年~2028年
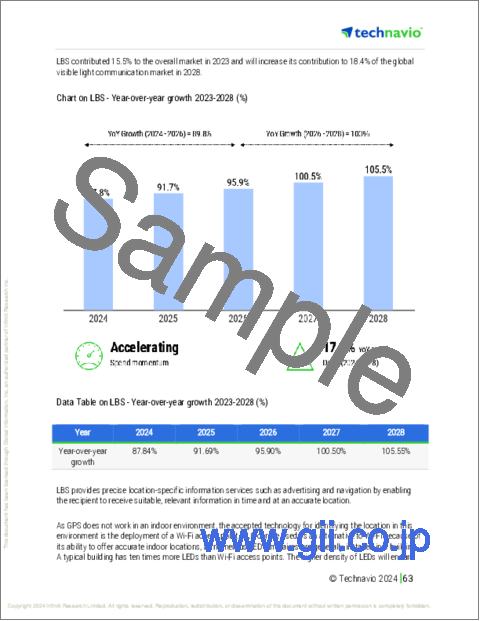
- LBS:市場規模と予測 2023年~2028年
- ICE:市場規模と予測 2023年~2028年
- 水中通信:市場規模と予測 2023年~2028年
- 市場機会:用途別
第7章 市場セグメンテーション:エンドユーザー別
- 市場セグメンテーション
- 比較:エンドユーザー別
- 小売り:市場規模と予測 2023年~2028年
- 家電:市場規模と予測 2023年~2028年
- 自動車および輸送:市場規模と予測 2023年~2028年
- ヘルスケア:市場規模と予測 2023年~2028年
- その他:市場規模と予測 2023年~2028年
- 市場機会:エンドユーザー別
第8章 顧客情勢
- 顧客情勢の概要
第9章 地域別情勢
- 地域別セグメンテーション
- 地域別比較
- 北米:市場規模と予測 2023年~2028年
- アジア太平洋:市場規模と予測 2023年~2028年
- 欧州:市場規模と予測 2023年~2028年
- 南米:市場規模と予測 2023年~2028年
- 中東・アフリカ:市場規模と予測 2023年~2028年
- 米国:市場規模と予測 2023年~2028年
- 中国:市場規模と予測 2023年~2028年
- 日本:市場規模と予測 2023年~2028年
- ドイツ:市場規模と予測 2023年~2028年
- 英国:市場規模と予測 2023年~2028年
- 市場機会:地域情勢別
第10章 促進要因・課題・機会・抑制要因
- 市場促進要因
- 市場の課題
- 促進要因と課題の影響
- 市場の機会・抑制要因
第11章 競合情勢
- 概要
- 競合情勢
- 混乱の状況
- 業界のリスク
第12章 競合分析
- 企業プロファイル
- 企業の市場ポジショニング
- Firefly Networks Ltd.
- Fortive Corp.
- Fraunhofer Society
- fSONA Systems Corp.
- General Electric Co.
- Koninklijke Philips NV
- Lucibel SA
- Oledcomm
- Panasonic Holdings Corp.
- pureLiFi Ltd.
- Qualcomm Inc.
- Renesas Electronics Corp.
- Signify NV
- Viavi Solutions Inc.
- VLNComm Inc.
第13章 付録
Exhibits:
- Exhibits1: Executive Summary - Chart on Market Overview
- Exhibits2: Executive Summary - Data Table on Market Overview
- Exhibits3: Executive Summary - Chart on Global Market Characteristics
- Exhibits4: Executive Summary - Chart on Market By Geographical Landscape
- Exhibits5: Executive Summary - Chart on Market Segmentation by Application
- Exhibits6: Executive Summary - Chart on Market Segmentation by End-user
- Exhibits7: Executive Summary - Chart on Incremental Growth
- Exhibits8: Executive Summary - Data Table on Incremental Growth
- Exhibits9: Executive Summary - Chart on Company Market Positioning
- Exhibits10: Parent Market
- Exhibits11: Data Table on - Parent Market
- Exhibits12: Market characteristics analysis
- Exhibits13: Value Chain Analysis
- Exhibits14: Offerings of companies included in the market definition
- Exhibits15: Market segments
- Exhibits16: Chart on Global - Market size and forecast 2023-2028 ($ million)
- Exhibits17: Data Table on Global - Market size and forecast 2023-2028 ($ million)
- Exhibits18: Chart on Global Market: Year-over-year growth 2023-2028 (%)
- Exhibits19: Data Table on Global Market: Year-over-year growth 2023-2028 (%)
- Exhibits20: Historic Market Size - Data Table on Global Visible Light Communication Market 2018 - 2022 ($ million)
- Exhibits21: Historic Market Size - Application Segment 2018 - 2022 ($ million)
- Exhibits22: Historic Market Size - End-user Segment 2018 - 2022 ($ million)
- Exhibits23: Historic Market Size - Geography Segment 2018 - 2022 ($ million)
- Exhibits24: Historic Market Size - Country Segment 2018 - 2022 ($ million)
- Exhibits25: Five forces analysis - Comparison between 2023 and 2028
- Exhibits26: Bargaining power of buyers - Impact of key factors 2023 and 2028
- Exhibits27: Bargaining power of suppliers - Impact of key factors in 2023 and 2028
- Exhibits28: Threat of new entrants - Impact of key factors in 2023 and 2028
- Exhibits29: Threat of substitutes - Impact of key factors in 2023 and 2028
- Exhibits30: Threat of rivalry - Impact of key factors in 2023 and 2028
- Exhibits31: Chart on Market condition - Five forces 2023 and 2028
- Exhibits32: Chart on Application - Market share 2023-2028 (%)
- Exhibits33: Data Table on Application - Market share 2023-2028 (%)
- Exhibits34: Chart on Comparison by Application
- Exhibits35: Data Table on Comparison by Application
- Exhibits36: Chart on Indoor networking - Market size and forecast 2023-2028 ($ million)
- Exhibits37: Data Table on Indoor networking - Market size and forecast 2023-2028 ($ million)
- Exhibits38: Chart on Indoor networking - Year-over-year growth 2023-2028 (%)
- Exhibits39: Data Table on Indoor networking - Year-over-year growth 2023-2028 (%)
- Exhibits40: Chart on LBS - Market size and forecast 2023-2028 ($ million)
- Exhibits41: Data Table on LBS - Market size and forecast 2023-2028 ($ million)
- Exhibits42: Chart on LBS - Year-over-year growth 2023-2028 (%)
- Exhibits43: Data Table on LBS - Year-over-year growth 2023-2028 (%)
- Exhibits44: Chart on ICE - Market size and forecast 2023-2028 ($ million)
- Exhibits45: Data Table on ICE - Market size and forecast 2023-2028 ($ million)
- Exhibits46: Chart on ICE - Year-over-year growth 2023-2028 (%)
- Exhibits47: Data Table on ICE - Year-over-year growth 2023-2028 (%)
- Exhibits48: Chart on Underwater communication - Market size and forecast 2023-2028 ($ million)
- Exhibits49: Data Table on Underwater communication - Market size and forecast 2023-2028 ($ million)
- Exhibits50: Chart on Underwater communication - Year-over-year growth 2023-2028 (%)
- Exhibits51: Data Table on Underwater communication - Year-over-year growth 2023-2028 (%)
- Exhibits52: Market opportunity by Application ($ million)
- Exhibits53: Data Table on Market opportunity by Application ($ million)
- Exhibits54: Chart on End-user - Market share 2023-2028 (%)
- Exhibits55: Data Table on End-user - Market share 2023-2028 (%)
- Exhibits56: Chart on Comparison by End-user
- Exhibits57: Data Table on Comparison by End-user
- Exhibits58: Chart on Retail - Market size and forecast 2023-2028 ($ million)
- Exhibits59: Data Table on Retail - Market size and forecast 2023-2028 ($ million)
- Exhibits60: Chart on Retail - Year-over-year growth 2023-2028 (%)
- Exhibits61: Data Table on Retail - Year-over-year growth 2023-2028 (%)
- Exhibits62: Chart on Consumer electronics - Market size and forecast 2023-2028 ($ million)
- Exhibits63: Data Table on Consumer electronics - Market size and forecast 2023-2028 ($ million)
- Exhibits64: Chart on Consumer electronics - Year-over-year growth 2023-2028 (%)
- Exhibits65: Data Table on Consumer electronics - Year-over-year growth 2023-2028 (%)
- Exhibits66: Chart on Automotive and transportation - Market size and forecast 2023-2028 ($ million)
- Exhibits67: Data Table on Automotive and transportation - Market size and forecast 2023-2028 ($ million)
- Exhibits68: Chart on Automotive and transportation - Year-over-year growth 2023-2028 (%)
- Exhibits69: Data Table on Automotive and transportation - Year-over-year growth 2023-2028 (%)
- Exhibits70: Chart on Healthcare - Market size and forecast 2023-2028 ($ million)
- Exhibits71: Data Table on Healthcare - Market size and forecast 2023-2028 ($ million)
- Exhibits72: Chart on Healthcare - Year-over-year growth 2023-2028 (%)
- Exhibits73: Data Table on Healthcare - Year-over-year growth 2023-2028 (%)
- Exhibits74: Chart on Others - Market size and forecast 2023-2028 ($ million)
- Exhibits75: Data Table on Others - Market size and forecast 2023-2028 ($ million)
- Exhibits76: Chart on Others - Year-over-year growth 2023-2028 (%)
- Exhibits77: Data Table on Others - Year-over-year growth 2023-2028 (%)
- Exhibits78: Market opportunity by End-user ($ million)
- Exhibits79: Data Table on Market opportunity by End-user ($ million)
- Exhibits80: Analysis of price sensitivity, lifecycle, customer purchase basket, adoption rates, and purchase criteria
- Exhibits81: Chart on Market share By Geographical Landscape 2023-2028 (%)
- Exhibits82: Data Table on Market share By Geographical Landscape 2023-2028 (%)
- Exhibits83: Chart on Geographic comparison
- Exhibits84: Data Table on Geographic comparison
- Exhibits85: Chart on North America - Market size and forecast 2023-2028 ($ million)
- Exhibits86: Data Table on North America - Market size and forecast 2023-2028 ($ million)
- Exhibits87: Chart on North America - Year-over-year growth 2023-2028 (%)
- Exhibits88: Data Table on North America - Year-over-year growth 2023-2028 (%)
- Exhibits89: Chart on APAC - Market size and forecast 2023-2028 ($ million)
- Exhibits90: Data Table on APAC - Market size and forecast 2023-2028 ($ million)
- Exhibits91: Chart on APAC - Year-over-year growth 2023-2028 (%)
- Exhibits92: Data Table on APAC - Year-over-year growth 2023-2028 (%)
- Exhibits93: Chart on Europe - Market size and forecast 2023-2028 ($ million)
- Exhibits94: Data Table on Europe - Market size and forecast 2023-2028 ($ million)
- Exhibits95: Chart on Europe - Year-over-year growth 2023-2028 (%)
- Exhibits96: Data Table on Europe - Year-over-year growth 2023-2028 (%)
- Exhibits97: Chart on South America - Market size and forecast 2023-2028 ($ million)
- Exhibits98: Data Table on South America - Market size and forecast 2023-2028 ($ million)
- Exhibits99: Chart on South America - Year-over-year growth 2023-2028 (%)
- Exhibits100: Data Table on South America - Year-over-year growth 2023-2028 (%)
- Exhibits101: Chart on Middle East and Africa - Market size and forecast 2023-2028 ($ million)
- Exhibits102: Data Table on Middle East and Africa - Market size and forecast 2023-2028 ($ million)
- Exhibits103: Chart on Middle East and Africa - Year-over-year growth 2023-2028 (%)
- Exhibits104: Data Table on Middle East and Africa - Year-over-year growth 2023-2028 (%)
- Exhibits105: Chart on US - Market size and forecast 2023-2028 ($ million)
- Exhibits106: Data Table on US - Market size and forecast 2023-2028 ($ million)
- Exhibits107: Chart on US - Year-over-year growth 2023-2028 (%)
- Exhibits108: Data Table on US - Year-over-year growth 2023-2028 (%)
- Exhibits109: Chart on China - Market size and forecast 2023-2028 ($ million)
- Exhibits110: Data Table on China - Market size and forecast 2023-2028 ($ million)
- Exhibits111: Chart on China - Year-over-year growth 2023-2028 (%)
- Exhibits112: Data Table on China - Year-over-year growth 2023-2028 (%)
- Exhibits113: Chart on Japan - Market size and forecast 2023-2028 ($ million)
- Exhibits114: Data Table on Japan - Market size and forecast 2023-2028 ($ million)
- Exhibits115: Chart on Japan - Year-over-year growth 2023-2028 (%)
- Exhibits116: Data Table on Japan - Year-over-year growth 2023-2028 (%)
- Exhibits117: Chart on Germany - Market size and forecast 2023-2028 ($ million)
- Exhibits118: Data Table on Germany - Market size and forecast 2023-2028 ($ million)
- Exhibits119: Chart on Germany - Year-over-year growth 2023-2028 (%)
- Exhibits120: Data Table on Germany - Year-over-year growth 2023-2028 (%)
- Exhibits121: Chart on UK - Market size and forecast 2023-2028 ($ million)
- Exhibits122: Data Table on UK - Market size and forecast 2023-2028 ($ million)
- Exhibits123: Chart on UK - Year-over-year growth 2023-2028 (%)
- Exhibits124: Data Table on UK - Year-over-year growth 2023-2028 (%)
- Exhibits125: Market opportunity By Geographical Landscape ($ million)
- Exhibits126: Data Tables on Market opportunity By Geographical Landscape ($ million)
- Exhibits127: Impact of drivers and challenges in 2023 and 2028
- Exhibits128: Overview on criticality of inputs and factors of differentiation
- Exhibits129: Overview on factors of disruption
- Exhibits130: Impact of key risks on business
- Exhibits131: Companies covered
- Exhibits132: Matrix on companies position and classification
- Exhibits133: Firefly Networks Ltd. - Overview
- Exhibits134: Firefly Networks Ltd. - Product / Service
- Exhibits135: Firefly Networks Ltd. - Key offerings
- Exhibits136: Fortive Corp. - Overview
- Exhibits137: Fortive Corp. - Business segments
- Exhibits138: Fortive Corp. - Key news
- Exhibits139: Fortive Corp. - Key offerings
- Exhibits140: Fortive Corp. - Segment focus
- Exhibits141: Fraunhofer Society - Overview
- Exhibits142: Fraunhofer Society - Product / Service
- Exhibits143: Fraunhofer Society - Key offerings
- Exhibits144: fSONA Systems Corp. - Overview
- Exhibits145: fSONA Systems Corp. - Product / Service
- Exhibits146: fSONA Systems Corp. - Key offerings
- Exhibits147: General Electric Co. - Overview
- Exhibits148: General Electric Co. - Business segments
- Exhibits149: General Electric Co. - Key news
- Exhibits150: General Electric Co. - Key offerings
- Exhibits151: General Electric Co. - Segment focus
- Exhibits152: Koninklijke Philips NV - Overview
- Exhibits153: Koninklijke Philips NV - Business segments
- Exhibits154: Koninklijke Philips NV - Key news
- Exhibits155: Koninklijke Philips NV - Key offerings
- Exhibits156: Koninklijke Philips NV - Segment focus
- Exhibits157: Lucibel SA - Overview
- Exhibits158: Lucibel SA - Product / Service
- Exhibits159: Lucibel SA - Key offerings
- Exhibits160: Oledcomm - Overview
- Exhibits161: Oledcomm - Product / Service
- Exhibits162: Oledcomm - Key offerings
- Exhibits163: Panasonic Holdings Corp. - Overview
- Exhibits164: Panasonic Holdings Corp. - Business segments
- Exhibits165: Panasonic Holdings Corp. - Key news
- Exhibits166: Panasonic Holdings Corp. - Key offerings
- Exhibits167: Panasonic Holdings Corp. - Segment focus
- Exhibits168: pureLiFi Ltd. - Overview
- Exhibits169: pureLiFi Ltd. - Product / Service
- Exhibits170: pureLiFi Ltd. - Key offerings
- Exhibits171: Qualcomm Inc. - Overview
- Exhibits172: Qualcomm Inc. - Business segments
- Exhibits173: Qualcomm Inc. - Key news
- Exhibits174: Qualcomm Inc. - Key offerings
- Exhibits175: Qualcomm Inc. - Segment focus
- Exhibits176: Renesas Electronics Corp. - Overview
- Exhibits177: Renesas Electronics Corp. - Business segments
- Exhibits178: Renesas Electronics Corp. - Key news
- Exhibits179: Renesas Electronics Corp. - Key offerings
- Exhibits180: Renesas Electronics Corp. - Segment focus
- Exhibits181: Signify NV - Overview
- Exhibits182: Signify NV - Business segments
- Exhibits183: Signify NV - Key news
- Exhibits184: Signify NV - Key offerings
- Exhibits185: Signify NV - Segment focus
- Exhibits186: Viavi Solutions Inc. - Overview
- Exhibits187: Viavi Solutions Inc. - Business segments
- Exhibits188: Viavi Solutions Inc. - Key news
- Exhibits189: Viavi Solutions Inc. - Key offerings
- Exhibits190: Viavi Solutions Inc. - Segment focus
- Exhibits191: VLNComm Inc. - Overview
- Exhibits192: VLNComm Inc. - Product / Service
- Exhibits193: VLNComm Inc. - Key offerings
- Exhibits194: Inclusions checklist
- Exhibits195: Exclusions checklist
- Exhibits196: Currency conversion rates for US$
- Exhibits197: Research methodology
- Exhibits198: Information sources
- Exhibits199: Data validation
- Exhibits200: Validation techniques employed for market sizing
- Exhibits201: Data synthesis
- Exhibits202: 360 degree market analysis
- Exhibits203: List of abbreviations
The visible light communication market is forecasted to grow by USD 316017.7 mn during 2023-2028, accelerating at a CAGR of 89.62% during the forecast period. The report on the visible light communication market provides a holistic analysis, market size and forecast, trends, growth drivers, and challenges, as well as vendor analysis covering around 25 vendors.
The report offers an up-to-date analysis regarding the current market scenario, the latest trends and drivers, and the overall market environment. The market is driven by growing penetration of process automation in industries, faster and safer data transfer, and availability of greater bandwidth.
Technavio's visible light communication market is segmented as below:
| Market Scope | |
|---|---|
| Base Year | 2024 |
| End Year | 2028 |
| Series Year | 2024-2028 |
| Growth Momentum | Accelerate |
| YOY 2024 | 82.31% |
| CAGR | 89.62% |
| Incremental Value | $316017.7 mn |
By Application
- Indoor networking
- LBS
- ICE
- Underwater communication
By End-user
- Retail
- Consumer electronics
- Automotive and transportation
- Healthcare
- Others
By Geographical Landscape
- North America
- APAC
- Europe
- South America
- Middle East and Africa
This study identifies the vlc-based 5g network as one of the prime reasons driving the visible light communication market growth during the next few years. Also, adoption of leds and increase in end-user applications will lead to sizable demand in the market.
The report on the visible light communication market covers the following areas:
- Visible light communication market sizing
- Visible light communication market forecast
- Visible light communication market industry analysis
The robust vendor analysis is designed to help clients improve their market position, and in line with this, this report provides a detailed analysis of several leading visible light communication market vendors that include Acuity Brands Inc., Firefly Networks Ltd., Fortive Corp., Fraunhofer Gesellschaft, fSONA Systems Corp., General Electric Co., Koninklijke Philips N.V., Latecoere, LightBee SL, Lucibel SA, nextLiFi, Oledcomm, Panasonic Holdings Corp., pureLiFi Ltd., Qualcomm Inc., Renesas Electronics Corp., Signify NV, To Be Srl, Viavi Solutions Inc., and VLNComm Inc.. Also, the visible light communication market analysis report includes information on upcoming trends and challenges that will influence market growth. This is to help companies strategize and leverage all forthcoming growth opportunities.
The study was conducted using an objective combination of primary and secondary information including inputs from key participants in the industry. The report contains a comprehensive market and vendor landscape in addition to an analysis of the key vendors.
The publisher presents a detailed picture of the market by the way of study, synthesis, and summation of data from multiple sources by an analysis of key parameters such as profit, pricing, competition, and promotions. It presents various market facets by identifying the key industry influencers. The data presented is comprehensive, reliable, and a result of extensive research - both primary and secondary. The market research reports provide a complete competitive landscape and an in-depth vendor selection methodology and analysis using qualitative and quantitative research to forecast the accurate market growth.
Table of Contents
1 Executive Summary
- 1.1 Market overview
- Executive Summary - Chart on Market Overview
- Executive Summary - Data Table on Market Overview
- Executive Summary - Chart on Global Market Characteristics
- Executive Summary - Chart on Market By Geographical Landscape
- Executive Summary - Chart on Market Segmentation by Application
- Executive Summary - Chart on Market Segmentation by End-user
- Executive Summary - Chart on Incremental Growth
- Executive Summary - Data Table on Incremental Growth
- Executive Summary - Chart on Company Market Positioning
2 Market Landscape
- 2.1 Market ecosystem
- Parent Market
- Data Table on - Parent Market
- 2.2 Market characteristics
- Market characteristics analysis
- 2.3 Value chain analysis
- Value Chain Analysis
3 Market Sizing
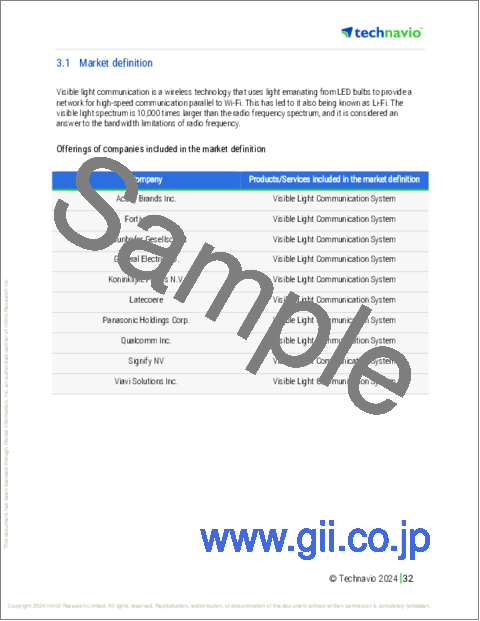
- 3.1 Market definition
- Offerings of companies included in the market definition
- 3.2 Market segment analysis
- Market segments
- 3.3 Market size 2023
- 3.4 Market outlook: Forecast for 2023-2028
- Chart on Global - Market size and forecast 2023-2028 ($ million)
- Data Table on Global - Market size and forecast 2023-2028 ($ million)
- Chart on Global Market: Year-over-year growth 2023-2028 (%)
- Data Table on Global Market: Year-over-year growth 2023-2028 (%)
4 Historic Market Size
- 4.1 Global Visible Light Communication Market 2018 - 2022
- Historic Market Size - Data Table on Global Visible Light Communication Market 2018 - 2022 ($ million)
- 4.2 Application segment analysis 2018 - 2022
- Historic Market Size - Application Segment 2018 - 2022 ($ million)
- 4.3 End-user segment analysis 2018 - 2022
- Historic Market Size - End-user Segment 2018 - 2022 ($ million)
- 4.4 Geography segment analysis 2018 - 2022
- Historic Market Size - Geography Segment 2018 - 2022 ($ million)
- 4.5 Country segment analysis 2018 - 2022
- Historic Market Size - Country Segment 2018 - 2022 ($ million)
5 Five Forces Analysis
- 5.1 Five forces summary
- Five forces analysis - Comparison between 2023 and 2028
- 5.2 Bargaining power of buyers
- Bargaining power of buyers - Impact of key factors 2023 and 2028
- 5.3 Bargaining power of suppliers
- Bargaining power of suppliers - Impact of key factors in 2023 and 2028
- 5.4 Threat of new entrants
- Threat of new entrants - Impact of key factors in 2023 and 2028
- 5.5 Threat of substitutes
- Threat of substitutes - Impact of key factors in 2023 and 2028
- 5.6 Threat of rivalry
- Threat of rivalry - Impact of key factors in 2023 and 2028
- 5.7 Market condition
- Chart on Market condition - Five forces 2023 and 2028
6 Market Segmentation by Application
- 6.1 Market segments
- Chart on Application - Market share 2023-2028 (%)
- Data Table on Application - Market share 2023-2028 (%)
- 6.2 Comparison by Application
- Chart on Comparison by Application
- Data Table on Comparison by Application
- 6.3 Indoor networking - Market size and forecast 2023-2028
- Chart on Indoor networking - Market size and forecast 2023-2028 ($ million)
- Data Table on Indoor networking - Market size and forecast 2023-2028 ($ million)
- Chart on Indoor networking - Year-over-year growth 2023-2028 (%)
- Data Table on Indoor networking - Year-over-year growth 2023-2028 (%)
- 6.4 LBS - Market size and forecast 2023-2028
- Chart on LBS - Market size and forecast 2023-2028 ($ million)
- Data Table on LBS - Market size and forecast 2023-2028 ($ million)
- Chart on LBS - Year-over-year growth 2023-2028 (%)
- Data Table on LBS - Year-over-year growth 2023-2028 (%)
- 6.5 ICE - Market size and forecast 2023-2028
- Chart on ICE - Market size and forecast 2023-2028 ($ million)
- Data Table on ICE - Market size and forecast 2023-2028 ($ million)
- Chart on ICE - Year-over-year growth 2023-2028 (%)
- Data Table on ICE - Year-over-year growth 2023-2028 (%)
- 6.6 Underwater communication - Market size and forecast 2023-2028
- Chart on Underwater communication - Market size and forecast 2023-2028 ($ million)
- Data Table on Underwater communication - Market size and forecast 2023-2028 ($ million)
- Chart on Underwater communication - Year-over-year growth 2023-2028 (%)
- Data Table on Underwater communication - Year-over-year growth 2023-2028 (%)
- 6.7 Market opportunity by Application
- Market opportunity by Application ($ million)
- Data Table on Market opportunity by Application ($ million)
7 Market Segmentation by End-user
- 7.1 Market segments
- Chart on End-user - Market share 2023-2028 (%)
- Data Table on End-user - Market share 2023-2028 (%)
- 7.2 Comparison by End-user
- Chart on Comparison by End-user
- Data Table on Comparison by End-user
- 7.3 Retail - Market size and forecast 2023-2028
- Chart on Retail - Market size and forecast 2023-2028 ($ million)
- Data Table on Retail - Market size and forecast 2023-2028 ($ million)
- Chart on Retail - Year-over-year growth 2023-2028 (%)
- Data Table on Retail - Year-over-year growth 2023-2028 (%)
- 7.4 Consumer electronics - Market size and forecast 2023-2028
- Chart on Consumer electronics - Market size and forecast 2023-2028 ($ million)
- Data Table on Consumer electronics - Market size and forecast 2023-2028 ($ million)
- Chart on Consumer electronics - Year-over-year growth 2023-2028 (%)
- Data Table on Consumer electronics - Year-over-year growth 2023-2028 (%)
- 7.5 Automotive and transportation - Market size and forecast 2023-2028
- Chart on Automotive and transportation - Market size and forecast 2023-2028 ($ million)
- Data Table on Automotive and transportation - Market size and forecast 2023-2028 ($ million)
- Chart on Automotive and transportation - Year-over-year growth 2023-2028 (%)
- Data Table on Automotive and transportation - Year-over-year growth 2023-2028 (%)
- 7.6 Healthcare - Market size and forecast 2023-2028
- Chart on Healthcare - Market size and forecast 2023-2028 ($ million)
- Data Table on Healthcare - Market size and forecast 2023-2028 ($ million)
- Chart on Healthcare - Year-over-year growth 2023-2028 (%)
- Data Table on Healthcare - Year-over-year growth 2023-2028 (%)
- 7.7 Others - Market size and forecast 2023-2028
- Chart on Others - Market size and forecast 2023-2028 ($ million)
- Data Table on Others - Market size and forecast 2023-2028 ($ million)
- Chart on Others - Year-over-year growth 2023-2028 (%)
- Data Table on Others - Year-over-year growth 2023-2028 (%)
- 7.8 Market opportunity by End-user
- Market opportunity by End-user ($ million)
- Data Table on Market opportunity by End-user ($ million)
8 Customer Landscape
- 8.1 Customer landscape overview
- Analysis of price sensitivity, lifecycle, customer purchase basket, adoption rates, and purchase criteria
9 Geographic Landscape
- 9.1 Geographic segmentation
- Chart on Market share By Geographical Landscape 2023-2028 (%)
- Data Table on Market share By Geographical Landscape 2023-2028 (%)
- 9.2 Geographic comparison
- Chart on Geographic comparison
- Data Table on Geographic comparison
- 9.3 North America - Market size and forecast 2023-2028
- Chart on North America - Market size and forecast 2023-2028 ($ million)
- Data Table on North America - Market size and forecast 2023-2028 ($ million)
- Chart on North America - Year-over-year growth 2023-2028 (%)
- Data Table on North America - Year-over-year growth 2023-2028 (%)
- 9.4 APAC - Market size and forecast 2023-2028
- Chart on APAC - Market size and forecast 2023-2028 ($ million)
- Data Table on APAC - Market size and forecast 2023-2028 ($ million)
- Chart on APAC - Year-over-year growth 2023-2028 (%)
- Data Table on APAC - Year-over-year growth 2023-2028 (%)
- 9.5 Europe - Market size and forecast 2023-2028
- Chart on Europe - Market size and forecast 2023-2028 ($ million)
- Data Table on Europe - Market size and forecast 2023-2028 ($ million)
- Chart on Europe - Year-over-year growth 2023-2028 (%)
- Data Table on Europe - Year-over-year growth 2023-2028 (%)
- 9.6 South America - Market size and forecast 2023-2028
- Chart on South America - Market size and forecast 2023-2028 ($ million)
- Data Table on South America - Market size and forecast 2023-2028 ($ million)
- Chart on South America - Year-over-year growth 2023-2028 (%)
- Data Table on South America - Year-over-year growth 2023-2028 (%)
- 9.7 Middle East and Africa - Market size and forecast 2023-2028
- Chart on Middle East and Africa - Market size and forecast 2023-2028 ($ million)
- Data Table on Middle East and Africa - Market size and forecast 2023-2028 ($ million)
- Chart on Middle East and Africa - Year-over-year growth 2023-2028 (%)
- Data Table on Middle East and Africa - Year-over-year growth 2023-2028 (%)
- 9.8 US - Market size and forecast 2023-2028
- Chart on US - Market size and forecast 2023-2028 ($ million)
- Data Table on US - Market size and forecast 2023-2028 ($ million)
- Chart on US - Year-over-year growth 2023-2028 (%)
- Data Table on US - Year-over-year growth 2023-2028 (%)
- 9.9 China - Market size and forecast 2023-2028
- Chart on China - Market size and forecast 2023-2028 ($ million)
- Data Table on China - Market size and forecast 2023-2028 ($ million)
- Chart on China - Year-over-year growth 2023-2028 (%)
- Data Table on China - Year-over-year growth 2023-2028 (%)
- 9.10 Japan - Market size and forecast 2023-2028
- Chart on Japan - Market size and forecast 2023-2028 ($ million)
- Data Table on Japan - Market size and forecast 2023-2028 ($ million)
- Chart on Japan - Year-over-year growth 2023-2028 (%)
- Data Table on Japan - Year-over-year growth 2023-2028 (%)
- 9.11 Germany - Market size and forecast 2023-2028
- Chart on Germany - Market size and forecast 2023-2028 ($ million)
- Data Table on Germany - Market size and forecast 2023-2028 ($ million)
- Chart on Germany - Year-over-year growth 2023-2028 (%)
- Data Table on Germany - Year-over-year growth 2023-2028 (%)
- 9.12 UK - Market size and forecast 2023-2028
- Chart on UK - Market size and forecast 2023-2028 ($ million)
- Data Table on UK - Market size and forecast 2023-2028 ($ million)
- Chart on UK - Year-over-year growth 2023-2028 (%)
- Data Table on UK - Year-over-year growth 2023-2028 (%)
- 9.13 Market opportunity By Geographical Landscape
- Market opportunity By Geographical Landscape ($ million)
- Data Tables on Market opportunity By Geographical Landscape ($ million)
10 Drivers, Challenges, and Opportunity/Restraints
- 10.1 Market drivers
- 10.2 Market challenges
- 10.3 Impact of drivers and challenges
- Impact of drivers and challenges in 2023 and 2028
- 10.4 Market opportunities/restraints
11 Competitive Landscape
- 11.1 Overview
- 11.2 Competitive Landscape
- Overview on criticality of inputs and factors of differentiation
- 11.3 Landscape disruption
- Overview on factors of disruption
- 11.4 Industry risks
- Impact of key risks on business
12 Competitive Analysis
- 12.1 Companies profiled
- Companies covered
- 12.2 Market positioning of companies
- Matrix on companies position and classification
- 12.3 Firefly Networks Ltd.
- Firefly Networks Ltd. - Overview
- Firefly Networks Ltd. - Product / Service
- Firefly Networks Ltd. - Key offerings
- 12.4 Fortive Corp.
- Fortive Corp. - Overview
- Fortive Corp. - Business segments
- Fortive Corp. - Key news
- Fortive Corp. - Key offerings
- Fortive Corp. - Segment focus
- 12.5 Fraunhofer Society
- Fraunhofer Society - Overview
- Fraunhofer Society - Product / Service
- Fraunhofer Society - Key offerings
- 12.6 fSONA Systems Corp.
- fSONA Systems Corp. - Overview
- fSONA Systems Corp. - Product / Service
- fSONA Systems Corp. - Key offerings
- 12.7 General Electric Co.
- General Electric Co. - Overview
- General Electric Co. - Business segments
- General Electric Co. - Key news
- General Electric Co. - Key offerings
- General Electric Co. - Segment focus
- 12.8 Koninklijke Philips NV
- Koninklijke Philips NV - Overview
- Koninklijke Philips NV - Business segments
- Koninklijke Philips NV - Key news
- Koninklijke Philips NV - Key offerings
- Koninklijke Philips NV - Segment focus
- 12.9 Lucibel SA
- Lucibel SA - Overview
- Lucibel SA - Product / Service
- Lucibel SA - Key offerings
- 12.10 Oledcomm
- Oledcomm - Overview
- Oledcomm - Product / Service
- Oledcomm - Key offerings
- 12.11 Panasonic Holdings Corp.
- Panasonic Holdings Corp. - Overview
- Panasonic Holdings Corp. - Business segments
- Panasonic Holdings Corp. - Key news
- Panasonic Holdings Corp. - Key offerings
- Panasonic Holdings Corp. - Segment focus
- 12.12 pureLiFi Ltd.
- pureLiFi Ltd. - Overview
- pureLiFi Ltd. - Product / Service
- pureLiFi Ltd. - Key offerings
- 12.13 Qualcomm Inc.
- Qualcomm Inc. - Overview
- Qualcomm Inc. - Business segments
- Qualcomm Inc. - Key news
- Qualcomm Inc. - Key offerings
- Qualcomm Inc. - Segment focus
- 12.14 Renesas Electronics Corp.
- Renesas Electronics Corp. - Overview
- Renesas Electronics Corp. - Business segments
- Renesas Electronics Corp. - Key news
- Renesas Electronics Corp. - Key offerings
- Renesas Electronics Corp. - Segment focus
- 12.15 Signify NV
- Signify NV - Overview
- Signify NV - Business segments
- Signify NV - Key news
- Signify NV - Key offerings
- Signify NV - Segment focus
- 12.16 Viavi Solutions Inc.
- Viavi Solutions Inc. - Overview
- Viavi Solutions Inc. - Business segments
- Viavi Solutions Inc. - Key news
- Viavi Solutions Inc. - Key offerings
- Viavi Solutions Inc. - Segment focus
- 12.17 VLNComm Inc.
- VLNComm Inc. - Overview
- VLNComm Inc. - Product / Service
- VLNComm Inc. - Key offerings
13 Appendix
- 13.1 Scope of the report
- 13.2 Inclusions and exclusions checklist
- Inclusions checklist
- Exclusions checklist
- 13.3 Currency conversion rates for US$
- Currency conversion rates for US$
- 13.4 Research methodology
- Research methodology
- 13.5 Data procurement
- Information sources
- 13.6 Data validation
- Data validation
- 13.7 Validation techniques employed for market sizing
- Validation techniques employed for market sizing
- 13.8 Data synthesis
- Data synthesis
- 13.9 360 degree market analysis
- 360 degree market analysis
- 13.10 List of abbreviations
- List of abbreviations

