|
|
市場調査レポート
商品コード
1723023
屋内測位と屋内ナビゲーション(IPIN)の世界市場 2025~2029年Global Indoor Positioning and Indoor Navigation (IPIN) Market 2025-2029 |
||||||

|
|||||||
カスタマイズ可能
|
|||||||


| 屋内測位と屋内ナビゲーション(IPIN)の世界市場 2025~2029年 |
|
出版日: 2025年05月03日
発行: TechNavio
ページ情報: 英文 228 Pages
納期: 即納可能
|

全表示
- 概要
- 図表
- 目次
屋内測位と屋内ナビゲーション(IPIN)市場は2024-2029年に4,038億3,170万米ドル、予測期間中のCAGRは72.2%で成長すると予測されます。
当レポートでは、屋内測位と屋内ナビゲーション(IPIN)市場の全体的な分析、市場規模・予測、動向、成長促進要因、課題、約25のベンダーを網羅したベンダー分析などを掲載しています。
現在の市場シナリオ、最新動向と促進要因、市場環境全体に関する最新分析を提供しています。市場を牽引するのは、低コストのビーコン技術、モバイルコンピューティングデバイスの高い普及率、ジオマーケティング事業の成長です。
| 市場範囲 | |
|---|---|
| 基準年 | 2025 |
| 終了年 | 2029 |
| 予測期間 | 2025-2029 |
| 成長モメンタム | 加速 |
| 前年比2025年 | 42.8% |
| CAGR | 72.2% |
| 増分額 | 4,038億3,170万米ドル |
本調査は、業界の主要参加者からのインプットを含め、一次情報と二次情報を客観的に組み合わせて実施しました。レポートには、主要企業の分析に加え、包括的な市場規模データ、地域分析によるセグメント、ベンダー情勢が含まれています。レポートには過去データと予測データがあります。
本調査では、今後数年間の屋内測位と屋内ナビゲーション(IPIN)市場の成長を促進する主な要因の1つとして、従来の小売業を変えるbleベースのビーコンを挙げています。また、クラウドベースのビッグデータ分析の人気の高まりと、ビジネスにおけるibeaconの利用の増加は、市場の大きな需要につながります。
目次
第1章 エグゼクティブサマリー
- 市場概要
第2章 Technavio分析
- 価格・ライフサイクル・顧客購入バスケット・採用率・購入基準の分析
- インプットの重要性と差別化の要因
- 混乱の要因
- 促進要因と課題の影響
第3章 市場情勢
- 市場エコシステム
- 市場の特徴
- バリューチェーン分析
第4章 市場規模
- 市場の定義
- 市場セグメント分析
- 市場規模 2024
- 市場の見通し 2024-2029
第5章 市場規模実績
- 屋内測位と屋内ナビゲーション(IPIN)の世界市場 2019-2023
- 用途別セグメント分析 2019-2023
- 技術別セグメント分析 2019-2023
- コンポーネント別セグメント分析 2019-2023
- 地域別セグメント分析 2019-2023
- 国別セグメント分析 2019-2023
第6章 定性分析
- AIの影響:屋内測位と屋内ナビゲーション(IPIN)の世界市場
第7章 ファイブフォース分析
- ファイブフォースの要約
- 買い手の交渉力
- 供給企業の交渉力
- 新規参入業者の脅威
- 代替品の脅威
- 競争の脅威
- 市況
第8章 市場セグメンテーション:用途別
- 市場セグメント
- 比較:用途別
- 小売り:市場規模と予測 2024-2029
- 航空:市場規模と予測 2024-2029
- ヘルスケア:市場規模と予測 2024-2029
- 製造および物流:市場規模と予測 2024-2029
- 政府および公共部門:市場規模と予測 2024-2029
- 市場機会:用途別
第9章 市場セグメンテーション:技術別
- 市場セグメント
- 比較:技術別
- 超広帯域(UWB)システム:市場規模と予測 2024-2029
- WiFiベースのシステム:市場規模と予測 2024-2029
- 近接ベースのシステム:市場規模と予測 2024-2029
- その他:市場規模と予測 2024-2029
- 市場機会:技術別
第10章 市場セグメンテーション:コンポーネント別
- 市場セグメント
- 比較:コンポーネント別
- ハードウェア:市場規模と予測 2024-2029
- ソフトウェア:市場規模と予測 2024-2029
- サービス:市場規模と予測 2024-2029
- 市場機会:コンポーネント別
第11章 顧客情勢
- 顧客情勢の概要
第12章 地域別情勢
- 地域別セグメンテーション
- 地域別比較
- 北米:市場規模と予測 2024-2029
- アジア太平洋:市場規模と予測 2024-2029
- 欧州:市場規模と予測 2024-2029
- 南米:市場規模と予測 2024-2029
- 中東・アフリカ:市場規模と予測 2024-2029
- 米国:市場規模と予測 2024-2029
- 中国:市場規模と予測 2024-2029
- カナダ:市場規模と予測 2024-2029
- ドイツ:市場規模と予測 2024-2029
- 英国:市場規模と予測 2024-2029
- 日本:市場規模と予測 2024-2029
- インド:市場規模と予測 2024-2029
- 韓国:市場規模と予測 2024-2029
- フランス:市場規模と予測 2024-2029
- イタリア:市場規模と予測 2024-2029
- 市場機会:地域情勢別
第13章 促進要因・課題・機会・抑制要因
- 市場促進要因
- 市場の課題
- 促進要因と課題の影響
- 市場の機会・抑制要因
第14章 競合情勢
- 概要
- 競合情勢
- 混乱の状況
- 業界のリスク
第15章 競合分析
- 企業プロファイル
- 企業ランキング指数
- 企業の市場ポジショニング
- Alphabet Inc.
- Apple Inc.
- bluepath AG
- Broadcom Inc.
- Cisco Systems Inc.
- Esri Global Inc.
- GiPStech Srl
- IndoorAtlas Ltd.
- MazeMap AS
- Navigine Corp.
- Nextome Srl
- Pinmicro K K
- Pointr Ltd.
- Sensewhere Ltd.
- Spreo
第16章 付録
Exhibits:
- Exhibits1: Executive Summary - Chart on Market Overview
- Exhibits2: Executive Summary - Data Table on Market Overview
- Exhibits3: Executive Summary - Chart on Global Market Characteristics
- Exhibits4: Executive Summary - Chart on Market By Geographical Landscape
- Exhibits5: Executive Summary - Chart on Market Segmentation by Application
- Exhibits6: Executive Summary - Chart on Market Segmentation by Technology
- Exhibits7: Executive Summary - Chart on Market Segmentation by Component
- Exhibits8: Executive Summary - Chart on Incremental Growth
- Exhibits9: Executive Summary - Data Table on Incremental Growth
- Exhibits10: Executive Summary - Chart on Company Market Positioning
- Exhibits11: Analysis of price sensitivity, lifecycle, customer purchase basket, adoption rates, and purchase criteria
- Exhibits12: Overview on criticality of inputs and factors of differentiation
- Exhibits13: Overview on factors of disruption
- Exhibits14: Impact of drivers and challenges in 2024 and 2029
- Exhibits15: Parent Market
- Exhibits16: Data Table on - Parent Market
- Exhibits17: Market characteristics analysis
- Exhibits18: Value chain analysis
- Exhibits19: Offerings of companies included in the market definition
- Exhibits20: Market segments
- Exhibits21: Chart on Global - Market size and forecast 2024-2029 ($ million)
- Exhibits22: Data Table on Global - Market size and forecast 2024-2029 ($ million)
- Exhibits23: Chart on Global Market: Year-over-year growth 2024-2029 (%)
- Exhibits24: Data Table on Global Market: Year-over-year growth 2024-2029 (%)
- Exhibits25: Historic Market Size - Data Table on Global Indoor Positioning And Indoor Navigation (IPIN) Market 2019 - 2023 ($ million)
- Exhibits26: Historic Market Size - Application Segment 2019 - 2023 ($ million)
- Exhibits27: Historic Market Size - Technology Segment 2019 - 2023 ($ million)
- Exhibits28: Historic Market Size - Component Segment 2019 - 2023 ($ million)
- Exhibits29: Historic Market Size - Geography Segment 2019 - 2023 ($ million)
- Exhibits30: Historic Market Size - Country Segment 2019 - 2023 ($ million)
- Exhibits31: Five forces analysis - Comparison between 2024 and 2029
- Exhibits32: Bargaining power of buyers - Impact of key factors 2024 and 2029
- Exhibits33: Bargaining power of suppliers - Impact of key factors in 2024 and 2029
- Exhibits34: Threat of new entrants - Impact of key factors in 2024 and 2029
- Exhibits35: Threat of substitutes - Impact of key factors in 2024 and 2029
- Exhibits36: Threat of rivalry - Impact of key factors in 2024 and 2029
- Exhibits37: Chart on Market condition - Five forces 2024 and 2029
- Exhibits38: Chart on Application - Market share 2024-2029 (%)
- Exhibits39: Data Table on Application - Market share 2024-2029 (%)
- Exhibits40: Chart on Comparison by Application
- Exhibits41: Data Table on Comparison by Application
- Exhibits42: Chart on Retail - Market size and forecast 2024-2029 ($ million)
- Exhibits43: Data Table on Retail - Market size and forecast 2024-2029 ($ million)
- Exhibits44: Chart on Retail - Year-over-year growth 2024-2029 (%)
- Exhibits45: Data Table on Retail - Year-over-year growth 2024-2029 (%)
- Exhibits46: Chart on Aviation - Market size and forecast 2024-2029 ($ million)
- Exhibits47: Data Table on Aviation - Market size and forecast 2024-2029 ($ million)
- Exhibits48: Chart on Aviation - Year-over-year growth 2024-2029 (%)
- Exhibits49: Data Table on Aviation - Year-over-year growth 2024-2029 (%)
- Exhibits50: Chart on Healthcare - Market size and forecast 2024-2029 ($ million)
- Exhibits51: Data Table on Healthcare - Market size and forecast 2024-2029 ($ million)
- Exhibits52: Chart on Healthcare - Year-over-year growth 2024-2029 (%)
- Exhibits53: Data Table on Healthcare - Year-over-year growth 2024-2029 (%)
- Exhibits54: Chart on Manufacturing and logistics - Market size and forecast 2024-2029 ($ million)
- Exhibits55: Data Table on Manufacturing and logistics - Market size and forecast 2024-2029 ($ million)
- Exhibits56: Chart on Manufacturing and logistics - Year-over-year growth 2024-2029 (%)
- Exhibits57: Data Table on Manufacturing and logistics - Year-over-year growth 2024-2029 (%)
- Exhibits58: Chart on Government and public sector - Market size and forecast 2024-2029 ($ million)
- Exhibits59: Data Table on Government and public sector - Market size and forecast 2024-2029 ($ million)
- Exhibits60: Chart on Government and public sector - Year-over-year growth 2024-2029 (%)
- Exhibits61: Data Table on Government and public sector - Year-over-year growth 2024-2029 (%)
- Exhibits62: Market opportunity by Application ($ million)
- Exhibits63: Data Table on Market opportunity by Application ($ million)
- Exhibits64: Chart on Technology - Market share 2024-2029 (%)
- Exhibits65: Data Table on Technology - Market share 2024-2029 (%)
- Exhibits66: Chart on Comparison by Technology
- Exhibits67: Data Table on Comparison by Technology
- Exhibits68: Chart on Ultra wide-band (UWB) systems - Market size and forecast 2024-2029 ($ million)
- Exhibits69: Data Table on Ultra wide-band (UWB) systems - Market size and forecast 2024-2029 ($ million)
- Exhibits70: Chart on Ultra wide-band (UWB) systems - Year-over-year growth 2024-2029 (%)
- Exhibits71: Data Table on Ultra wide-band (UWB) systems - Year-over-year growth 2024-2029 (%)
- Exhibits72: Chart on WiFi-based systems - Market size and forecast 2024-2029 ($ million)
- Exhibits73: Data Table on WiFi-based systems - Market size and forecast 2024-2029 ($ million)
- Exhibits74: Chart on WiFi-based systems - Year-over-year growth 2024-2029 (%)
- Exhibits75: Data Table on WiFi-based systems - Year-over-year growth 2024-2029 (%)
- Exhibits76: Chart on Proximity-based systems - Market size and forecast 2024-2029 ($ million)
- Exhibits77: Data Table on Proximity-based systems - Market size and forecast 2024-2029 ($ million)
- Exhibits78: Chart on Proximity-based systems - Year-over-year growth 2024-2029 (%)
- Exhibits79: Data Table on Proximity-based systems - Year-over-year growth 2024-2029 (%)
- Exhibits80: Chart on Others - Market size and forecast 2024-2029 ($ million)
- Exhibits81: Data Table on Others - Market size and forecast 2024-2029 ($ million)
- Exhibits82: Chart on Others - Year-over-year growth 2024-2029 (%)
- Exhibits83: Data Table on Others - Year-over-year growth 2024-2029 (%)
- Exhibits84: Market opportunity by Technology ($ million)
- Exhibits85: Data Table on Market opportunity by Technology ($ million)
- Exhibits86: Chart on Component - Market share 2024-2029 (%)
- Exhibits87: Data Table on Component - Market share 2024-2029 (%)
- Exhibits88: Chart on Comparison by Component
- Exhibits89: Data Table on Comparison by Component
- Exhibits90: Chart on Hardware - Market size and forecast 2024-2029 ($ million)
- Exhibits91: Data Table on Hardware - Market size and forecast 2024-2029 ($ million)
- Exhibits92: Chart on Hardware - Year-over-year growth 2024-2029 (%)
- Exhibits93: Data Table on Hardware - Year-over-year growth 2024-2029 (%)
- Exhibits94: Chart on Software - Market size and forecast 2024-2029 ($ million)
- Exhibits95: Data Table on Software - Market size and forecast 2024-2029 ($ million)
- Exhibits96: Chart on Software - Year-over-year growth 2024-2029 (%)
- Exhibits97: Data Table on Software - Year-over-year growth 2024-2029 (%)
- Exhibits98: Chart on Services - Market size and forecast 2024-2029 ($ million)
- Exhibits99: Data Table on Services - Market size and forecast 2024-2029 ($ million)
- Exhibits100: Chart on Services - Year-over-year growth 2024-2029 (%)
- Exhibits101: Data Table on Services - Year-over-year growth 2024-2029 (%)
- Exhibits102: Market opportunity by Component ($ million)
- Exhibits103: Data Table on Market opportunity by Component ($ million)
- Exhibits104: Analysis of price sensitivity, lifecycle, customer purchase basket, adoption rates, and purchase criteria
- Exhibits105: Chart on Market share By Geographical Landscape 2024-2029 (%)
- Exhibits106: Data Table on Market share By Geographical Landscape 2024-2029 (%)
- Exhibits107: Chart on Geographic comparison
- Exhibits108: Data Table on Geographic comparison
- Exhibits109: Chart on North America - Market size and forecast 2024-2029 ($ million)
- Exhibits110: Data Table on North America - Market size and forecast 2024-2029 ($ million)
- Exhibits111: Chart on North America - Year-over-year growth 2024-2029 (%)
- Exhibits112: Data Table on North America - Year-over-year growth 2024-2029 (%)
- Exhibits113: Chart on APAC - Market size and forecast 2024-2029 ($ million)
- Exhibits114: Data Table on APAC - Market size and forecast 2024-2029 ($ million)
- Exhibits115: Chart on APAC - Year-over-year growth 2024-2029 (%)
- Exhibits116: Data Table on APAC - Year-over-year growth 2024-2029 (%)
- Exhibits117: Chart on Europe - Market size and forecast 2024-2029 ($ million)
- Exhibits118: Data Table on Europe - Market size and forecast 2024-2029 ($ million)
- Exhibits119: Chart on Europe - Year-over-year growth 2024-2029 (%)
- Exhibits120: Data Table on Europe - Year-over-year growth 2024-2029 (%)
- Exhibits121: Chart on South America - Market size and forecast 2024-2029 ($ million)
- Exhibits122: Data Table on South America - Market size and forecast 2024-2029 ($ million)
- Exhibits123: Chart on South America - Year-over-year growth 2024-2029 (%)
- Exhibits124: Data Table on South America - Year-over-year growth 2024-2029 (%)
- Exhibits125: Chart on Middle East and Africa - Market size and forecast 2024-2029 ($ million)
- Exhibits126: Data Table on Middle East and Africa - Market size and forecast 2024-2029 ($ million)
- Exhibits127: Chart on Middle East and Africa - Year-over-year growth 2024-2029 (%)
- Exhibits128: Data Table on Middle East and Africa - Year-over-year growth 2024-2029 (%)
- Exhibits129: Chart on US - Market size and forecast 2024-2029 ($ million)
- Exhibits130: Data Table on US - Market size and forecast 2024-2029 ($ million)
- Exhibits131: Chart on US - Year-over-year growth 2024-2029 (%)
- Exhibits132: Data Table on US - Year-over-year growth 2024-2029 (%)
- Exhibits133: Chart on China - Market size and forecast 2024-2029 ($ million)
- Exhibits134: Data Table on China - Market size and forecast 2024-2029 ($ million)
- Exhibits135: Chart on China - Year-over-year growth 2024-2029 (%)
- Exhibits136: Data Table on China - Year-over-year growth 2024-2029 (%)
- Exhibits137: Chart on Canada - Market size and forecast 2024-2029 ($ million)
- Exhibits138: Data Table on Canada - Market size and forecast 2024-2029 ($ million)
- Exhibits139: Chart on Canada - Year-over-year growth 2024-2029 (%)
- Exhibits140: Data Table on Canada - Year-over-year growth 2024-2029 (%)
- Exhibits141: Chart on Germany - Market size and forecast 2024-2029 ($ million)
- Exhibits142: Data Table on Germany - Market size and forecast 2024-2029 ($ million)
- Exhibits143: Chart on Germany - Year-over-year growth 2024-2029 (%)
- Exhibits144: Data Table on Germany - Year-over-year growth 2024-2029 (%)
- Exhibits145: Chart on UK - Market size and forecast 2024-2029 ($ million)
- Exhibits146: Data Table on UK - Market size and forecast 2024-2029 ($ million)
- Exhibits147: Chart on UK - Year-over-year growth 2024-2029 (%)
- Exhibits148: Data Table on UK - Year-over-year growth 2024-2029 (%)
- Exhibits149: Chart on Japan - Market size and forecast 2024-2029 ($ million)
- Exhibits150: Data Table on Japan - Market size and forecast 2024-2029 ($ million)
- Exhibits151: Chart on Japan - Year-over-year growth 2024-2029 (%)
- Exhibits152: Data Table on Japan - Year-over-year growth 2024-2029 (%)
- Exhibits153: Chart on India - Market size and forecast 2024-2029 ($ million)
- Exhibits154: Data Table on India - Market size and forecast 2024-2029 ($ million)
- Exhibits155: Chart on India - Year-over-year growth 2024-2029 (%)
- Exhibits156: Data Table on India - Year-over-year growth 2024-2029 (%)
- Exhibits157: Chart on South Korea - Market size and forecast 2024-2029 ($ million)
- Exhibits158: Data Table on South Korea - Market size and forecast 2024-2029 ($ million)
- Exhibits159: Chart on South Korea - Year-over-year growth 2024-2029 (%)
- Exhibits160: Data Table on South Korea - Year-over-year growth 2024-2029 (%)
- Exhibits161: Chart on France - Market size and forecast 2024-2029 ($ million)
- Exhibits162: Data Table on France - Market size and forecast 2024-2029 ($ million)
- Exhibits163: Chart on France - Year-over-year growth 2024-2029 (%)
- Exhibits164: Data Table on France - Year-over-year growth 2024-2029 (%)
- Exhibits165: Chart on Italy - Market size and forecast 2024-2029 ($ million)
- Exhibits166: Data Table on Italy - Market size and forecast 2024-2029 ($ million)
- Exhibits167: Chart on Italy - Year-over-year growth 2024-2029 (%)
- Exhibits168: Data Table on Italy - Year-over-year growth 2024-2029 (%)
- Exhibits169: Market opportunity By Geographical Landscape ($ million)
- Exhibits170: Data Tables on Market opportunity By Geographical Landscape ($ million)
- Exhibits171: Impact of drivers and challenges in 2024 and 2029
- Exhibits172: Overview on criticality of inputs and factors of differentiation
- Exhibits173: Overview on factors of disruption
- Exhibits174: Impact of key risks on business
- Exhibits175: Companies covered
- Exhibits176: Company ranking index
- Exhibits177: Matrix on companies position and classification
- Exhibits178: Alphabet Inc. - Overview
- Exhibits179: Alphabet Inc. - Business segments
- Exhibits180: Alphabet Inc. - Key offerings
- Exhibits181: Alphabet Inc. - Segment focus
- Exhibits182: SWOT
- Exhibits183: Apple Inc. - Overview
- Exhibits184: Apple Inc. - Business segments
- Exhibits185: Apple Inc. - Key news
- Exhibits186: Apple Inc. - Key offerings
- Exhibits187: Apple Inc. - Segment focus
- Exhibits188: SWOT
- Exhibits189: bluepath AG - Overview
- Exhibits190: bluepath AG - Product / Service
- Exhibits191: bluepath AG - Key offerings
- Exhibits192: SWOT
- Exhibits193: Broadcom Inc. - Overview
- Exhibits194: Broadcom Inc. - Business segments
- Exhibits195: Broadcom Inc. - Key news
- Exhibits196: Broadcom Inc. - Key offerings
- Exhibits197: Broadcom Inc. - Segment focus
- Exhibits198: SWOT
- Exhibits199: Cisco Systems Inc. - Overview
- Exhibits200: Cisco Systems Inc. - Business segments
- Exhibits201: Cisco Systems Inc. - Key news
- Exhibits202: Cisco Systems Inc. - Key offerings
- Exhibits203: Cisco Systems Inc. - Segment focus
- Exhibits204: SWOT
- Exhibits205: Esri Global Inc. - Overview
- Exhibits206: Esri Global Inc. - Product / Service
- Exhibits207: Esri Global Inc. - Key offerings
- Exhibits208: SWOT
- Exhibits209: GiPStech Srl - Overview
- Exhibits210: GiPStech Srl - Product / Service
- Exhibits211: GiPStech Srl - Key offerings
- Exhibits212: SWOT
- Exhibits213: IndoorAtlas Ltd. - Overview
- Exhibits214: IndoorAtlas Ltd. - Product / Service
- Exhibits215: IndoorAtlas Ltd. - Key offerings
- Exhibits216: SWOT
- Exhibits217: MazeMap AS - Overview
- Exhibits218: MazeMap AS - Product / Service
- Exhibits219: MazeMap AS - Key offerings
- Exhibits220: SWOT
- Exhibits221: Navigine Corp. - Overview
- Exhibits222: Navigine Corp. - Product / Service
- Exhibits223: Navigine Corp. - Key offerings
- Exhibits224: SWOT
- Exhibits225: Nextome Srl - Overview
- Exhibits226: Nextome Srl - Product / Service
- Exhibits227: Nextome Srl - Key offerings
- Exhibits228: SWOT
- Exhibits229: Pinmicro K K - Overview
- Exhibits230: Pinmicro K K - Product / Service
- Exhibits231: Pinmicro K K - Key offerings
- Exhibits232: SWOT
- Exhibits233: Pointr Ltd. - Overview
- Exhibits234: Pointr Ltd. - Product / Service
- Exhibits235: Pointr Ltd. - Key offerings
- Exhibits236: SWOT
- Exhibits237: Sensewhere Ltd. - Overview
- Exhibits238: Sensewhere Ltd. - Product / Service
- Exhibits239: Sensewhere Ltd. - Key offerings
- Exhibits240: SWOT
- Exhibits241: Spreo - Overview
- Exhibits242: Spreo - Product / Service
- Exhibits243: Spreo - Key offerings
- Exhibits244: SWOT
- Exhibits245: Inclusions checklist
- Exhibits246: Exclusions checklist
- Exhibits247: Currency conversion rates for US$
- Exhibits248: Research methodology
- Exhibits249: Information sources
- Exhibits250: Data validation
- Exhibits251: Validation techniques employed for market sizing
- Exhibits252: Data synthesis
- Exhibits253: 360 degree market analysis
- Exhibits254: List of abbreviations
The indoor positioning and indoor navigation (IPIN) market is forecasted to grow by USD 403831.7 mn during 2024-2029, accelerating at a CAGR of 72.2% during the forecast period. The report on the indoor positioning and indoor navigation (IPIN) market provides a holistic analysis, market size and forecast, trends, growth drivers, and challenges, as well as vendor analysis covering around 25 vendors.
The report offers an up-to-date analysis regarding the current market scenario, the latest trends and drivers, and the overall market environment. The market is driven by low-cost ble beacon technology, high penetration of mobile computing devices, and growth of geomarketing business.
| Market Scope | |
|---|---|
| Base Year | 2025 |
| End Year | 2029 |
| Series Year | 2025-2029 |
| Growth Momentum | Accelerate |
| YOY 2025 | 42.8% |
| CAGR | 72.2% |
| Incremental Value | $403831.7 mn |
The study was conducted using an objective combination of primary and secondary information including inputs from key participants in the industry. The report contains a comprehensive market size data, segment with regional analysis and vendor landscape in addition to an analysis of the key companies. Reports have historic and forecast data.
Technavio's indoor positioning and indoor navigation (IPIN) market is segmented as below:
By Application
- Retail
- Aviation
- Healthcare
- Manufacturing and logistics
- Government and public sector
By Technology
- Ultra wide-band (UWB) systems
- WiFi-based systems
- Proximity-based systems
- Others
By Component
- Hardware
- Software
- Services
By Geographical Landscape
- North America
- APAC
- Europe
- South America
- Middle East and Africa
This study identifies the ble-based beacons changing traditional retailing as one of the prime reasons driving the indoor positioning and indoor navigation (IPIN) market growth during the next few years. Also, growing popularity of cloud-based big data analytics and increasing use of ibeacon for businesses will lead to sizable demand in the market.
The report on the indoor positioning and indoor navigation (IPIN) market covers the following areas:
- Indoor Positioning And Indoor Navigation (IPIN) Market sizing
- Indoor Positioning And Indoor Navigation (IPIN) Market forecast
- Indoor Positioning And Indoor Navigation (IPIN) Market industry analysis
The robust vendor analysis is designed to help clients improve their market position, and in line with this, this report provides a detailed analysis of several leading indoor positioning and indoor navigation (IPIN) market vendors that include Alphabet Inc., Apple Inc., bluepath AG, Broadcom Inc., Cisco Systems Inc., Esri Global Inc., GiPStech Srl, HERE Global BV, IndoorAtlas Ltd., MazeMap AS, Microsoft Corp., Navigine Corp., Nextome Srl, Pinmicro K K, Pointr Ltd., Qualcomm Inc., Samsung Electronics Co. Ltd., Sensewhere Ltd., Spreo, and Verizon Communications Inc.. Also, the indoor positioning and indoor navigation (IPIN) market analysis report includes information on upcoming trends and challenges that will influence market growth. This is to help companies strategize and leverage all forthcoming growth opportunities.
The publisher presents a detailed picture of the market by the way of study, synthesis, and summation of data from multiple sources by an analysis of key parameters such as profit, pricing, competition, and promotions. It presents various market facets by identifying the key industry influencers. The data presented is comprehensive, reliable, and a result of extensive primary and secondary research. The market research reports provide a complete competitive landscape and an in-depth vendor selection methodology and analysis using qualitative and quantitative research to forecast accurate market growth.
Table of Contents
1 Executive Summary
- 1.1 Market overview
- Executive Summary - Chart on Market Overview
- Executive Summary - Data Table on Market Overview
- Executive Summary - Chart on Global Market Characteristics
- Executive Summary - Chart on Market By Geographical Landscape
- Executive Summary - Chart on Market Segmentation by Application
- Executive Summary - Chart on Market Segmentation by Technology
- Executive Summary - Chart on Market Segmentation by Component
- Executive Summary - Chart on Incremental Growth
- Executive Summary - Data Table on Incremental Growth
- Executive Summary - Chart on Company Market Positioning
2 Technavio Analysis
- 2.1 Analysis of price sensitivity, lifecycle, customer purchase basket, adoption rates, and purchase criteria
- Analysis of price sensitivity, lifecycle, customer purchase basket, adoption rates, and purchase criteria
- 2.2 Criticality of inputs and Factors of differentiation
- Overview on criticality of inputs and factors of differentiation
- 2.3 Factors of disruption
- Overview on factors of disruption
- 2.4 Impact of drivers and challenges
- Impact of drivers and challenges in 2024 and 2029
3 Market Landscape
- 3.1 Market ecosystem
- Parent Market
- Data Table on - Parent Market
- 3.2 Market characteristics
- Market characteristics analysis
- 3.3 Value chain analysis
- Value chain analysis
4 Market Sizing
- 4.1 Market definition
- Offerings of companies included in the market definition
- 4.2 Market segment analysis
- Market segments
- 4.3 Market size 2024
- 4.4 Market outlook: Forecast for 2024-2029
- Chart on Global - Market size and forecast 2024-2029 ($ million)
- Data Table on Global - Market size and forecast 2024-2029 ($ million)
- Chart on Global Market: Year-over-year growth 2024-2029 (%)
- Data Table on Global Market: Year-over-year growth 2024-2029 (%)
5 Historic Market Size
- 5.1 Global Indoor Positioning And Indoor Navigation (IPIN) Market 2019 - 2023
- Historic Market Size - Data Table on Global Indoor Positioning And Indoor Navigation (IPIN) Market 2019 - 2023 ($ million)
- 5.2 Application segment analysis 2019 - 2023
- Historic Market Size - Application Segment 2019 - 2023 ($ million)
- 5.3 Technology segment analysis 2019 - 2023
- Historic Market Size - Technology Segment 2019 - 2023 ($ million)
- 5.4 Component segment analysis 2019 - 2023
- Historic Market Size - Component Segment 2019 - 2023 ($ million)
- 5.5 Geography segment analysis 2019 - 2023
- Historic Market Size - Geography Segment 2019 - 2023 ($ million)
- 5.6 Country segment analysis 2019 - 2023
- Historic Market Size - Country Segment 2019 - 2023 ($ million)
6 Qualitative Analysis
- 6.1 Impact of AI in global indoor positioning and indoor navigation (IPIN) market
7 Five Forces Analysis
- 7.1 Five forces summary
- Five forces analysis - Comparison between 2024 and 2029
- 7.2 Bargaining power of buyers
- Bargaining power of buyers - Impact of key factors 2024 and 2029
- 7.3 Bargaining power of suppliers
- Bargaining power of suppliers - Impact of key factors in 2024 and 2029
- 7.4 Threat of new entrants
- Threat of new entrants - Impact of key factors in 2024 and 2029
- 7.5 Threat of substitutes
- Threat of substitutes - Impact of key factors in 2024 and 2029
- 7.6 Threat of rivalry
- Threat of rivalry - Impact of key factors in 2024 and 2029
- 7.7 Market condition
- Chart on Market condition - Five forces 2024 and 2029
8 Market Segmentation by Application
- 8.1 Market segments
- Chart on Application - Market share 2024-2029 (%)
- Data Table on Application - Market share 2024-2029 (%)
- 8.2 Comparison by Application
- Chart on Comparison by Application
- Data Table on Comparison by Application
- 8.3 Retail - Market size and forecast 2024-2029
- Chart on Retail - Market size and forecast 2024-2029 ($ million)
- Data Table on Retail - Market size and forecast 2024-2029 ($ million)
- Chart on Retail - Year-over-year growth 2024-2029 (%)
- Data Table on Retail - Year-over-year growth 2024-2029 (%)
- 8.4 Aviation - Market size and forecast 2024-2029
- Chart on Aviation - Market size and forecast 2024-2029 ($ million)
- Data Table on Aviation - Market size and forecast 2024-2029 ($ million)
- Chart on Aviation - Year-over-year growth 2024-2029 (%)
- Data Table on Aviation - Year-over-year growth 2024-2029 (%)
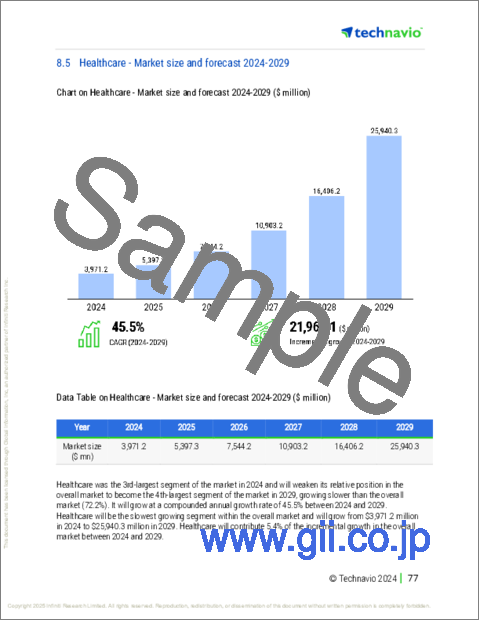
- 8.5 Healthcare - Market size and forecast 2024-2029
- Chart on Healthcare - Market size and forecast 2024-2029 ($ million)
- Data Table on Healthcare - Market size and forecast 2024-2029 ($ million)
- Chart on Healthcare - Year-over-year growth 2024-2029 (%)
- Data Table on Healthcare - Year-over-year growth 2024-2029 (%)
- 8.6 Manufacturing and logistics - Market size and forecast 2024-2029
- Chart on Manufacturing and logistics - Market size and forecast 2024-2029 ($ million)
- Data Table on Manufacturing and logistics - Market size and forecast 2024-2029 ($ million)
- Chart on Manufacturing and logistics - Year-over-year growth 2024-2029 (%)
- Data Table on Manufacturing and logistics - Year-over-year growth 2024-2029 (%)
- 8.7 Government and public sector - Market size and forecast 2024-2029
- Chart on Government and public sector - Market size and forecast 2024-2029 ($ million)
- Data Table on Government and public sector - Market size and forecast 2024-2029 ($ million)
- Chart on Government and public sector - Year-over-year growth 2024-2029 (%)
- Data Table on Government and public sector - Year-over-year growth 2024-2029 (%)
- 8.8 Market opportunity by Application
- Market opportunity by Application ($ million)
- Data Table on Market opportunity by Application ($ million)
9 Market Segmentation by Technology
- 9.1 Market segments
- Chart on Technology - Market share 2024-2029 (%)
- Data Table on Technology - Market share 2024-2029 (%)
- 9.2 Comparison by Technology
- Chart on Comparison by Technology
- Data Table on Comparison by Technology
- 9.3 Ultra wide-band (UWB) systems - Market size and forecast 2024-2029
- Chart on Ultra wide-band (UWB) systems - Market size and forecast 2024-2029 ($ million)
- Data Table on Ultra wide-band (UWB) systems - Market size and forecast 2024-2029 ($ million)
- Chart on Ultra wide-band (UWB) systems - Year-over-year growth 2024-2029 (%)
- Data Table on Ultra wide-band (UWB) systems - Year-over-year growth 2024-2029 (%)
- 9.4 WiFi-based systems - Market size and forecast 2024-2029
- Chart on WiFi-based systems - Market size and forecast 2024-2029 ($ million)
- Data Table on WiFi-based systems - Market size and forecast 2024-2029 ($ million)
- Chart on WiFi-based systems - Year-over-year growth 2024-2029 (%)
- Data Table on WiFi-based systems - Year-over-year growth 2024-2029 (%)
- 9.5 Proximity-based systems - Market size and forecast 2024-2029
- Chart on Proximity-based systems - Market size and forecast 2024-2029 ($ million)
- Data Table on Proximity-based systems - Market size and forecast 2024-2029 ($ million)
- Chart on Proximity-based systems - Year-over-year growth 2024-2029 (%)
- Data Table on Proximity-based systems - Year-over-year growth 2024-2029 (%)
- 9.6 Others - Market size and forecast 2024-2029
- Chart on Others - Market size and forecast 2024-2029 ($ million)
- Data Table on Others - Market size and forecast 2024-2029 ($ million)
- Chart on Others - Year-over-year growth 2024-2029 (%)
- Data Table on Others - Year-over-year growth 2024-2029 (%)
- 9.7 Market opportunity by Technology
- Market opportunity by Technology ($ million)
- Data Table on Market opportunity by Technology ($ million)
10 Market Segmentation by Component
- 10.1 Market segments
- Chart on Component - Market share 2024-2029 (%)
- Data Table on Component - Market share 2024-2029 (%)
- 10.2 Comparison by Component
- Chart on Comparison by Component
- Data Table on Comparison by Component
- 10.3 Hardware - Market size and forecast 2024-2029
- Chart on Hardware - Market size and forecast 2024-2029 ($ million)
- Data Table on Hardware - Market size and forecast 2024-2029 ($ million)
- Chart on Hardware - Year-over-year growth 2024-2029 (%)
- Data Table on Hardware - Year-over-year growth 2024-2029 (%)
- 10.4 Software - Market size and forecast 2024-2029
- Chart on Software - Market size and forecast 2024-2029 ($ million)
- Data Table on Software - Market size and forecast 2024-2029 ($ million)
- Chart on Software - Year-over-year growth 2024-2029 (%)
- Data Table on Software - Year-over-year growth 2024-2029 (%)
- 10.5 Services - Market size and forecast 2024-2029
- Chart on Services - Market size and forecast 2024-2029 ($ million)
- Data Table on Services - Market size and forecast 2024-2029 ($ million)
- Chart on Services - Year-over-year growth 2024-2029 (%)
- Data Table on Services - Year-over-year growth 2024-2029 (%)
- 10.6 Market opportunity by Component
- Market opportunity by Component ($ million)
- Data Table on Market opportunity by Component ($ million)
11 Customer Landscape
- 11.1 Customer landscape overview
- Analysis of price sensitivity, lifecycle, customer purchase basket, adoption rates, and purchase criteria
12 Geographic Landscape
- 12.1 Geographic segmentation
- Chart on Market share By Geographical Landscape 2024-2029 (%)
- Data Table on Market share By Geographical Landscape 2024-2029 (%)
- 12.2 Geographic comparison
- Chart on Geographic comparison
- Data Table on Geographic comparison
- 12.3 North America - Market size and forecast 2024-2029
- Chart on North America - Market size and forecast 2024-2029 ($ million)
- Data Table on North America - Market size and forecast 2024-2029 ($ million)
- Chart on North America - Year-over-year growth 2024-2029 (%)
- Data Table on North America - Year-over-year growth 2024-2029 (%)
- 12.4 APAC - Market size and forecast 2024-2029
- Chart on APAC - Market size and forecast 2024-2029 ($ million)
- Data Table on APAC - Market size and forecast 2024-2029 ($ million)
- Chart on APAC - Year-over-year growth 2024-2029 (%)
- Data Table on APAC - Year-over-year growth 2024-2029 (%)
- 12.5 Europe - Market size and forecast 2024-2029
- Chart on Europe - Market size and forecast 2024-2029 ($ million)
- Data Table on Europe - Market size and forecast 2024-2029 ($ million)
- Chart on Europe - Year-over-year growth 2024-2029 (%)
- Data Table on Europe - Year-over-year growth 2024-2029 (%)
- 12.6 South America - Market size and forecast 2024-2029
- Chart on South America - Market size and forecast 2024-2029 ($ million)
- Data Table on South America - Market size and forecast 2024-2029 ($ million)
- Chart on South America - Year-over-year growth 2024-2029 (%)
- Data Table on South America - Year-over-year growth 2024-2029 (%)
- 12.7 Middle East and Africa - Market size and forecast 2024-2029
- Chart on Middle East and Africa - Market size and forecast 2024-2029 ($ million)
- Data Table on Middle East and Africa - Market size and forecast 2024-2029 ($ million)
- Chart on Middle East and Africa - Year-over-year growth 2024-2029 (%)
- Data Table on Middle East and Africa - Year-over-year growth 2024-2029 (%)
- 12.8 US - Market size and forecast 2024-2029
- Chart on US - Market size and forecast 2024-2029 ($ million)
- Data Table on US - Market size and forecast 2024-2029 ($ million)
- Chart on US - Year-over-year growth 2024-2029 (%)
- Data Table on US - Year-over-year growth 2024-2029 (%)
- 12.9 China - Market size and forecast 2024-2029
- Chart on China - Market size and forecast 2024-2029 ($ million)
- Data Table on China - Market size and forecast 2024-2029 ($ million)
- Chart on China - Year-over-year growth 2024-2029 (%)
- Data Table on China - Year-over-year growth 2024-2029 (%)
- 12.10 Canada - Market size and forecast 2024-2029
- Chart on Canada - Market size and forecast 2024-2029 ($ million)
- Data Table on Canada - Market size and forecast 2024-2029 ($ million)
- Chart on Canada - Year-over-year growth 2024-2029 (%)
- Data Table on Canada - Year-over-year growth 2024-2029 (%)
- 12.11 Germany - Market size and forecast 2024-2029
- Chart on Germany - Market size and forecast 2024-2029 ($ million)
- Data Table on Germany - Market size and forecast 2024-2029 ($ million)
- Chart on Germany - Year-over-year growth 2024-2029 (%)
- Data Table on Germany - Year-over-year growth 2024-2029 (%)
- 12.12 UK - Market size and forecast 2024-2029
- Chart on UK - Market size and forecast 2024-2029 ($ million)
- Data Table on UK - Market size and forecast 2024-2029 ($ million)
- Chart on UK - Year-over-year growth 2024-2029 (%)
- Data Table on UK - Year-over-year growth 2024-2029 (%)
- 12.13 Japan - Market size and forecast 2024-2029
- Chart on Japan - Market size and forecast 2024-2029 ($ million)
- Data Table on Japan - Market size and forecast 2024-2029 ($ million)
- Chart on Japan - Year-over-year growth 2024-2029 (%)
- Data Table on Japan - Year-over-year growth 2024-2029 (%)
- 12.14 India - Market size and forecast 2024-2029
- Chart on India - Market size and forecast 2024-2029 ($ million)
- Data Table on India - Market size and forecast 2024-2029 ($ million)
- Chart on India - Year-over-year growth 2024-2029 (%)
- Data Table on India - Year-over-year growth 2024-2029 (%)
- 12.15 South Korea - Market size and forecast 2024-2029
- Chart on South Korea - Market size and forecast 2024-2029 ($ million)
- Data Table on South Korea - Market size and forecast 2024-2029 ($ million)
- Chart on South Korea - Year-over-year growth 2024-2029 (%)
- Data Table on South Korea - Year-over-year growth 2024-2029 (%)
- 12.16 France - Market size and forecast 2024-2029
- Chart on France - Market size and forecast 2024-2029 ($ million)
- Data Table on France - Market size and forecast 2024-2029 ($ million)
- Chart on France - Year-over-year growth 2024-2029 (%)
- Data Table on France - Year-over-year growth 2024-2029 (%)
- 12.17 Italy - Market size and forecast 2024-2029
- Chart on Italy - Market size and forecast 2024-2029 ($ million)
- Data Table on Italy - Market size and forecast 2024-2029 ($ million)
- Chart on Italy - Year-over-year growth 2024-2029 (%)
- Data Table on Italy - Year-over-year growth 2024-2029 (%)
- 12.18 Market opportunity By Geographical Landscape
- Market opportunity By Geographical Landscape ($ million)
- Data Tables on Market opportunity By Geographical Landscape ($ million)
13 Drivers, Challenges, and Opportunity/Restraints
- 13.1 Market drivers
- 13.2 Market challenges
- 13.3 Impact of drivers and challenges
- Impact of drivers and challenges in 2024 and 2029
- 13.4 Market opportunities/restraints
14 Competitive Landscape
- 14.1 Overview
- 14.2 Competitive Landscape
- Overview on criticality of inputs and factors of differentiation
- 14.3 Landscape disruption
- Overview on factors of disruption
- 14.4 Industry risks
- Impact of key risks on business
15 Competitive Analysis
- 15.1 Companies profiled
- Companies covered
- 15.2 Company ranking index
- Company ranking index
- 15.3 Market positioning of companies
- Matrix on companies position and classification
- 15.4 Alphabet Inc.
- Alphabet Inc. - Overview
- Alphabet Inc. - Business segments
- Alphabet Inc. - Key offerings
- Alphabet Inc. - Segment focus
- SWOT
- 15.5 Apple Inc.
- Apple Inc. - Overview
- Apple Inc. - Business segments
- Apple Inc. - Key news
- Apple Inc. - Key offerings
- Apple Inc. - Segment focus
- SWOT
- 15.6 bluepath AG
- bluepath AG - Overview
- bluepath AG - Product / Service
- bluepath AG - Key offerings
- SWOT
- 15.7 Broadcom Inc.
- Broadcom Inc. - Overview
- Broadcom Inc. - Business segments
- Broadcom Inc. - Key news
- Broadcom Inc. - Key offerings
- Broadcom Inc. - Segment focus
- SWOT
- 15.8 Cisco Systems Inc.
- Cisco Systems Inc. - Overview
- Cisco Systems Inc. - Business segments
- Cisco Systems Inc. - Key news
- Cisco Systems Inc. - Key offerings
- Cisco Systems Inc. - Segment focus
- SWOT
- 15.9 Esri Global Inc.
- Esri Global Inc. - Overview
- Esri Global Inc. - Product / Service
- Esri Global Inc. - Key offerings
- SWOT
- 15.10 GiPStech Srl
- GiPStech Srl - Overview
- GiPStech Srl - Product / Service
- GiPStech Srl - Key offerings
- SWOT
- 15.11 IndoorAtlas Ltd.
- IndoorAtlas Ltd. - Overview
- IndoorAtlas Ltd. - Product / Service
- IndoorAtlas Ltd. - Key offerings
- SWOT
- 15.12 MazeMap AS
- MazeMap AS - Overview
- MazeMap AS - Product / Service
- MazeMap AS - Key offerings
- SWOT
- 15.13 Navigine Corp.
- Navigine Corp. - Overview
- Navigine Corp. - Product / Service
- Navigine Corp. - Key offerings
- SWOT
- 15.14 Nextome Srl
- Nextome Srl - Overview
- Nextome Srl - Product / Service
- Nextome Srl - Key offerings
- SWOT
- 15.15 Pinmicro K K
- Pinmicro K K - Overview
- Pinmicro K K - Product / Service
- Pinmicro K K - Key offerings
- SWOT
- 15.16 Pointr Ltd.
- Pointr Ltd. - Overview
- Pointr Ltd. - Product / Service
- Pointr Ltd. - Key offerings
- SWOT
- 15.17 Sensewhere Ltd.
- Sensewhere Ltd. - Overview
- Sensewhere Ltd. - Product / Service
- Sensewhere Ltd. - Key offerings
- SWOT
- 15.18 Spreo
- Spreo - Overview
- Spreo - Product / Service
- Spreo - Key offerings
- SWOT
16 Appendix
- 16.1 Scope of the report
- 16.2 Inclusions and exclusions checklist
- Inclusions checklist
- Exclusions checklist
- 16.3 Currency conversion rates for US$
- Currency conversion rates for US$
- 16.4 Research methodology
- Research methodology
- 16.5 Data procurement
- Information sources
- 16.6 Data validation
- Data validation
- 16.7 Validation techniques employed for market sizing
- Validation techniques employed for market sizing
- 16.8 Data synthesis
- Data synthesis
- 16.9 360 degree market analysis
- 360 degree market analysis
- 16.10 List of abbreviations
- List of abbreviations

