|
|
市場調査レポート
商品コード
1557589
電動工具アクセサリーの世界市場 2024-2028Global Power Tool Accessories Market 2024-2028 |
||||||

|
|||||||
カスタマイズ可能
|
|||||||


| 電動工具アクセサリーの世界市場 2024-2028 |
|
出版日: 2024年08月02日
発行: TechNavio
ページ情報: 英文 176 Pages
納期: 即納可能
|

全表示
- 概要
- 図表
- 目次
電動工具アクセサリー市場は2023-2028年に5億7,770万米ドル、予測期間中のCAGRは3.84%で成長すると予測されます。
当レポートでは、電動工具アクセサリー市場の全体的な分析、市場規模・予測、動向、成長促進要因、課題、約25のベンダーを網羅したベンダー分析などを掲載しています。
現在の市場シナリオ、最新動向と促進要因、市場環境全体に関する最新分析を提供しています。市場は、乗用車販売の増加、金属加工製品の成長、アジア太平洋地域の新興国における建設活動の増加によって牽引されています。
| 市場範囲 | |
|---|---|
| 基準年 | 2024 |
| 終了年 | 2028 |
| 予測期間 | 2024-2028 |
| 成長モメンタム | 加速 |
| 前年比2024年 | 3.65% |
| CAGR | 3.84% |
| 増分額 | 5億7,770万米ドル |
本調査では、今後数年間の電動工具アクセサリー市場成長を牽引する主要因の1つとして、製造プロセスにおけるモノのインターネット(IoT)統合の増加を挙げています。また、EV販売台数の増加や民間航空機の需要増も市場の大きな需要につながります。
目次
第1章 エグゼクティブサマリー
- 市場概要
第2章 市場情勢
- 市場エコシステム
- 市場の特徴
- バリューチェーン分析
第3章 市場規模の評価
- 市場の定義
- 市場セグメント分析
- 市場規模 2023
- 市場の見通し 2023-2028
第4章 市場規模実績
- 電動工具アクセサリーの世界市場 2018-2022
- エンドユーザー別セグメント分析 2018-2022
- タイプ別セグメント分析 2018-2022
- 地域別セグメント分析 2018-2022
- 国別セグメント分析 2018-2022
第5章 ファイブフォース分析
- ファイブフォースの要約
- 買い手の交渉力
- 供給企業の交渉力
- 新規参入業者の脅威
- 代替品の脅威
- 競争の脅威
- 市況
第6章 市場セグメンテーション:エンドユーザー別
- 市場セグメンテーション
- 比較:エンドユーザー別
- プロ:市場規模と予測 2023-2028
- 消費者:市場規模と予測 2023-2028
- 市場機会:エンドユーザー別
第7章 市場セグメンテーション:タイプ別
- 市場セグメンテーション
- 比較:タイプ別
- ドリルビット:市場規模と予測 2023-2028
- ドライバービット:市場規模と予測 2023-2028
- ルータービット:市場規模と予測 2023-2028
- その他:市場規模と予測 2023-2028
- 市場機会:タイプ別
第8章 顧客情勢
- 顧客情勢の概要
第9章 地域別情勢
- 地域別セグメンテーション
- 地域別比較
- 北米:市場規模と予測 2023-2028
- 欧州:市場規模と予測 2023-2028
- アジア太平洋:市場規模と予測 2023-2028
- 南米:市場規模と予測 2023-2028
- 中東・アフリカ:市場規模と予測 2023-2028
- 米国:市場規模と予測 2023-2028
- 英国:市場規模と予測 2023-2028
- 中国:市場規模と予測 2023-2028
- カナダ:市場規模と予測 2023-2028
- ドイツ:市場規模と予測 2023-2028
- 市場機会:地域情勢別
第10章 促進要因・課題・機会・抑制要因
- 市場促進要因
- 市場の課題
- 促進要因と課題の影響
- 市場の機会・抑制要因
第11章 競合情勢
- 概要
- 競合情勢
- 混乱の状況
- 業界のリスク
第12章 競合分析
- 企業プロファイル
- 企業の市場ポジショニング
- Atlas Copco AB
- Bahco
- Baker Hughes Co.
- Caterpillar Inc.
- Drill King International
- Emerson Electric Co.
- Festool GmbH
- Hilti AG
- Koki Holdings Co. Ltd.
- KYOCERA Corp.
- Makita Corp.
- Robert Bosch GmbH
- Snap on Tools Pvt. Ltd.
- Stanley Black and Decker Inc.
- Techtronic Industries Co. Ltd.
第13章 付録
Exhibits:
- Exhibits1: Executive Summary - Chart on Market Overview
- Exhibits2: Executive Summary - Data Table on Market Overview
- Exhibits3: Executive Summary - Chart on Global Market Characteristics
- Exhibits4: Executive Summary - Chart on Market By Geographical Landscape
- Exhibits5: Executive Summary - Chart on Market Segmentation by End-user
- Exhibits6: Executive Summary - Chart on Market Segmentation by Type
- Exhibits7: Executive Summary - Chart on Incremental Growth
- Exhibits8: Executive Summary - Data Table on Incremental Growth
- Exhibits9: Executive Summary - Chart on Company Market Positioning
- Exhibits10: Parent Market
- Exhibits11: Data Table on - Parent Market
- Exhibits12: Market characteristics analysis
- Exhibits13: Value Chain Analysis
- Exhibits14: Offerings of companies included in the market definition
- Exhibits15: Market segments
- Exhibits16: Chart on Global - Market size and forecast 2023-2028 ($ million)
- Exhibits17: Data Table on Global - Market size and forecast 2023-2028 ($ million)
- Exhibits18: Chart on Global Market: Year-over-year growth 2023-2028 (%)
- Exhibits19: Data Table on Global Market: Year-over-year growth 2023-2028 (%)
- Exhibits20: Historic Market Size - Data Table on Global Power Tool Accessories Market 2018 - 2022 ($ million)
- Exhibits21: Historic Market Size - End-user Segment 2018 - 2022 ($ million)
- Exhibits22: Historic Market Size - Type Segment 2018 - 2022 ($ million)
- Exhibits23: Historic Market Size - Geography Segment 2018 - 2022 ($ million)
- Exhibits24: Historic Market Size - Country Segment 2018 - 2022 ($ million)
- Exhibits25: Five forces analysis - Comparison between 2023 and 2028
- Exhibits26: Bargaining power of buyers - Impact of key factors 2023 and 2028
- Exhibits27: Bargaining power of suppliers - Impact of key factors in 2023 and 2028
- Exhibits28: Threat of new entrants - Impact of key factors in 2023 and 2028
- Exhibits29: Threat of substitutes - Impact of key factors in 2023 and 2028
- Exhibits30: Threat of rivalry - Impact of key factors in 2023 and 2028
- Exhibits31: Chart on Market condition - Five forces 2023 and 2028
- Exhibits32: Chart on End-user - Market share 2023-2028 (%)
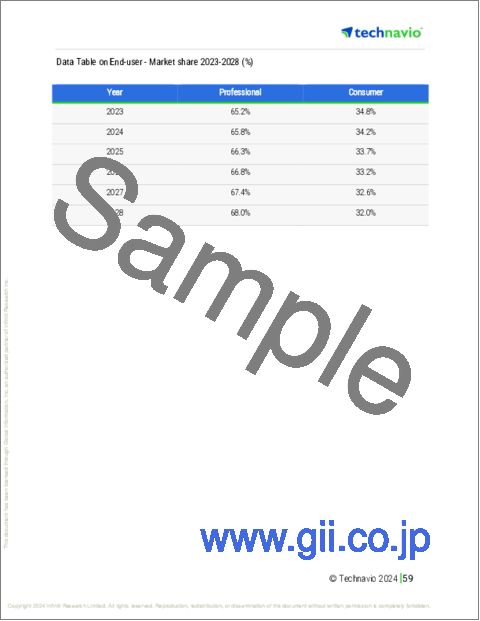
- Exhibits33: Data Table on End-user - Market share 2023-2028 (%)
- Exhibits34: Chart on Comparison by End-user
- Exhibits35: Data Table on Comparison by End-user
- Exhibits36: Chart on Professional - Market size and forecast 2023-2028 ($ million)
- Exhibits37: Data Table on Professional - Market size and forecast 2023-2028 ($ million)
- Exhibits38: Chart on Professional - Year-over-year growth 2023-2028 (%)
- Exhibits39: Data Table on Professional - Year-over-year growth 2023-2028 (%)
- Exhibits40: Chart on Consumer - Market size and forecast 2023-2028 ($ million)
- Exhibits41: Data Table on Consumer - Market size and forecast 2023-2028 ($ million)
- Exhibits42: Chart on Consumer - Year-over-year growth 2023-2028 (%)
- Exhibits43: Data Table on Consumer - Year-over-year growth 2023-2028 (%)
- Exhibits44: Market opportunity by End-user ($ million)
- Exhibits45: Data Table on Market opportunity by End-user ($ million)
- Exhibits46: Chart on Type - Market share 2023-2028 (%)
- Exhibits47: Data Table on Type - Market share 2023-2028 (%)
- Exhibits48: Chart on Comparison by Type
- Exhibits49: Data Table on Comparison by Type
- Exhibits50: Chart on Drill bits - Market size and forecast 2023-2028 ($ million)
- Exhibits51: Data Table on Drill bits - Market size and forecast 2023-2028 ($ million)
- Exhibits52: Chart on Drill bits - Year-over-year growth 2023-2028 (%)
- Exhibits53: Data Table on Drill bits - Year-over-year growth 2023-2028 (%)
- Exhibits54: Chart on Screwdriver bits - Market size and forecast 2023-2028 ($ million)
- Exhibits55: Data Table on Screwdriver bits - Market size and forecast 2023-2028 ($ million)
- Exhibits56: Chart on Screwdriver bits - Year-over-year growth 2023-2028 (%)
- Exhibits57: Data Table on Screwdriver bits - Year-over-year growth 2023-2028 (%)
- Exhibits58: Chart on Router bits - Market size and forecast 2023-2028 ($ million)
- Exhibits59: Data Table on Router bits - Market size and forecast 2023-2028 ($ million)
- Exhibits60: Chart on Router bits - Year-over-year growth 2023-2028 (%)
- Exhibits61: Data Table on Router bits - Year-over-year growth 2023-2028 (%)
- Exhibits62: Chart on Others - Market size and forecast 2023-2028 ($ million)
- Exhibits63: Data Table on Others - Market size and forecast 2023-2028 ($ million)
- Exhibits64: Chart on Others - Year-over-year growth 2023-2028 (%)
- Exhibits65: Data Table on Others - Year-over-year growth 2023-2028 (%)
- Exhibits66: Market opportunity by Type ($ million)
- Exhibits67: Data Table on Market opportunity by Type ($ million)
- Exhibits68: Analysis of price sensitivity, lifecycle, customer purchase basket, adoption rates, and purchase criteria
- Exhibits69: Chart on Market share By Geographical Landscape 2023-2028 (%)
- Exhibits70: Data Table on Market share By Geographical Landscape 2023-2028 (%)
- Exhibits71: Chart on Geographic comparison
- Exhibits72: Data Table on Geographic comparison
- Exhibits73: Chart on North America - Market size and forecast 2023-2028 ($ million)
- Exhibits74: Data Table on North America - Market size and forecast 2023-2028 ($ million)
- Exhibits75: Chart on North America - Year-over-year growth 2023-2028 (%)
- Exhibits76: Data Table on North America - Year-over-year growth 2023-2028 (%)
- Exhibits77: Chart on Europe - Market size and forecast 2023-2028 ($ million)
- Exhibits78: Data Table on Europe - Market size and forecast 2023-2028 ($ million)
- Exhibits79: Chart on Europe - Year-over-year growth 2023-2028 (%)
- Exhibits80: Data Table on Europe - Year-over-year growth 2023-2028 (%)
- Exhibits81: Chart on APAC - Market size and forecast 2023-2028 ($ million)
- Exhibits82: Data Table on APAC - Market size and forecast 2023-2028 ($ million)
- Exhibits83: Chart on APAC - Year-over-year growth 2023-2028 (%)
- Exhibits84: Data Table on APAC - Year-over-year growth 2023-2028 (%)
- Exhibits85: Chart on South America - Market size and forecast 2023-2028 ($ million)
- Exhibits86: Data Table on South America - Market size and forecast 2023-2028 ($ million)
- Exhibits87: Chart on South America - Year-over-year growth 2023-2028 (%)
- Exhibits88: Data Table on South America - Year-over-year growth 2023-2028 (%)
- Exhibits89: Chart on Middle East and Africa - Market size and forecast 2023-2028 ($ million)
- Exhibits90: Data Table on Middle East and Africa - Market size and forecast 2023-2028 ($ million)
- Exhibits91: Chart on Middle East and Africa - Year-over-year growth 2023-2028 (%)
- Exhibits92: Data Table on Middle East and Africa - Year-over-year growth 2023-2028 (%)
- Exhibits93: Chart on US - Market size and forecast 2023-2028 ($ million)
- Exhibits94: Data Table on US - Market size and forecast 2023-2028 ($ million)
- Exhibits95: Chart on US - Year-over-year growth 2023-2028 (%)
- Exhibits96: Data Table on US - Year-over-year growth 2023-2028 (%)
- Exhibits97: Chart on UK - Market size and forecast 2023-2028 ($ million)
- Exhibits98: Data Table on UK - Market size and forecast 2023-2028 ($ million)
- Exhibits99: Chart on UK - Year-over-year growth 2023-2028 (%)
- Exhibits100: Data Table on UK - Year-over-year growth 2023-2028 (%)
- Exhibits101: Chart on China - Market size and forecast 2023-2028 ($ million)
- Exhibits102: Data Table on China - Market size and forecast 2023-2028 ($ million)
- Exhibits103: Chart on China - Year-over-year growth 2023-2028 (%)
- Exhibits104: Data Table on China - Year-over-year growth 2023-2028 (%)
- Exhibits105: Chart on Canada - Market size and forecast 2023-2028 ($ million)
- Exhibits106: Data Table on Canada - Market size and forecast 2023-2028 ($ million)
- Exhibits107: Chart on Canada - Year-over-year growth 2023-2028 (%)
- Exhibits108: Data Table on Canada - Year-over-year growth 2023-2028 (%)
- Exhibits109: Chart on Germany - Market size and forecast 2023-2028 ($ million)
- Exhibits110: Data Table on Germany - Market size and forecast 2023-2028 ($ million)
- Exhibits111: Chart on Germany - Year-over-year growth 2023-2028 (%)
- Exhibits112: Data Table on Germany - Year-over-year growth 2023-2028 (%)
- Exhibits113: Market opportunity By Geographical Landscape ($ million)
- Exhibits114: Data Tables on Market opportunity By Geographical Landscape ($ million)
- Exhibits115: Impact of drivers and challenges in 2023 and 2028
- Exhibits116: Overview on criticality of inputs and factors of differentiation
- Exhibits117: Overview on factors of disruption
- Exhibits118: Impact of key risks on business
- Exhibits119: Companies covered
- Exhibits120: Matrix on companies position and classification
- Exhibits121: Atlas Copco AB - Overview
- Exhibits122: Atlas Copco AB - Business segments
- Exhibits123: Atlas Copco AB - Key news
- Exhibits124: Atlas Copco AB - Key offerings
- Exhibits125: Atlas Copco AB - Segment focus
- Exhibits126: Bahco - Overview
- Exhibits127: Bahco - Product / Service
- Exhibits128: Bahco - Key offerings
- Exhibits129: Baker Hughes Co. - Overview
- Exhibits130: Baker Hughes Co. - Business segments
- Exhibits131: Baker Hughes Co. - Key news
- Exhibits132: Baker Hughes Co. - Key offerings
- Exhibits133: Baker Hughes Co. - Segment focus
- Exhibits134: Caterpillar Inc. - Overview
- Exhibits135: Caterpillar Inc. - Business segments
- Exhibits136: Caterpillar Inc. - Key news
- Exhibits137: Caterpillar Inc. - Key offerings
- Exhibits138: Caterpillar Inc. - Segment focus
- Exhibits139: Drill King International - Overview
- Exhibits140: Drill King International - Product / Service
- Exhibits141: Drill King International - Key offerings
- Exhibits142: Emerson Electric Co. - Overview
- Exhibits143: Emerson Electric Co. - Business segments
- Exhibits144: Emerson Electric Co. - Key news
- Exhibits145: Emerson Electric Co. - Key offerings
- Exhibits146: Emerson Electric Co. - Segment focus
- Exhibits147: Festool GmbH - Overview
- Exhibits148: Festool GmbH - Product / Service
- Exhibits149: Festool GmbH - Key offerings
- Exhibits150: Hilti AG - Overview
- Exhibits151: Hilti AG - Product / Service
- Exhibits152: Hilti AG - Key offerings
- Exhibits153: Koki Holdings Co. Ltd. - Overview
- Exhibits154: Koki Holdings Co. Ltd. - Product / Service
- Exhibits155: Koki Holdings Co. Ltd. - Key news
- Exhibits156: Koki Holdings Co. Ltd. - Key offerings
- Exhibits157: KYOCERA Corp. - Overview
- Exhibits158: KYOCERA Corp. - Business segments
- Exhibits159: KYOCERA Corp. - Key news
- Exhibits160: KYOCERA Corp. - Key offerings
- Exhibits161: KYOCERA Corp. - Segment focus
- Exhibits162: Makita Corp. - Overview
- Exhibits163: Makita Corp. - Business segments
- Exhibits164: Makita Corp. - Key offerings
- Exhibits165: Makita Corp. - Segment focus
- Exhibits166: Robert Bosch GmbH - Overview
- Exhibits167: Robert Bosch GmbH - Product / Service
- Exhibits168: Robert Bosch GmbH - Key news
- Exhibits169: Robert Bosch GmbH - Key offerings
- Exhibits170: Snap on Tools Pvt. Ltd. - Overview
- Exhibits171: Snap on Tools Pvt. Ltd. - Product / Service
- Exhibits172: Snap on Tools Pvt. Ltd. - Key offerings
- Exhibits173: Stanley Black and Decker Inc. - Overview
- Exhibits174: Stanley Black and Decker Inc. - Business segments
- Exhibits175: Stanley Black and Decker Inc. - Key news
- Exhibits176: Stanley Black and Decker Inc. - Key offerings
- Exhibits177: Stanley Black and Decker Inc. - Segment focus
- Exhibits178: Techtronic Industries Co. Ltd. - Overview
- Exhibits179: Techtronic Industries Co. Ltd. - Business segments
- Exhibits180: Techtronic Industries Co. Ltd. - Key news
- Exhibits181: Techtronic Industries Co. Ltd. - Key offerings
- Exhibits182: Techtronic Industries Co. Ltd. - Segment focus
- Exhibits183: Inclusions checklist
- Exhibits184: Exclusions checklist
- Exhibits185: Currency conversion rates for US$
- Exhibits186: Research methodology
- Exhibits187: Information sources
- Exhibits188: Data validation
- Exhibits189: Validation techniques employed for market sizing
- Exhibits190: Data synthesis
- Exhibits191: 360 degree market analysis
- Exhibits192: List of abbreviations
The power tool accessories market is forecasted to grow by USD 577.7 mn during 2023-2028, accelerating at a CAGR of 3.84% during the forecast period. The report on the power tool accessories market provides a holistic analysis, market size and forecast, trends, growth drivers, and challenges, as well as vendor analysis covering around 25 vendors.
The report offers an up-to-date analysis regarding the current market scenario, the latest trends and drivers, and the overall market environment. The market is driven by increase in sales of passenger cars, growth of fabricated metal products, and rise in construction activities in emerging nations in APAC.
Technavio's power tool accessories market is segmented as below:
| Market Scope | |
|---|---|
| Base Year | 2024 |
| End Year | 2028 |
| Series Year | 2024-2028 |
| Growth Momentum | Accelerate |
| YOY 2024 | 3.65% |
| CAGR | 3.84% |
| Incremental Value | $577.7mn |
By End-user
- Professional
- Consumer
By Type
- Drill bits
- Screwdriver bits
- Router bits
- Others
By Geographical Landscape
- North America
- Europe
- APAC
- South America
- Middle East and Africa
This study identifies the increased integration of internet of things (IoT) in manufacturing processes as one of the prime reasons driving the power tool accessories market growth during the next few years. Also, rise in ev sales and increase in demand for commercial aircraft will lead to sizable demand in the market.
The report on the power tool accessories market covers the following areas:
- Power tool accessories market sizing
- Power tool accessories market forecast
- Power tool accessories market industry analysis
The robust vendor analysis is designed to help clients improve their market position, and in line with this, this report provides a detailed analysis of several leading power tool accessories market vendors that include ANDREAS STIHL AG and Co. KG, Atlas Copco AB, Bahco, Baker Hughes Co., Caterpillar Inc., Drill King International, Emerson Electric Co., Festool GmbH, Halliburton Co., Hilti AG, KKR and Co. Inc., Koki Holdings Co. Ltd., KYOCERA Corp., Makita Corp., Robert Bosch GmbH, Sandvik AB, Snap on Tools Pvt. Ltd., Stanley Black and Decker Inc., Techtronic Industries Co. Ltd., and Tools4Trade. Also, the power tool accessories market analysis report includes information on upcoming trends and challenges that will influence market growth. This is to help companies strategize and leverage all forthcoming growth opportunities.
The study was conducted using an objective combination of primary and secondary information including inputs from key participants in the industry. The report contains a comprehensive market and vendor landscape in addition to an analysis of the key vendors.
The publisher presents a detailed picture of the market by the way of study, synthesis, and summation of data from multiple sources by an analysis of key parameters such as profit, pricing, competition, and promotions. It presents various market facets by identifying the key industry influencers. The data presented is comprehensive, reliable, and a result of extensive research - both primary and secondary. The market research reports provide a complete competitive landscape and an in-depth vendor selection methodology and analysis using qualitative and quantitative research to forecast the accurate market growth.
Table of Contents
1 Executive Summary
- 1.1 Market overview
- Executive Summary - Chart on Market Overview
- Executive Summary - Data Table on Market Overview
- Executive Summary - Chart on Global Market Characteristics
- Executive Summary - Chart on Market By Geographical Landscape
- Executive Summary - Chart on Market Segmentation by End-user
- Executive Summary - Chart on Market Segmentation by Type
- Executive Summary - Chart on Incremental Growth
- Executive Summary - Data Table on Incremental Growth
- Executive Summary - Chart on Company Market Positioning
2 Market Landscape
- 2.1 Market ecosystem
- Parent Market
- Data Table on - Parent Market
- 2.2 Market characteristics
- Market characteristics analysis
- 2.3 Value chain analysis
- Value Chain Analysis
3 Market Sizing
- 3.1 Market definition
- Offerings of companies included in the market definition
- 3.2 Market segment analysis
- Market segments
- 3.3 Market size 2023
- 3.4 Market outlook: Forecast for 2023-2028
- Chart on Global - Market size and forecast 2023-2028 ($ million)
- Data Table on Global - Market size and forecast 2023-2028 ($ million)
- Chart on Global Market: Year-over-year growth 2023-2028 (%)
- Data Table on Global Market: Year-over-year growth 2023-2028 (%)
4 Historic Market Size
- 4.1 Global Power Tool Accessories Market 2018 - 2022
- Historic Market Size - Data Table on Global Power Tool Accessories Market 2018 - 2022 ($ million)
- 4.2 End-user segment analysis 2018 - 2022
- Historic Market Size - End-user Segment 2018 - 2022 ($ million)
- 4.3 Type segment analysis 2018 - 2022
- Historic Market Size - Type Segment 2018 - 2022 ($ million)
- 4.4 Geography segment analysis 2018 - 2022
- Historic Market Size - Geography Segment 2018 - 2022 ($ million)
- 4.5 Country segment analysis 2018 - 2022
- Historic Market Size - Country Segment 2018 - 2022 ($ million)
5 Five Forces Analysis
- 5.1 Five forces summary
- Five forces analysis - Comparison between 2023 and 2028
- 5.2 Bargaining power of buyers
- Bargaining power of buyers - Impact of key factors 2023 and 2028
- 5.3 Bargaining power of suppliers
- Bargaining power of suppliers - Impact of key factors in 2023 and 2028
- 5.4 Threat of new entrants
- Threat of new entrants - Impact of key factors in 2023 and 2028
- 5.5 Threat of substitutes
- Threat of substitutes - Impact of key factors in 2023 and 2028
- 5.6 Threat of rivalry
- Threat of rivalry - Impact of key factors in 2023 and 2028
- 5.7 Market condition
- Chart on Market condition - Five forces 2023 and 2028
6 Market Segmentation by End-user
- 6.1 Market segments
- Chart on End-user - Market share 2023-2028 (%)
- Data Table on End-user - Market share 2023-2028 (%)
- 6.2 Comparison by End-user
- Chart on Comparison by End-user
- Data Table on Comparison by End-user
- 6.3 Professional - Market size and forecast 2023-2028
- Chart on Professional - Market size and forecast 2023-2028 ($ million)
- Data Table on Professional - Market size and forecast 2023-2028 ($ million)
- Chart on Professional - Year-over-year growth 2023-2028 (%)
- Data Table on Professional - Year-over-year growth 2023-2028 (%)
- 6.4 Consumer - Market size and forecast 2023-2028
- Chart on Consumer - Market size and forecast 2023-2028 ($ million)
- Data Table on Consumer - Market size and forecast 2023-2028 ($ million)
- Chart on Consumer - Year-over-year growth 2023-2028 (%)
- Data Table on Consumer - Year-over-year growth 2023-2028 (%)
- 6.5 Market opportunity by End-user
- Market opportunity by End-user ($ million)
- Data Table on Market opportunity by End-user ($ million)
7 Market Segmentation by Type
- 7.1 Market segments
- Chart on Type - Market share 2023-2028 (%)
- Data Table on Type - Market share 2023-2028 (%)
- 7.2 Comparison by Type
- Chart on Comparison by Type
- Data Table on Comparison by Type
- 7.3 Drill bits - Market size and forecast 2023-2028
- Chart on Drill bits - Market size and forecast 2023-2028 ($ million)
- Data Table on Drill bits - Market size and forecast 2023-2028 ($ million)
- Chart on Drill bits - Year-over-year growth 2023-2028 (%)
- Data Table on Drill bits - Year-over-year growth 2023-2028 (%)
- 7.4 Screwdriver bits - Market size and forecast 2023-2028
- Chart on Screwdriver bits - Market size and forecast 2023-2028 ($ million)
- Data Table on Screwdriver bits - Market size and forecast 2023-2028 ($ million)
- Chart on Screwdriver bits - Year-over-year growth 2023-2028 (%)
- Data Table on Screwdriver bits - Year-over-year growth 2023-2028 (%)
- 7.5 Router bits - Market size and forecast 2023-2028
- Chart on Router bits - Market size and forecast 2023-2028 ($ million)
- Data Table on Router bits - Market size and forecast 2023-2028 ($ million)
- Chart on Router bits - Year-over-year growth 2023-2028 (%)
- Data Table on Router bits - Year-over-year growth 2023-2028 (%)
- 7.6 Others - Market size and forecast 2023-2028
- Chart on Others - Market size and forecast 2023-2028 ($ million)
- Data Table on Others - Market size and forecast 2023-2028 ($ million)
- Chart on Others - Year-over-year growth 2023-2028 (%)
- Data Table on Others - Year-over-year growth 2023-2028 (%)
- 7.7 Market opportunity by Type
- Market opportunity by Type ($ million)
- Data Table on Market opportunity by Type ($ million)
8 Customer Landscape
- 8.1 Customer landscape overview
- Analysis of price sensitivity, lifecycle, customer purchase basket, adoption rates, and purchase criteria
9 Geographic Landscape
- 9.1 Geographic segmentation
- Chart on Market share By Geographical Landscape 2023-2028 (%)
- Data Table on Market share By Geographical Landscape 2023-2028 (%)
- 9.2 Geographic comparison
- Chart on Geographic comparison
- Data Table on Geographic comparison
- 9.3 North America - Market size and forecast 2023-2028
- Chart on North America - Market size and forecast 2023-2028 ($ million)
- Data Table on North America - Market size and forecast 2023-2028 ($ million)
- Chart on North America - Year-over-year growth 2023-2028 (%)
- Data Table on North America - Year-over-year growth 2023-2028 (%)
- 9.4 Europe - Market size and forecast 2023-2028
- Chart on Europe - Market size and forecast 2023-2028 ($ million)
- Data Table on Europe - Market size and forecast 2023-2028 ($ million)
- Chart on Europe - Year-over-year growth 2023-2028 (%)
- Data Table on Europe - Year-over-year growth 2023-2028 (%)
- 9.5 APAC - Market size and forecast 2023-2028
- Chart on APAC - Market size and forecast 2023-2028 ($ million)
- Data Table on APAC - Market size and forecast 2023-2028 ($ million)
- Chart on APAC - Year-over-year growth 2023-2028 (%)
- Data Table on APAC - Year-over-year growth 2023-2028 (%)
- 9.6 South America - Market size and forecast 2023-2028
- Chart on South America - Market size and forecast 2023-2028 ($ million)
- Data Table on South America - Market size and forecast 2023-2028 ($ million)
- Chart on South America - Year-over-year growth 2023-2028 (%)
- Data Table on South America - Year-over-year growth 2023-2028 (%)
- 9.7 Middle East and Africa - Market size and forecast 2023-2028
- Chart on Middle East and Africa - Market size and forecast 2023-2028 ($ million)
- Data Table on Middle East and Africa - Market size and forecast 2023-2028 ($ million)
- Chart on Middle East and Africa - Year-over-year growth 2023-2028 (%)
- Data Table on Middle East and Africa - Year-over-year growth 2023-2028 (%)
- 9.8 US - Market size and forecast 2023-2028
- Chart on US - Market size and forecast 2023-2028 ($ million)
- Data Table on US - Market size and forecast 2023-2028 ($ million)
- Chart on US - Year-over-year growth 2023-2028 (%)
- Data Table on US - Year-over-year growth 2023-2028 (%)
- 9.9 UK - Market size and forecast 2023-2028
- Chart on UK - Market size and forecast 2023-2028 ($ million)
- Data Table on UK - Market size and forecast 2023-2028 ($ million)
- Chart on UK - Year-over-year growth 2023-2028 (%)
- Data Table on UK - Year-over-year growth 2023-2028 (%)
- 9.10 China - Market size and forecast 2023-2028
- Chart on China - Market size and forecast 2023-2028 ($ million)
- Data Table on China - Market size and forecast 2023-2028 ($ million)
- Chart on China - Year-over-year growth 2023-2028 (%)
- Data Table on China - Year-over-year growth 2023-2028 (%)
- 9.11 Canada - Market size and forecast 2023-2028
- Chart on Canada - Market size and forecast 2023-2028 ($ million)
- Data Table on Canada - Market size and forecast 2023-2028 ($ million)
- Chart on Canada - Year-over-year growth 2023-2028 (%)
- Data Table on Canada - Year-over-year growth 2023-2028 (%)
- 9.12 Germany - Market size and forecast 2023-2028
- Chart on Germany - Market size and forecast 2023-2028 ($ million)
- Data Table on Germany - Market size and forecast 2023-2028 ($ million)
- Chart on Germany - Year-over-year growth 2023-2028 (%)
- Data Table on Germany - Year-over-year growth 2023-2028 (%)
- 9.13 Market opportunity By Geographical Landscape
- Market opportunity By Geographical Landscape ($ million)
- Data Tables on Market opportunity By Geographical Landscape ($ million)
10 Drivers, Challenges, and Opportunity/Restraints
- 10.1 Market drivers
- 10.2 Market challenges
- 10.3 Impact of drivers and challenges
- Impact of drivers and challenges in 2023 and 2028
- 10.4 Market opportunities/restraints
11 Competitive Landscape
- 11.1 Overview
- 11.2 Competitive Landscape
- Overview on criticality of inputs and factors of differentiation
- 11.3 Landscape disruption
- Overview on factors of disruption
- 11.4 Industry risks
- Impact of key risks on business
12 Competitive Analysis
- 12.1 Companies profiled
- Companies covered
- 12.2 Market positioning of companies
- Matrix on companies position and classification
- 12.3 Atlas Copco AB
- Atlas Copco AB - Overview
- Atlas Copco AB - Business segments
- Atlas Copco AB - Key news
- Atlas Copco AB - Key offerings
- Atlas Copco AB - Segment focus
- 12.4 Bahco
- Bahco - Overview
- Bahco - Product / Service
- Bahco - Key offerings
- 12.5 Baker Hughes Co.
- Baker Hughes Co. - Overview
- Baker Hughes Co. - Business segments
- Baker Hughes Co. - Key news
- Baker Hughes Co. - Key offerings
- Baker Hughes Co. - Segment focus
- 12.6 Caterpillar Inc.
- Caterpillar Inc. - Overview
- Caterpillar Inc. - Business segments
- Caterpillar Inc. - Key news
- Caterpillar Inc. - Key offerings
- Caterpillar Inc. - Segment focus
- 12.7 Drill King International
- Drill King International - Overview
- Drill King International - Product / Service
- Drill King International - Key offerings
- 12.8 Emerson Electric Co.
- Emerson Electric Co. - Overview
- Emerson Electric Co. - Business segments
- Emerson Electric Co. - Key news
- Emerson Electric Co. - Key offerings
- Emerson Electric Co. - Segment focus
- 12.9 Festool GmbH
- Festool GmbH - Overview
- Festool GmbH - Product / Service
- Festool GmbH - Key offerings
- 12.10 Hilti AG
- Hilti AG - Overview
- Hilti AG - Product / Service
- Hilti AG - Key offerings
- 12.11 Koki Holdings Co. Ltd.
- Koki Holdings Co. Ltd. - Overview
- Koki Holdings Co. Ltd. - Product / Service
- Koki Holdings Co. Ltd. - Key news
- Koki Holdings Co. Ltd. - Key offerings
- 12.12 KYOCERA Corp.
- KYOCERA Corp. - Overview
- KYOCERA Corp. - Business segments
- KYOCERA Corp. - Key news
- KYOCERA Corp. - Key offerings
- KYOCERA Corp. - Segment focus
- 12.13 Makita Corp.
- Makita Corp. - Overview
- Makita Corp. - Business segments
- Makita Corp. - Key offerings
- Makita Corp. - Segment focus
- 12.14 Robert Bosch GmbH
- Robert Bosch GmbH - Overview
- Robert Bosch GmbH - Product / Service
- Robert Bosch GmbH - Key news
- Robert Bosch GmbH - Key offerings
- 12.15 Snap on Tools Pvt. Ltd.
- Snap on Tools Pvt. Ltd. - Overview
- Snap on Tools Pvt. Ltd. - Product / Service
- Snap on Tools Pvt. Ltd. - Key offerings
- 12.16 Stanley Black and Decker Inc.
- Stanley Black and Decker Inc. - Overview
- Stanley Black and Decker Inc. - Business segments
- Stanley Black and Decker Inc. - Key news
- Stanley Black and Decker Inc. - Key offerings
- Stanley Black and Decker Inc. - Segment focus
- 12.17 Techtronic Industries Co. Ltd.
- Techtronic Industries Co. Ltd. - Overview
- Techtronic Industries Co. Ltd. - Business segments
- Techtronic Industries Co. Ltd. - Key news
- Techtronic Industries Co. Ltd. - Key offerings
- Techtronic Industries Co. Ltd. - Segment focus
13 Appendix
- 13.1 Scope of the report
- 13.2 Inclusions and exclusions checklist
- Inclusions checklist
- Exclusions checklist
- 13.3 Currency conversion rates for US$
- Currency conversion rates for US$
- 13.4 Research methodology
- Research methodology
- 13.5 Data procurement
- Information sources
- 13.6 Data validation
- Data validation
- 13.7 Validation techniques employed for market sizing
- Validation techniques employed for market sizing
- 13.8 Data synthesis
- Data synthesis
- 13.9 360 degree market analysis
- 360 degree market analysis
- 13.10 List of abbreviations
- List of abbreviations

