|
|
市場調査レポート
商品コード
1583131
交通信号認識の世界市場 2024年~2028年Global Traffic Signal Recognition Market 2024-2028 |
||||||
|
|||||||
カスタマイズ可能
|
|||||||


| 交通信号認識の世界市場 2024年~2028年 |
|
出版日: 2024年08月15日
発行: TechNavio
ページ情報: 英文 163 Pages
納期: 即納可能
|

全表示
- 概要
- 図表
- 目次
交通信号認識市場は2023年~2028年に13億7,580万米ドル、予測期間中のCAGRは4.75%で成長すると予測されます。
当レポートでは、交通信号認識市場の全体的な分析、市場規模・予測、動向、成長促進要因、課題、約25のベンダーを網羅したベンダー分析などを掲載しています。
現在の市場シナリオ、最新動向と促進要因、市場環境全体に関する最新分析を提供しています。急速な都市化と交通安全基準の重視の高まり、リアルタイム情報システムに対するニーズの高まり、交通インフラ整備のための政府の取り組みなどが市場を牽引しています。
| 市場範囲 | |
|---|---|
| 基準年 | 2024 |
| 終了年 | 2028 |
| 予測期間 | 2024-2028 |
| 成長モメンタム | 加速 |
| 前年比2024年 | 4.07% |
| CAGR | 4.75% |
| 増分額 | 13億7,580万米ドル |
本調査では、交通流規制の改善が今後数年間の交通信号認識市場成長を牽引する主要因の1つであるとしています。また、新製品の発売や道路交通インフラ投資の拡大は、市場の大きな需要につながります。
目次
第1章 エグゼクティブサマリー
- 市場概要
第2章 市場情勢
- 市場エコシステム
- 市場の特徴
- バリューチェーン分析
第3章 市場規模の評価
- 市場の定義
- 市場セグメント分析
- 市場規模 2023年
- 市場の見通し 2023年~2028年
第4章 市場規模実績
- 交通信号認識の世界市場 2018年~2022年
- 車両タイプ別セグメント分析 2018年~2022年
- タイプ別セグメント分析 2018年~2022年
- 地域別セグメント分析 2018年~2022年
- 国別セグメント分析 2018年~2022年
第5章 ファイブフォース分析
- ファイブフォースの要約
- 買い手の交渉力
- 供給企業の交渉力
- 新規参入業者の脅威
- 代替品の脅威
- 競争の脅威
- 市況
第6章 車両タイプ別の市場セグメンテーション
- 市場セグメンテーション
- 比較:車両タイプ別
- 乗用車:市場規模と予測 2023年~2028年
- 商用車:市場規模と予測 2023年~2028年
- 車両タイプ別の市場機会
第7章 タイプ別市場セグメンテーション
- 市場セグメンテーション
- 比較:タイプ別
- 色による検出:市場規模と予測 2023年~2028年
- 形状ベースの検出:市場規模と予測 2023年~2028年
- 特徴ベースの検出:市場規模と予測 2023年~2028年
- タイプ別の市場機会
第8章 顧客情勢
- 顧客情勢の概要
第9章 地域別情勢
- 地域別セグメンテーション
- 地域別比較
- 北米:市場規模と予測 2023年~2028年
- 欧州:市場規模と予測 2023年~2028年
- アジア太平洋:市場規模と予測 2023年~2028年
- 南米:市場規模と予測 2023年~2028年
- 中東・アフリカ:市場規模と予測 2023年~2028年
- 米国:市場規模と予測 2023年~2028年
- ドイツ:市場規模と予測 2023年~2028年
- 英国:市場規模と予測 2023年~2028年
- 日本:市場規模と予測 2023年~2028年
- 中国:市場規模と予測 2023年~2028年
- 地域情勢別市場機会
第10章 促進要因・課題・機会・抑制要因
- 市場促進要因
- 市場の課題
- 促進要因と課題の影響
- 市場の機会・抑制要因
第11章 競合情勢
- 概要
- 競合情勢
- 混乱の状況
- 業界のリスク
第12章 競合分析
- 企業プロファイル
- 企業の市場ポジショニング
- Continental AG
- D G Controls Ltd.
- DENSO Corp.
- dSPACE GmbH
- Elektrobit Automotive GmbH
- European Safety Systems Ltd.
- Ford Motor Co.
- HELLA Aglaia Mobile Vision GmbH
- Magna International Inc.
- Mercedes Benz Group AG
- Mobileye Technologies Ltd.
- Robert Bosch GmbH
- SKODA AUTO AS
- Volkswagen AG
- ZF Friedrichshafen AG
第13章 付録
Exhibits:
- Exhibits1: Executive Summary - Chart on Market Overview
- Exhibits2: Executive Summary - Data Table on Market Overview
- Exhibits3: Executive Summary - Chart on Global Market Characteristics
- Exhibits4: Executive Summary - Chart on Market By Geographical Landscape
- Exhibits5: Executive Summary - Chart on Market Segmentation by Vehicle Type
- Exhibits6: Executive Summary - Chart on Market Segmentation by Type
- Exhibits7: Executive Summary - Chart on Incremental Growth
- Exhibits8: Executive Summary - Data Table on Incremental Growth
- Exhibits9: Executive Summary - Chart on Company Market Positioning
- Exhibits10: Parent Market
- Exhibits11: Data Table on - Parent Market
- Exhibits12: Market characteristics analysis
- Exhibits13: Value Chain Analysis
- Exhibits14: Offerings of companies included in the market definition
- Exhibits15: Market segments
- Exhibits16: Chart on Global - Market size and forecast 2023-2028 ($ million)
- Exhibits17: Data Table on Global - Market size and forecast 2023-2028 ($ million)
- Exhibits18: Chart on Global Market: Year-over-year growth 2023-2028 (%)
- Exhibits19: Data Table on Global Market: Year-over-year growth 2023-2028 (%)
- Exhibits20: Historic Market Size - Data Table on Global Traffic Signal Recognition Market 2018 - 2022 ($ million)
- Exhibits21: Historic Market Size - Vehicle Type Segment 2018 - 2022 ($ million)
- Exhibits22: Historic Market Size - Type Segment 2018 - 2022 ($ million)
- Exhibits23: Historic Market Size - Geography Segment 2018 - 2022 ($ million)
- Exhibits24: Historic Market Size - Country Segment 2018 - 2022 ($ million)
- Exhibits25: Five forces analysis - Comparison between 2023 and 2028
- Exhibits26: Bargaining power of buyers - Impact of key factors 2023 and 2028
- Exhibits27: Bargaining power of suppliers - Impact of key factors in 2023 and 2028
- Exhibits28: Threat of new entrants - Impact of key factors in 2023 and 2028
- Exhibits29: Threat of substitutes - Impact of key factors in 2023 and 2028
- Exhibits30: Threat of rivalry - Impact of key factors in 2023 and 2028
- Exhibits31: Chart on Market condition - Five forces 2023 and 2028
- Exhibits32: Chart on Vehicle Type - Market share 2023-2028 (%)
- Exhibits33: Data Table on Vehicle Type - Market share 2023-2028 (%)
- Exhibits34: Chart on Comparison by Vehicle Type
- Exhibits35: Data Table on Comparison by Vehicle Type
- Exhibits36: Chart on Passenger vehicle - Market size and forecast 2023-2028 ($ million)
- Exhibits37: Data Table on Passenger vehicle - Market size and forecast 2023-2028 ($ million)
- Exhibits38: Chart on Passenger vehicle - Year-over-year growth 2023-2028 (%)
- Exhibits39: Data Table on Passenger vehicle - Year-over-year growth 2023-2028 (%)
- Exhibits40: Chart on Commercial vehicle - Market size and forecast 2023-2028 ($ million)
- Exhibits41: Data Table on Commercial vehicle - Market size and forecast 2023-2028 ($ million)
- Exhibits42: Chart on Commercial vehicle - Year-over-year growth 2023-2028 (%)
- Exhibits43: Data Table on Commercial vehicle - Year-over-year growth 2023-2028 (%)
- Exhibits44: Market opportunity by Vehicle Type ($ million)
- Exhibits45: Data Table on Market opportunity by Vehicle Type ($ million)
- Exhibits46: Chart on Type - Market share 2023-2028 (%)
- Exhibits47: Data Table on Type - Market share 2023-2028 (%)
- Exhibits48: Chart on Comparison by Type
- Exhibits49: Data Table on Comparison by Type
- Exhibits50: Chart on Color-based detection - Market size and forecast 2023-2028 ($ million)
- Exhibits51: Data Table on Color-based detection - Market size and forecast 2023-2028 ($ million)
- Exhibits52: Chart on Color-based detection - Year-over-year growth 2023-2028 (%)
- Exhibits53: Data Table on Color-based detection - Year-over-year growth 2023-2028 (%)
- Exhibits54: Chart on Shape-based detection - Market size and forecast 2023-2028 ($ million)
- Exhibits55: Data Table on Shape-based detection - Market size and forecast 2023-2028 ($ million)
- Exhibits56: Chart on Shape-based detection - Year-over-year growth 2023-2028 (%)
- Exhibits57: Data Table on Shape-based detection - Year-over-year growth 2023-2028 (%)
- Exhibits58: Chart on Feature-based detection - Market size and forecast 2023-2028 ($ million)
- Exhibits59: Data Table on Feature-based detection - Market size and forecast 2023-2028 ($ million)
- Exhibits60: Chart on Feature-based detection - Year-over-year growth 2023-2028 (%)
- Exhibits61: Data Table on Feature-based detection - Year-over-year growth 2023-2028 (%)
- Exhibits62: Market opportunity by Type ($ million)
- Exhibits63: Data Table on Market opportunity by Type ($ million)
- Exhibits64: Analysis of price sensitivity, lifecycle, customer purchase basket, adoption rates, and purchase criteria
- Exhibits65: Chart on Market share By Geographical Landscape 2023-2028 (%)
- Exhibits66: Data Table on Market share By Geographical Landscape 2023-2028 (%)
- Exhibits67: Chart on Geographic comparison
- Exhibits68: Data Table on Geographic comparison
- Exhibits69: Chart on North America - Market size and forecast 2023-2028 ($ million)
- Exhibits70: Data Table on North America - Market size and forecast 2023-2028 ($ million)
- Exhibits71: Chart on North America - Year-over-year growth 2023-2028 (%)
- Exhibits72: Data Table on North America - Year-over-year growth 2023-2028 (%)
- Exhibits73: Chart on Europe - Market size and forecast 2023-2028 ($ million)
- Exhibits74: Data Table on Europe - Market size and forecast 2023-2028 ($ million)
- Exhibits75: Chart on Europe - Year-over-year growth 2023-2028 (%)
- Exhibits76: Data Table on Europe - Year-over-year growth 2023-2028 (%)
- Exhibits77: Chart on APAC - Market size and forecast 2023-2028 ($ million)
- Exhibits78: Data Table on APAC - Market size and forecast 2023-2028 ($ million)
- Exhibits79: Chart on APAC - Year-over-year growth 2023-2028 (%)
- Exhibits80: Data Table on APAC - Year-over-year growth 2023-2028 (%)
- Exhibits81: Chart on South America - Market size and forecast 2023-2028 ($ million)
- Exhibits82: Data Table on South America - Market size and forecast 2023-2028 ($ million)
- Exhibits83: Chart on South America - Year-over-year growth 2023-2028 (%)
- Exhibits84: Data Table on South America - Year-over-year growth 2023-2028 (%)
- Exhibits85: Chart on Middle East and Africa - Market size and forecast 2023-2028 ($ million)
- Exhibits86: Data Table on Middle East and Africa - Market size and forecast 2023-2028 ($ million)
- Exhibits87: Chart on Middle East and Africa - Year-over-year growth 2023-2028 (%)
- Exhibits88: Data Table on Middle East and Africa - Year-over-year growth 2023-2028 (%)
- Exhibits89: Chart on US - Market size and forecast 2023-2028 ($ million)
- Exhibits90: Data Table on US - Market size and forecast 2023-2028 ($ million)
- Exhibits91: Chart on US - Year-over-year growth 2023-2028 (%)
- Exhibits92: Data Table on US - Year-over-year growth 2023-2028 (%)
- Exhibits93: Chart on Germany - Market size and forecast 2023-2028 ($ million)
- Exhibits94: Data Table on Germany - Market size and forecast 2023-2028 ($ million)
- Exhibits95: Chart on Germany - Year-over-year growth 2023-2028 (%)
- Exhibits96: Data Table on Germany - Year-over-year growth 2023-2028 (%)
- Exhibits97: Chart on UK - Market size and forecast 2023-2028 ($ million)
- Exhibits98: Data Table on UK - Market size and forecast 2023-2028 ($ million)
- Exhibits99: Chart on UK - Year-over-year growth 2023-2028 (%)
- Exhibits100: Data Table on UK - Year-over-year growth 2023-2028 (%)
- Exhibits101: Chart on Japan - Market size and forecast 2023-2028 ($ million)
- Exhibits102: Data Table on Japan - Market size and forecast 2023-2028 ($ million)
- Exhibits103: Chart on Japan - Year-over-year growth 2023-2028 (%)
- Exhibits104: Data Table on Japan - Year-over-year growth 2023-2028 (%)
- Exhibits105: Chart on China - Market size and forecast 2023-2028 ($ million)
- Exhibits106: Data Table on China - Market size and forecast 2023-2028 ($ million)
- Exhibits107: Chart on China - Year-over-year growth 2023-2028 (%)
- Exhibits108: Data Table on China - Year-over-year growth 2023-2028 (%)
- Exhibits109: Market opportunity By Geographical Landscape ($ million)
- Exhibits110: Data Tables on Market opportunity By Geographical Landscape ($ million)
- Exhibits111: Impact of drivers and challenges in 2023 and 2028
- Exhibits112: Overview on criticality of inputs and factors of differentiation
- Exhibits113: Overview on factors of disruption
- Exhibits114: Impact of key risks on business
- Exhibits115: Companies covered
- Exhibits116: Matrix on companies position and classification
- Exhibits117: Continental AG - Overview
- Exhibits118: Continental AG - Business segments
- Exhibits119: Continental AG - Key news
- Exhibits120: Continental AG - Key offerings
- Exhibits121: Continental AG - Segment focus
- Exhibits122: D G Controls Ltd. - Overview
- Exhibits123: D G Controls Ltd. - Product / Service
- Exhibits124: D G Controls Ltd. - Key offerings
- Exhibits125: DENSO Corp. - Overview
- Exhibits126: DENSO Corp. - Business segments
- Exhibits127: DENSO Corp. - Key news
- Exhibits128: DENSO Corp. - Key offerings
- Exhibits129: DENSO Corp. - Segment focus
- Exhibits130: dSPACE GmbH - Overview
- Exhibits131: dSPACE GmbH - Product / Service
- Exhibits132: dSPACE GmbH - Key offerings
- Exhibits133: Elektrobit Automotive GmbH - Overview
- Exhibits134: Elektrobit Automotive GmbH - Product / Service
- Exhibits135: Elektrobit Automotive GmbH - Key offerings
- Exhibits136: European Safety Systems Ltd. - Overview
- Exhibits137: European Safety Systems Ltd. - Product / Service
- Exhibits138: European Safety Systems Ltd. - Key offerings
- Exhibits139: Ford Motor Co. - Overview
- Exhibits140: Ford Motor Co. - Business segments
- Exhibits141: Ford Motor Co. - Key news
- Exhibits142: Ford Motor Co. - Key offerings
- Exhibits143: Ford Motor Co. - Segment focus
- Exhibits144: HELLA Aglaia Mobile Vision GmbH - Overview
- Exhibits145: HELLA Aglaia Mobile Vision GmbH - Product / Service
- Exhibits146: HELLA Aglaia Mobile Vision GmbH - Key offerings
- Exhibits147: Magna International Inc. - Overview
- Exhibits148: Magna International Inc. - Business segments
- Exhibits149: Magna International Inc. - Key news
- Exhibits150: Magna International Inc. - Key offerings
- Exhibits151: Magna International Inc. - Segment focus
- Exhibits152: Mercedes Benz Group AG - Overview
- Exhibits153: Mercedes Benz Group AG - Business segments
- Exhibits154: Mercedes Benz Group AG - Key news
- Exhibits155: Mercedes Benz Group AG - Key offerings
- Exhibits156: Mercedes Benz Group AG - Segment focus
- Exhibits157: Mobileye Technologies Ltd. - Overview
- Exhibits158: Mobileye Technologies Ltd. - Product / Service
- Exhibits159: Mobileye Technologies Ltd. - Key offerings
- Exhibits160: Robert Bosch GmbH - Overview
- Exhibits161: Robert Bosch GmbH - Product / Service
- Exhibits162: Robert Bosch GmbH - Key news
- Exhibits163: Robert Bosch GmbH - Key offerings
- Exhibits164: SKODA AUTO AS - Overview
- Exhibits165: SKODA AUTO AS - Product / Service
- Exhibits166: SKODA AUTO AS - Key offerings
- Exhibits167: Volkswagen AG - Overview
- Exhibits168: Volkswagen AG - Business segments
- Exhibits169: Volkswagen AG - Key news
- Exhibits170: Volkswagen AG - Key offerings
- Exhibits171: Volkswagen AG - Segment focus
- Exhibits172: ZF Friedrichshafen AG - Overview
- Exhibits173: ZF Friedrichshafen AG - Business segments
- Exhibits174: ZF Friedrichshafen AG - Key news
- Exhibits175: ZF Friedrichshafen AG - Key offerings
- Exhibits176: ZF Friedrichshafen AG - Segment focus
- Exhibits177: Inclusions checklist
- Exhibits178: Exclusions checklist
- Exhibits179: Currency conversion rates for US$
- Exhibits180: Research methodology
- Exhibits181: Information sources
- Exhibits182: Data validation
- Exhibits183: Validation techniques employed for market sizing
- Exhibits184: Data synthesis
- Exhibits185: 360 degree market analysis
- Exhibits186: List of abbreviations
The traffic signal recognition market is forecasted to grow by USD 1375.8 mn during 2023-2028, accelerating at a CAGR of 4.75% during the forecast period. The report on the traffic signal recognition market provides a holistic analysis, market size and forecast, trends, growth drivers, and challenges, as well as vendor analysis covering around 25 vendors.
The report offers an up-to-date analysis regarding the current market scenario, the latest trends and drivers, and the overall market environment. The market is driven by rapid urbanization and increasing emphasis on road safety norms, growing need for real-time information system, and government initiatives to modify transport infrastructure.
Technavio's traffic signal recognition market is segmented as below:
| Market Scope | |
|---|---|
| Base Year | 2024 |
| End Year | 2028 |
| Series Year | 2024-2028 |
| Growth Momentum | Accelerate |
| YOY 2024 | 4.07% |
| CAGR | 4.75% |
| Incremental Value | $1375.8 mn |
By Vehicle Type
- Passenger vehicle
- Commercial vehicle
By Type
- Color-based detection
- Shape-based detection
- Feature-based detection
By Geographical Landscape
- North America
- Europe
- APAC
- South America
- Middle East and Africa
This study identifies the improving traffic flow regulations as one of the prime reasons driving the traffic signal recognition market growth during the next few years. Also, new product launches and growth of road transport infrastructure investment will lead to sizable demand in the market.
The report on the traffic signal recognition market covers the following areas:
- Traffic signal recognition market sizing
- Traffic signal recognition market forecast
- Traffic signal recognition market industry analysis
The robust vendor analysis is designed to help clients improve their market position, and in line with this, this report provides a detailed analysis of several leading traffic signal recognition market vendors that include Aldridge Traffic Controllers Pty Ltd., Continental AG, D G Controls Ltd., Delphi Technologies Plc, DENSO Corp., dSPACE GmbH, Elektrobit Automotive GmbH, Envoys Electronic Pvt. Ltd., European Safety Systems Ltd., Ford Motor Co., Gentex Corp., HELLA Aglaia Mobile Vision GmbH, Magna International Inc., Mercedes Benz Group AG, Mobileye Technologies Ltd., Robert Bosch GmbH, SKODA AUTO AS, SWARCO AG, Volkswagen AG, and ZF Friedrichshafen AG. Also, the traffic signal recognition market analysis report includes information on upcoming trends and challenges that will influence market growth. This is to help companies strategize and leverage all forthcoming growth opportunities.
The study was conducted using an objective combination of primary and secondary information including inputs from key participants in the industry. The report contains a comprehensive market and vendor landscape in addition to an analysis of the key vendors.
The publisher presents a detailed picture of the market by the way of study, synthesis, and summation of data from multiple sources by an analysis of key parameters such as profit, pricing, competition, and promotions. It presents various market facets by identifying the key industry influencers. The data presented is comprehensive, reliable, and a result of extensive research - both primary and secondary. The market research reports provide a complete competitive landscape and an in-depth vendor selection methodology and analysis using qualitative and quantitative research to forecast the accurate market growth.
Table of Contents
1 Executive Summary
- 1.1 Market overview
- Executive Summary - Chart on Market Overview
- Executive Summary - Data Table on Market Overview
- Executive Summary - Chart on Global Market Characteristics
- Executive Summary - Chart on Market By Geographical Landscape
- Executive Summary - Chart on Market Segmentation by Vehicle Type
- Executive Summary - Chart on Market Segmentation by Type
- Executive Summary - Chart on Incremental Growth
- Executive Summary - Data Table on Incremental Growth
- Executive Summary - Chart on Company Market Positioning
2 Market Landscape
- 2.1 Market ecosystem
- Parent Market
- Data Table on - Parent Market
- 2.2 Market characteristics
- Market characteristics analysis
- 2.3 Value chain analysis
- Value Chain Analysis
3 Market Sizing
- 3.1 Market definition
- Offerings of companies included in the market definition
- 3.2 Market segment analysis
- Market segments
- 3.3 Market size 2023
- 3.4 Market outlook: Forecast for 2023-2028
- Chart on Global - Market size and forecast 2023-2028 ($ million)
- Data Table on Global - Market size and forecast 2023-2028 ($ million)
- Chart on Global Market: Year-over-year growth 2023-2028 (%)
- Data Table on Global Market: Year-over-year growth 2023-2028 (%)
4 Historic Market Size
- 4.1 Global Traffic Signal Recognition Market 2018 - 2022
- Historic Market Size - Data Table on Global Traffic Signal Recognition Market 2018 - 2022 ($ million)
- 4.2 Vehicle Type segment analysis 2018 - 2022
- Historic Market Size - Vehicle Type Segment 2018 - 2022 ($ million)
- 4.3 Type segment analysis 2018 - 2022
- Historic Market Size - Type Segment 2018 - 2022 ($ million)
- 4.4 Geography segment analysis 2018 - 2022
- Historic Market Size - Geography Segment 2018 - 2022 ($ million)
- 4.5 Country segment analysis 2018 - 2022
- Historic Market Size - Country Segment 2018 - 2022 ($ million)
5 Five Forces Analysis
- 5.1 Five forces summary
- Five forces analysis - Comparison between 2023 and 2028
- 5.2 Bargaining power of buyers
- Bargaining power of buyers - Impact of key factors 2023 and 2028
- 5.3 Bargaining power of suppliers
- Bargaining power of suppliers - Impact of key factors in 2023 and 2028
- 5.4 Threat of new entrants
- Threat of new entrants - Impact of key factors in 2023 and 2028
- 5.5 Threat of substitutes
- Threat of substitutes - Impact of key factors in 2023 and 2028
- 5.6 Threat of rivalry
- Threat of rivalry - Impact of key factors in 2023 and 2028
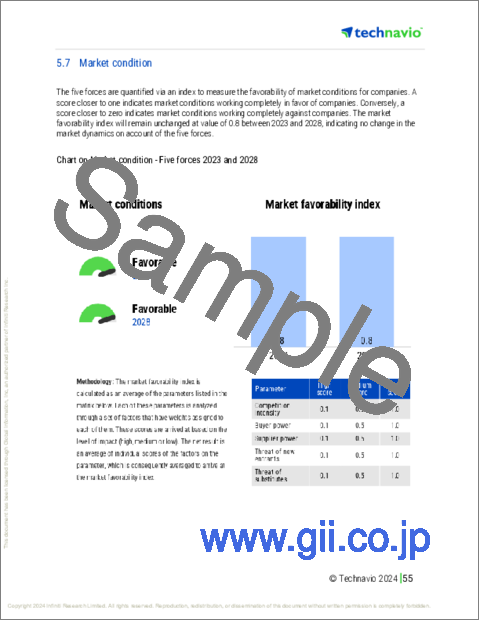
- 5.7 Market condition
- Chart on Market condition - Five forces 2023 and 2028
6 Market Segmentation by Vehicle Type
- 6.1 Market segments
- Chart on Vehicle Type - Market share 2023-2028 (%)
- Data Table on Vehicle Type - Market share 2023-2028 (%)
- 6.2 Comparison by Vehicle Type
- Chart on Comparison by Vehicle Type
- Data Table on Comparison by Vehicle Type
- 6.3 Passenger vehicle - Market size and forecast 2023-2028
- Chart on Passenger vehicle - Market size and forecast 2023-2028 ($ million)
- Data Table on Passenger vehicle - Market size and forecast 2023-2028 ($ million)
- Chart on Passenger vehicle - Year-over-year growth 2023-2028 (%)
- Data Table on Passenger vehicle - Year-over-year growth 2023-2028 (%)
- 6.4 Commercial vehicle - Market size and forecast 2023-2028
- Chart on Commercial vehicle - Market size and forecast 2023-2028 ($ million)
- Data Table on Commercial vehicle - Market size and forecast 2023-2028 ($ million)
- Chart on Commercial vehicle - Year-over-year growth 2023-2028 (%)
- Data Table on Commercial vehicle - Year-over-year growth 2023-2028 (%)
- 6.5 Market opportunity by Vehicle Type
- Market opportunity by Vehicle Type ($ million)
- Data Table on Market opportunity by Vehicle Type ($ million)
7 Market Segmentation by Type
- 7.1 Market segments
- Chart on Type - Market share 2023-2028 (%)
- Data Table on Type - Market share 2023-2028 (%)
- 7.2 Comparison by Type
- Chart on Comparison by Type
- Data Table on Comparison by Type
- 7.3 Color-based detection - Market size and forecast 2023-2028
- Chart on Color-based detection - Market size and forecast 2023-2028 ($ million)
- Data Table on Color-based detection - Market size and forecast 2023-2028 ($ million)
- Chart on Color-based detection - Year-over-year growth 2023-2028 (%)
- Data Table on Color-based detection - Year-over-year growth 2023-2028 (%)
- 7.4 Shape-based detection - Market size and forecast 2023-2028
- Chart on Shape-based detection - Market size and forecast 2023-2028 ($ million)
- Data Table on Shape-based detection - Market size and forecast 2023-2028 ($ million)
- Chart on Shape-based detection - Year-over-year growth 2023-2028 (%)
- Data Table on Shape-based detection - Year-over-year growth 2023-2028 (%)
- 7.5 Feature-based detection - Market size and forecast 2023-2028
- Chart on Feature-based detection - Market size and forecast 2023-2028 ($ million)
- Data Table on Feature-based detection - Market size and forecast 2023-2028 ($ million)
- Chart on Feature-based detection - Year-over-year growth 2023-2028 (%)
- Data Table on Feature-based detection - Year-over-year growth 2023-2028 (%)
- 7.6 Market opportunity by Type
- Market opportunity by Type ($ million)
- Data Table on Market opportunity by Type ($ million)
8 Customer Landscape
- 8.1 Customer landscape overview
- Analysis of price sensitivity, lifecycle, customer purchase basket, adoption rates, and purchase criteria
9 Geographic Landscape
- 9.1 Geographic segmentation
- Chart on Market share By Geographical Landscape 2023-2028 (%)
- Data Table on Market share By Geographical Landscape 2023-2028 (%)
- 9.2 Geographic comparison
- Chart on Geographic comparison
- Data Table on Geographic comparison
- 9.3 North America - Market size and forecast 2023-2028
- Chart on North America - Market size and forecast 2023-2028 ($ million)
- Data Table on North America - Market size and forecast 2023-2028 ($ million)
- Chart on North America - Year-over-year growth 2023-2028 (%)
- Data Table on North America - Year-over-year growth 2023-2028 (%)
- 9.4 Europe - Market size and forecast 2023-2028
- Chart on Europe - Market size and forecast 2023-2028 ($ million)
- Data Table on Europe - Market size and forecast 2023-2028 ($ million)
- Chart on Europe - Year-over-year growth 2023-2028 (%)
- Data Table on Europe - Year-over-year growth 2023-2028 (%)
- 9.5 APAC - Market size and forecast 2023-2028
- Chart on APAC - Market size and forecast 2023-2028 ($ million)
- Data Table on APAC - Market size and forecast 2023-2028 ($ million)
- Chart on APAC - Year-over-year growth 2023-2028 (%)
- Data Table on APAC - Year-over-year growth 2023-2028 (%)
- 9.6 South America - Market size and forecast 2023-2028
- Chart on South America - Market size and forecast 2023-2028 ($ million)
- Data Table on South America - Market size and forecast 2023-2028 ($ million)
- Chart on South America - Year-over-year growth 2023-2028 (%)
- Data Table on South America - Year-over-year growth 2023-2028 (%)
- 9.7 Middle East and Africa - Market size and forecast 2023-2028
- Chart on Middle East and Africa - Market size and forecast 2023-2028 ($ million)
- Data Table on Middle East and Africa - Market size and forecast 2023-2028 ($ million)
- Chart on Middle East and Africa - Year-over-year growth 2023-2028 (%)
- Data Table on Middle East and Africa - Year-over-year growth 2023-2028 (%)
- 9.8 US - Market size and forecast 2023-2028
- Chart on US - Market size and forecast 2023-2028 ($ million)
- Data Table on US - Market size and forecast 2023-2028 ($ million)
- Chart on US - Year-over-year growth 2023-2028 (%)
- Data Table on US - Year-over-year growth 2023-2028 (%)
- 9.9 Germany - Market size and forecast 2023-2028
- Chart on Germany - Market size and forecast 2023-2028 ($ million)
- Data Table on Germany - Market size and forecast 2023-2028 ($ million)
- Chart on Germany - Year-over-year growth 2023-2028 (%)
- Data Table on Germany - Year-over-year growth 2023-2028 (%)
- 9.10 UK - Market size and forecast 2023-2028
- Chart on UK - Market size and forecast 2023-2028 ($ million)
- Data Table on UK - Market size and forecast 2023-2028 ($ million)
- Chart on UK - Year-over-year growth 2023-2028 (%)
- Data Table on UK - Year-over-year growth 2023-2028 (%)
- 9.11 Japan - Market size and forecast 2023-2028
- Chart on Japan - Market size and forecast 2023-2028 ($ million)
- Data Table on Japan - Market size and forecast 2023-2028 ($ million)
- Chart on Japan - Year-over-year growth 2023-2028 (%)
- Data Table on Japan - Year-over-year growth 2023-2028 (%)
- 9.12 China - Market size and forecast 2023-2028
- Chart on China - Market size and forecast 2023-2028 ($ million)
- Data Table on China - Market size and forecast 2023-2028 ($ million)
- Chart on China - Year-over-year growth 2023-2028 (%)
- Data Table on China - Year-over-year growth 2023-2028 (%)
- 9.13 Market opportunity By Geographical Landscape
- Market opportunity By Geographical Landscape ($ million)
- Data Tables on Market opportunity By Geographical Landscape ($ million)
10 Drivers, Challenges, and Opportunity/Restraints
- 10.1 Market drivers
- 10.2 Market challenges
- 10.3 Impact of drivers and challenges
- Impact of drivers and challenges in 2023 and 2028
- 10.4 Market opportunities/restraints
11 Competitive Landscape
- 11.1 Overview
- 11.2 Competitive Landscape
- Overview on criticality of inputs and factors of differentiation
- 11.3 Landscape disruption
- Overview on factors of disruption
- 11.4 Industry risks
- Impact of key risks on business
12 Competitive Analysis
- 12.1 Companies profiled
- Companies covered
- 12.2 Market positioning of companies
- Matrix on companies position and classification
- 12.3 Continental AG
- Continental AG - Overview
- Continental AG - Business segments
- Continental AG - Key news
- Continental AG - Key offerings
- Continental AG - Segment focus
- 12.4 D G Controls Ltd.
- D G Controls Ltd. - Overview
- D G Controls Ltd. - Product / Service
- D G Controls Ltd. - Key offerings
- 12.5 DENSO Corp.
- DENSO Corp. - Overview
- DENSO Corp. - Business segments
- DENSO Corp. - Key news
- DENSO Corp. - Key offerings
- DENSO Corp. - Segment focus
- 12.6 dSPACE GmbH
- dSPACE GmbH - Overview
- dSPACE GmbH - Product / Service
- dSPACE GmbH - Key offerings
- 12.7 Elektrobit Automotive GmbH
- Elektrobit Automotive GmbH - Overview
- Elektrobit Automotive GmbH - Product / Service
- Elektrobit Automotive GmbH - Key offerings
- 12.8 European Safety Systems Ltd.
- European Safety Systems Ltd. - Overview
- European Safety Systems Ltd. - Product / Service
- European Safety Systems Ltd. - Key offerings
- 12.9 Ford Motor Co.
- Ford Motor Co. - Overview
- Ford Motor Co. - Business segments
- Ford Motor Co. - Key news
- Ford Motor Co. - Key offerings
- Ford Motor Co. - Segment focus
- 12.10 HELLA Aglaia Mobile Vision GmbH
- HELLA Aglaia Mobile Vision GmbH - Overview
- HELLA Aglaia Mobile Vision GmbH - Product / Service
- HELLA Aglaia Mobile Vision GmbH - Key offerings
- 12.11 Magna International Inc.
- Magna International Inc. - Overview
- Magna International Inc. - Business segments
- Magna International Inc. - Key news
- Magna International Inc. - Key offerings
- Magna International Inc. - Segment focus
- 12.12 Mercedes Benz Group AG
- Mercedes Benz Group AG - Overview
- Mercedes Benz Group AG - Business segments
- Mercedes Benz Group AG - Key news
- Mercedes Benz Group AG - Key offerings
- Mercedes Benz Group AG - Segment focus
- 12.13 Mobileye Technologies Ltd.
- Mobileye Technologies Ltd. - Overview
- Mobileye Technologies Ltd. - Product / Service
- Mobileye Technologies Ltd. - Key offerings
- 12.14 Robert Bosch GmbH
- Robert Bosch GmbH - Overview
- Robert Bosch GmbH - Product / Service
- Robert Bosch GmbH - Key news
- Robert Bosch GmbH - Key offerings
- 12.15 SKODA AUTO AS
- SKODA AUTO AS - Overview
- SKODA AUTO AS - Product / Service
- SKODA AUTO AS - Key offerings
- 12.16 Volkswagen AG
- Volkswagen AG - Overview
- Volkswagen AG - Business segments
- Volkswagen AG - Key news
- Volkswagen AG - Key offerings
- Volkswagen AG - Segment focus
- 12.17 ZF Friedrichshafen AG
- ZF Friedrichshafen AG - Overview
- ZF Friedrichshafen AG - Business segments
- ZF Friedrichshafen AG - Key news
- ZF Friedrichshafen AG - Key offerings
- ZF Friedrichshafen AG - Segment focus
13 Appendix
- 13.1 Scope of the report
- 13.2 Inclusions and exclusions checklist
- Inclusions checklist
- Exclusions checklist
- 13.3 Currency conversion rates for US$
- Currency conversion rates for US$
- 13.4 Research methodology
- Research methodology
- 13.5 Data procurement
- Information sources
- 13.6 Data validation
- Data validation
- 13.7 Validation techniques employed for market sizing
- Validation techniques employed for market sizing
- 13.8 Data synthesis
- Data synthesis
- 13.9 360 degree market analysis
- 360 degree market analysis
- 13.10 List of abbreviations
- List of abbreviations

