|
|
市場調査レポート
商品コード
1684907
カイトボード用品の世界市場 2025-2029年Global Kiteboarding Equipment Market 2025-2029 |
||||||

|
|||||||
カスタマイズ可能
|
|||||||


| カイトボード用品の世界市場 2025-2029年 |
|
出版日: 2025年03月08日
発行: TechNavio
ページ情報: 英文 209 Pages
納期: 即納可能
|

全表示
- 概要
- 図表
- 目次
カイトボード用品市場は2024-2029年に3億3,690万米ドル、予測期間中のCAGRで7.6%の成長が予測されています。
当レポートでは、カイトボード用品市場の全体的な分析、市場規模・予測、動向、成長促進要因、課題、約25のベンダーを網羅したベンダー分析などを掲載しています。
現在の市場シナリオ、最新動向と促進要因、市場環境全体に関する最新分析を提供しています。市場は、オリンピックでのカイトボードの採用、ビーチカルチャーとアドベンチャーツーリズムの人気上昇、サーフェスウォータースポーツ活動への参加者増加などが牽引しています。
| 市場範囲 | |
|---|---|
| 基準年 | 2025 |
| 終了年 | 2029 |
| 予測期間 | 2025-2029 |
| 成長モメンタム | 加速 |
| 前年比2025年 | 6.6% |
| CAGR | 7.6% |
| 増分額 | 3億3,690万米ドル |
本調査は、業界の主要参加者からのインプットを含め、一次情報と二次情報を客観的に組み合わせて実施しました。レポートには、主要企業の分析に加え、包括的な市場規模データ、地域分析によるセグメント、ベンダー情勢が含まれています。レポートには履歴データと予測データがあります。
本調査では、今後数年間のカイトボード用品市場の成長を促進する主な理由の一つとして、ユーザーの安全性を高める革新的な製品の発売を挙げています。また、有名人の参加やソーシャルメディアが若いカイトボーダーたちの関心を高め、eコマース売上の増加やオンラインコースの導入が市場の大きな需要につながるとしています。
目次
第1章 エグゼクティブサマリー
- 市場概要
第2章 Technavio分析
- 価格・ライフサイクル・顧客購入バスケット・採用率・購入基準の分析
- インプットの重要性と差別化の要因
- 混乱の要因
- 促進要因と課題の影響
第3章 市場情勢
- 市場エコシステム
- 市場の特徴
- バリューチェーン分析
第4章 市場規模
- 市場の定義
- 市場セグメント分析
- 市場規模 2024
- 市場の見通し 2024-2029
第5章 市場規模実績
- カイトボード用品の世界市場 2019-2023
- 流通チャネル別セグメント分析 2019-2023
- 製品別セグメント分析 2019-2023
- エンドユーザー別セグメント分析 2019-2023
- 地域別セグメント分析 2019-2023
- 国別セグメント分析 2019-2023
第6章 定性分析
- AIの影響:カイトボード用品の世界市場
第7章 ファイブフォース分析
- ファイブフォースの要約
- 買い手の交渉力
- 供給企業の交渉力
- 新規参入業者の脅威
- 代替品の脅威
- 競争の脅威
- 市況
第8章 市場セグメンテーション:流通チャネル別
- 市場セグメント
- 比較:流通チャネル別
- 小売:市場規模と予測 2024-2029
- その他:市場規模と予測 2024-2029
- 市場機会:流通チャネル別
第9章 市場セグメンテーション:製品別
- 市場セグメント
- 比較:製品別
- カイト:市場規模と予測 2024-2029
- 付属品:市場規模と予測 2024-2029
- ボード:市場規模と予測 2024-2029
- 市場機会:製品別
第10章 市場セグメンテーション:エンドユーザー別
- 市場セグメント
- 比較:エンドユーザー別
- レクリエーションユーザー:市場規模と予測 2024-2029
- プロスポーツ選手:市場規模と予測 2024-2029
- 市場機会:エンドユーザー別
第11章 顧客情勢
- 顧客情勢の概要
第12章 地域別情勢
- 地域別セグメンテーション
- 地域別比較
- 欧州:市場規模と予測 2024-2029
- 北米:市場規模と予測 2024-2029
- アジア太平洋:市場規模と予測 2024-2029
- 南米:市場規模と予測 2024-2029
- 中東・アフリカ:市場規模と予測 2024-2029
- ドイツ:市場規模と予測 2024-2029
- 米国:市場規模と予測 2024-2029
- フランス:市場規模と予測 2024-2029
- オーストラリア:市場規模と予測 2024-2029
- カナダ:市場規模と予測 2024-2029
- イタリア:市場規模と予測 2024-2029
- 中国:市場規模と予測 2024-2029
- 英国:市場規模と予測 2024-2029
- 日本:市場規模と予測 2024-2029
- メキシコ:市場規模と予測 2024-2029
- 市場機会:地域情勢別
第13章 促進要因・課題・機会・抑制要因
- 市場促進要因
- 市場の課題
- 促進要因と課題の影響
- 市場の機会・抑制要因
第14章 競合情勢
- 概要
- 競合情勢
- 混乱の状況
- 業界のリスク
第15章 競合分析
- 企業プロファイル
- 企業ランキング指数
- 企業の市場ポジショニング
- AXIS Foils
- Best Kiteboarding
- BOARDS and MORE GmbH
- Cabrinhakites Inc.
- Crazy Fly s.r.o
- Equipe Trading BV
- F ONE
- Go Foil Inc.
- Good Breeze Kiteboarding Inc.
- Litewave Kiteboards
- Motion Sports LLC
- Naish International
- North Actionsports B.V.
- RICCI INTERNATIONAL SRL
- Switch Kiteboarding
第16章 付録
Exhibits:
- Exhibits1: Executive Summary - Chart on Market Overview
- Exhibits2: Executive Summary - Data Table on Market Overview
- Exhibits3: Executive Summary - Chart on Global Market Characteristics
- Exhibits4: Executive Summary - Chart on Market By Geographical Landscape
- Exhibits5: Executive Summary - Chart on Market Segmentation by Distribution Channel
- Exhibits6: Executive Summary - Chart on Market Segmentation by Product
- Exhibits7: Executive Summary - Chart on Market Segmentation by End-user
- Exhibits8: Executive Summary - Chart on Incremental Growth
- Exhibits9: Executive Summary - Data Table on Incremental Growth
- Exhibits10: Executive Summary - Chart on Company Market Positioning
- Exhibits11: Analysis of price sensitivity, lifecycle, customer purchase basket, adoption rates, and purchase criteria
- Exhibits12: Overview on criticality of inputs and factors of differentiation
- Exhibits13: Overview on factors of disruption
- Exhibits14: Impact of drivers and challenges in 2024 and 2029
- Exhibits15: Parent Market
- Exhibits16: Data Table on - Parent Market
- Exhibits17: Market characteristics analysis
- Exhibits18: Value chain analysis
- Exhibits19: Offerings of companies included in the market definition
- Exhibits20: Market segments
- Exhibits21: Chart on Global - Market size and forecast 2024-2029 ($ million)
- Exhibits22: Data Table on Global - Market size and forecast 2024-2029 ($ million)
- Exhibits23: Chart on Global Market: Year-over-year growth 2024-2029 (%)
- Exhibits24: Data Table on Global Market: Year-over-year growth 2024-2029 (%)
- Exhibits25: Historic Market Size - Data Table on Global Kiteboarding Equipment Market 2019 - 2023 ($ million)
- Exhibits26: Historic Market Size - Distribution Channel Segment 2019 - 2023 ($ million)
- Exhibits27: Historic Market Size - Product Segment 2019 - 2023 ($ million)
- Exhibits28: Historic Market Size - End-user Segment 2019 - 2023 ($ million)
- Exhibits29: Historic Market Size - Geography Segment 2019 - 2023 ($ million)
- Exhibits30: Historic Market Size - Country Segment 2019 - 2023 ($ million)
- Exhibits31: Five forces analysis - Comparison between 2024 and 2029
- Exhibits32: Bargaining power of buyers - Impact of key factors 2024 and 2029
- Exhibits33: Bargaining power of suppliers - Impact of key factors in 2024 and 2029
- Exhibits34: Threat of new entrants - Impact of key factors in 2024 and 2029
- Exhibits35: Threat of substitutes - Impact of key factors in 2024 and 2029
- Exhibits36: Threat of rivalry - Impact of key factors in 2024 and 2029
- Exhibits37: Chart on Market condition - Five forces 2024 and 2029
- Exhibits38: Chart on Distribution Channel - Market share 2024-2029 (%)
- Exhibits39: Data Table on Distribution Channel - Market share 2024-2029 (%)
- Exhibits40: Chart on Comparison by Distribution Channel
- Exhibits41: Data Table on Comparison by Distribution Channel
- Exhibits42: Chart on Retail - Market size and forecast 2024-2029 ($ million)
- Exhibits43: Data Table on Retail - Market size and forecast 2024-2029 ($ million)
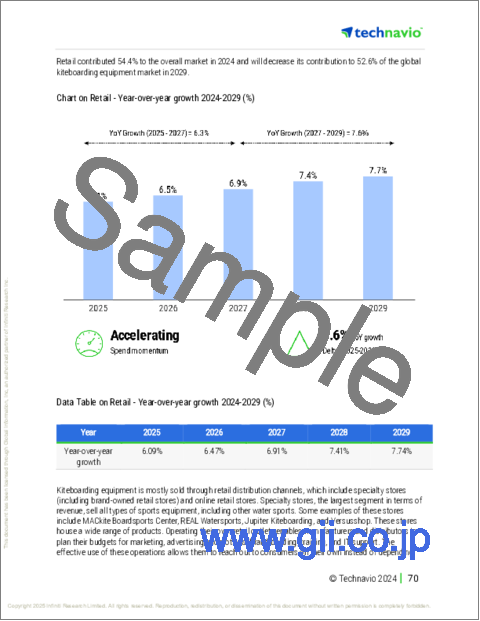
- Exhibits44: Chart on Retail - Year-over-year growth 2024-2029 (%)
- Exhibits45: Data Table on Retail - Year-over-year growth 2024-2029 (%)
- Exhibits46: Chart on Others - Market size and forecast 2024-2029 ($ million)
- Exhibits47: Data Table on Others - Market size and forecast 2024-2029 ($ million)
- Exhibits48: Chart on Others - Year-over-year growth 2024-2029 (%)
- Exhibits49: Data Table on Others - Year-over-year growth 2024-2029 (%)
- Exhibits50: Market opportunity by Distribution Channel ($ million)
- Exhibits51: Data Table on Market opportunity by Distribution Channel ($ million)
- Exhibits52: Chart on Product - Market share 2024-2029 (%)
- Exhibits53: Data Table on Product - Market share 2024-2029 (%)
- Exhibits54: Chart on Comparison by Product
- Exhibits55: Data Table on Comparison by Product
- Exhibits56: Chart on Kites - Market size and forecast 2024-2029 ($ million)
- Exhibits57: Data Table on Kites - Market size and forecast 2024-2029 ($ million)
- Exhibits58: Chart on Kites - Year-over-year growth 2024-2029 (%)
- Exhibits59: Data Table on Kites - Year-over-year growth 2024-2029 (%)
- Exhibits60: Chart on Accessories - Market size and forecast 2024-2029 ($ million)
- Exhibits61: Data Table on Accessories - Market size and forecast 2024-2029 ($ million)
- Exhibits62: Chart on Accessories - Year-over-year growth 2024-2029 (%)
- Exhibits63: Data Table on Accessories - Year-over-year growth 2024-2029 (%)
- Exhibits64: Chart on Boards - Market size and forecast 2024-2029 ($ million)
- Exhibits65: Data Table on Boards - Market size and forecast 2024-2029 ($ million)
- Exhibits66: Chart on Boards - Year-over-year growth 2024-2029 (%)
- Exhibits67: Data Table on Boards - Year-over-year growth 2024-2029 (%)
- Exhibits68: Market opportunity by Product ($ million)
- Exhibits69: Data Table on Market opportunity by Product ($ million)
- Exhibits70: Chart on End-user - Market share 2024-2029 (%)
- Exhibits71: Data Table on End-user - Market share 2024-2029 (%)
- Exhibits72: Chart on Comparison by End-user
- Exhibits73: Data Table on Comparison by End-user
- Exhibits74: Chart on Recreational users - Market size and forecast 2024-2029 ($ million)
- Exhibits75: Data Table on Recreational users - Market size and forecast 2024-2029 ($ million)
- Exhibits76: Chart on Recreational users - Year-over-year growth 2024-2029 (%)
- Exhibits77: Data Table on Recreational users - Year-over-year growth 2024-2029 (%)
- Exhibits78: Chart on Professional athletes - Market size and forecast 2024-2029 ($ million)
- Exhibits79: Data Table on Professional athletes - Market size and forecast 2024-2029 ($ million)
- Exhibits80: Chart on Professional athletes - Year-over-year growth 2024-2029 (%)
- Exhibits81: Data Table on Professional athletes - Year-over-year growth 2024-2029 (%)
- Exhibits82: Market opportunity by End-user ($ million)
- Exhibits83: Data Table on Market opportunity by End-user ($ million)
- Exhibits84: Analysis of price sensitivity, lifecycle, customer purchase basket, adoption rates, and purchase criteria
- Exhibits85: Chart on Market share By Geographical Landscape 2024-2029 (%)
- Exhibits86: Data Table on Market share By Geographical Landscape 2024-2029 (%)
- Exhibits87: Chart on Geographic comparison
- Exhibits88: Data Table on Geographic comparison
- Exhibits89: Chart on Europe - Market size and forecast 2024-2029 ($ million)
- Exhibits90: Data Table on Europe - Market size and forecast 2024-2029 ($ million)
- Exhibits91: Chart on Europe - Year-over-year growth 2024-2029 (%)
- Exhibits92: Data Table on Europe - Year-over-year growth 2024-2029 (%)
- Exhibits93: Chart on North America - Market size and forecast 2024-2029 ($ million)
- Exhibits94: Data Table on North America - Market size and forecast 2024-2029 ($ million)
- Exhibits95: Chart on North America - Year-over-year growth 2024-2029 (%)
- Exhibits96: Data Table on North America - Year-over-year growth 2024-2029 (%)
- Exhibits97: Chart on APAC - Market size and forecast 2024-2029 ($ million)
- Exhibits98: Data Table on APAC - Market size and forecast 2024-2029 ($ million)
- Exhibits99: Chart on APAC - Year-over-year growth 2024-2029 (%)
- Exhibits100: Data Table on APAC - Year-over-year growth 2024-2029 (%)
- Exhibits101: Chart on South America - Market size and forecast 2024-2029 ($ million)
- Exhibits102: Data Table on South America - Market size and forecast 2024-2029 ($ million)
- Exhibits103: Chart on South America - Year-over-year growth 2024-2029 (%)
- Exhibits104: Data Table on South America - Year-over-year growth 2024-2029 (%)
- Exhibits105: Chart on Middle East and Africa - Market size and forecast 2024-2029 ($ million)
- Exhibits106: Data Table on Middle East and Africa - Market size and forecast 2024-2029 ($ million)
- Exhibits107: Chart on Middle East and Africa - Year-over-year growth 2024-2029 (%)
- Exhibits108: Data Table on Middle East and Africa - Year-over-year growth 2024-2029 (%)
- Exhibits109: Chart on Germany - Market size and forecast 2024-2029 ($ million)
- Exhibits110: Data Table on Germany - Market size and forecast 2024-2029 ($ million)
- Exhibits111: Chart on Germany - Year-over-year growth 2024-2029 (%)
- Exhibits112: Data Table on Germany - Year-over-year growth 2024-2029 (%)
- Exhibits113: Chart on US - Market size and forecast 2024-2029 ($ million)
- Exhibits114: Data Table on US - Market size and forecast 2024-2029 ($ million)
- Exhibits115: Chart on US - Year-over-year growth 2024-2029 (%)
- Exhibits116: Data Table on US - Year-over-year growth 2024-2029 (%)
- Exhibits117: Chart on France - Market size and forecast 2024-2029 ($ million)
- Exhibits118: Data Table on France - Market size and forecast 2024-2029 ($ million)
- Exhibits119: Chart on France - Year-over-year growth 2024-2029 (%)
- Exhibits120: Data Table on France - Year-over-year growth 2024-2029 (%)
- Exhibits121: Chart on Australia - Market size and forecast 2024-2029 ($ million)
- Exhibits122: Data Table on Australia - Market size and forecast 2024-2029 ($ million)
- Exhibits123: Chart on Australia - Year-over-year growth 2024-2029 (%)
- Exhibits124: Data Table on Australia - Year-over-year growth 2024-2029 (%)
- Exhibits125: Chart on Canada - Market size and forecast 2024-2029 ($ million)
- Exhibits126: Data Table on Canada - Market size and forecast 2024-2029 ($ million)
- Exhibits127: Chart on Canada - Year-over-year growth 2024-2029 (%)
- Exhibits128: Data Table on Canada - Year-over-year growth 2024-2029 (%)
- Exhibits129: Chart on Italy - Market size and forecast 2024-2029 ($ million)
- Exhibits130: Data Table on Italy - Market size and forecast 2024-2029 ($ million)
- Exhibits131: Chart on Italy - Year-over-year growth 2024-2029 (%)
- Exhibits132: Data Table on Italy - Year-over-year growth 2024-2029 (%)
- Exhibits133: Chart on China - Market size and forecast 2024-2029 ($ million)
- Exhibits134: Data Table on China - Market size and forecast 2024-2029 ($ million)
- Exhibits135: Chart on China - Year-over-year growth 2024-2029 (%)
- Exhibits136: Data Table on China - Year-over-year growth 2024-2029 (%)
- Exhibits137: Chart on UK - Market size and forecast 2024-2029 ($ million)
- Exhibits138: Data Table on UK - Market size and forecast 2024-2029 ($ million)
- Exhibits139: Chart on UK - Year-over-year growth 2024-2029 (%)
- Exhibits140: Data Table on UK - Year-over-year growth 2024-2029 (%)
- Exhibits141: Chart on Japan - Market size and forecast 2024-2029 ($ million)
- Exhibits142: Data Table on Japan - Market size and forecast 2024-2029 ($ million)
- Exhibits143: Chart on Japan - Year-over-year growth 2024-2029 (%)
- Exhibits144: Data Table on Japan - Year-over-year growth 2024-2029 (%)
- Exhibits145: Chart on Mexico - Market size and forecast 2024-2029 ($ million)
- Exhibits146: Data Table on Mexico - Market size and forecast 2024-2029 ($ million)
- Exhibits147: Chart on Mexico - Year-over-year growth 2024-2029 (%)
- Exhibits148: Data Table on Mexico - Year-over-year growth 2024-2029 (%)
- Exhibits149: Market opportunity By Geographical Landscape ($ million)
- Exhibits150: Data Tables on Market opportunity By Geographical Landscape ($ million)
- Exhibits151: Impact of drivers and challenges in 2024 and 2029
- Exhibits152: Overview on criticality of inputs and factors of differentiation
- Exhibits153: Overview on factors of disruption
- Exhibits154: Impact of key risks on business
- Exhibits155: Companies covered
- Exhibits156: Company ranking index
- Exhibits157: Matrix on companies position and classification
- Exhibits158: AXIS Foils - Overview
- Exhibits159: AXIS Foils - Product / Service
- Exhibits160: AXIS Foils - Key offerings
- Exhibits161: SWOT
- Exhibits162: Best Kiteboarding - Overview
- Exhibits163: Best Kiteboarding - Product / Service
- Exhibits164: Best Kiteboarding - Key offerings
- Exhibits165: SWOT
- Exhibits166: BOARDS and MORE GmbH - Overview
- Exhibits167: BOARDS and MORE GmbH - Product / Service
- Exhibits168: BOARDS and MORE GmbH - Key offerings
- Exhibits169: SWOT
- Exhibits170: Cabrinhakites Inc. - Overview
- Exhibits171: Cabrinhakites Inc. - Product / Service
- Exhibits172: Cabrinhakites Inc. - Key offerings
- Exhibits173: SWOT
- Exhibits174: Crazy Fly s.r.o - Overview
- Exhibits175: Crazy Fly s.r.o - Product / Service
- Exhibits176: Crazy Fly s.r.o - Key offerings
- Exhibits177: SWOT
- Exhibits178: Equipe Trading BV - Overview
- Exhibits179: Equipe Trading BV - Product / Service
- Exhibits180: Equipe Trading BV - Key offerings
- Exhibits181: SWOT
- Exhibits182: F ONE - Overview
- Exhibits183: F ONE - Product / Service
- Exhibits184: F ONE - Key offerings
- Exhibits185: SWOT
- Exhibits186: Go Foil Inc. - Overview
- Exhibits187: Go Foil Inc. - Product / Service
- Exhibits188: Go Foil Inc. - Key offerings
- Exhibits189: SWOT
- Exhibits190: Good Breeze Kiteboarding Inc. - Overview
- Exhibits191: Good Breeze Kiteboarding Inc. - Product / Service
- Exhibits192: Good Breeze Kiteboarding Inc. - Key offerings
- Exhibits193: SWOT
- Exhibits194: Litewave Kiteboards - Overview
- Exhibits195: Litewave Kiteboards - Product / Service
- Exhibits196: Litewave Kiteboards - Key offerings
- Exhibits197: SWOT
- Exhibits198: Motion Sports LLC - Overview
- Exhibits199: Motion Sports LLC - Product / Service
- Exhibits200: Motion Sports LLC - Key offerings
- Exhibits201: SWOT
- Exhibits202: Naish International - Overview
- Exhibits203: Naish International - Product / Service
- Exhibits204: Naish International - Key offerings
- Exhibits205: SWOT
- Exhibits206: North Actionsports B.V. - Overview
- Exhibits207: North Actionsports B.V. - Product / Service
- Exhibits208: North Actionsports B.V. - Key offerings
- Exhibits209: SWOT
- Exhibits210: RICCI INTERNATIONAL SRL - Overview
- Exhibits211: RICCI INTERNATIONAL SRL - Product / Service
- Exhibits212: RICCI INTERNATIONAL SRL - Key offerings
- Exhibits213: SWOT
- Exhibits214: Switch Kiteboarding - Overview
- Exhibits215: Switch Kiteboarding - Product / Service
- Exhibits216: Switch Kiteboarding - Key offerings
- Exhibits217: SWOT
- Exhibits218: Inclusions checklist
- Exhibits219: Exclusions checklist
- Exhibits220: Currency conversion rates for US$
- Exhibits221: Research methodology
- Exhibits222: Information sources
- Exhibits223: Data validation
- Exhibits224: Validation techniques employed for market sizing
- Exhibits225: Data synthesis
- Exhibits226: 360 degree market analysis
- Exhibits227: List of abbreviations
The kiteboarding equipment market is forecasted to grow by USD 336.9 million during 2024-2029, accelerating at a CAGR of 7.6% during the forecast period. The report on the kiteboarding equipment market provides a holistic analysis, market size and forecast, trends, growth drivers, and challenges, as well as vendor analysis covering around 25 vendors.
The report offers an up-to-date analysis regarding the current market scenario, the latest trends and drivers, and the overall market environment. The market is driven by inclusion of kiteboarding in olympics, rising popularity of beach culture and adventure tourism, and increasing participation in surface water sporting activities.
| Market Scope | |
|---|---|
| Base Year | 2025 |
| End Year | 2029 |
| Series Year | 2025-2029 |
| Growth Momentum | Accelerate |
| YOY 2025 | 6.6% |
| CAGR | 7.6% |
| Incremental Value | $336.9 mn |
The study was conducted using an objective combination of primary and secondary information including inputs from key participants in the industry. The report contains a comprehensive market size data, segment with regional analysis and vendor landscape in addition to an analysis of the key companies. Reports have historic and forecast data.
Technavio's kiteboarding equipment market is segmented as below:
By Distribution Channel
- Retail
- Others
By Product
- Kites
- Accessories
- Boards
By End-user
- Recreational users
- Professional athletes
By Geographical Landscape
- Europe
- North America
- APAC
- South America
- Middle East and Africa
This study identifies the innovative product launches heightening user safety as one of the prime reasons driving the kiteboarding equipment market growth during the next few years. Also, celebrity participation and social media driving interest among young kiteboarders and rise in E-commerce sales and introduction of online courses will lead to sizable demand in the market.
The report on the kiteboarding equipment market covers the following areas:
- Kiteboarding Equipment Market sizing
- Kiteboarding Equipment Market forecast
- Kiteboarding Equipment Market industry analysis
The robust vendor analysis is designed to help clients improve their market position, and in line with this, this report provides a detailed analysis of several leading kiteboarding equipment market vendors that include AXIS Foils, Best Kiteboarding, BOARDS and MORE GmbH, Cabrinhakites Inc., Crazy Fly s.R.o, Epic Kites LLC, Equipe Trading BV, F ONE, Go Foil Inc., Good Breeze Kiteboarding Inc., Litewave Kiteboards, Motion Sports LLC, Naish International, North Actionsports B.V., RICCI INTERNATIONAL SRL, SHQ Boardsports, Skywalk GmbH and Co. KG, Slingshot Sports LLC, and Switch Kiteboarding. Also, the kiteboarding equipment market analysis report includes information on upcoming trends and challenges that will influence market growth. This is to help companies strategize and leverage all forthcoming growth opportunities.
The publisher presents a detailed picture of the market by the way of study, synthesis, and summation of data from multiple sources by an analysis of key parameters such as profit, pricing, competition, and promotions. It presents various market facets by identifying the key industry influencers. The data presented is comprehensive, reliable, and a result of extensive primary and secondary research. The market research reports provide a complete competitive landscape and an in-depth vendor selection methodology and analysis using qualitative and quantitative research to forecast accurate market growth.
Table of Contents
1 Executive Summary
- 1.1 Market overview
- Executive Summary - Chart on Market Overview
- Executive Summary - Data Table on Market Overview
- Executive Summary - Chart on Global Market Characteristics
- Executive Summary - Chart on Market By Geographical Landscape
- Executive Summary - Chart on Market Segmentation by Distribution Channel
- Executive Summary - Chart on Market Segmentation by Product
- Executive Summary - Chart on Market Segmentation by End-user
- Executive Summary - Chart on Incremental Growth
- Executive Summary - Data Table on Incremental Growth
- Executive Summary - Chart on Company Market Positioning
2 Technavio Analysis
- 2.1 Analysis of price sensitivity, lifecycle, customer purchase basket, adoption rates, and purchase criteria
- Analysis of price sensitivity, lifecycle, customer purchase basket, adoption rates, and purchase criteria
- 2.2 Criticality of inputs and Factors of differentiation
- Overview on criticality of inputs and factors of differentiation
- 2.3 Factors of disruption
- Overview on factors of disruption
- 2.4 Impact of drivers and challenges
- Impact of drivers and challenges in 2024 and 2029
3 Market Landscape
- 3.1 Market ecosystem
- Parent Market
- Data Table on - Parent Market
- 3.2 Market characteristics
- Market characteristics analysis
- 3.3 Value chain analysis
- Value chain analysis
4 Market Sizing
- 4.1 Market definition
- Offerings of companies included in the market definition
- 4.2 Market segment analysis
- Market segments
- 4.3 Market size 2024
- 4.4 Market outlook: Forecast for 2024-2029
- Chart on Global - Market size and forecast 2024-2029 ($ million)
- Data Table on Global - Market size and forecast 2024-2029 ($ million)
- Chart on Global Market: Year-over-year growth 2024-2029 (%)
- Data Table on Global Market: Year-over-year growth 2024-2029 (%)
5 Historic Market Size
- 5.1 Global Kiteboarding Equipment Market 2019 - 2023
- Historic Market Size - Data Table on Global Kiteboarding Equipment Market 2019 - 2023 ($ million)
- 5.2 Distribution Channel segment analysis 2019 - 2023
- Historic Market Size - Distribution Channel Segment 2019 - 2023 ($ million)
- 5.3 Product segment analysis 2019 - 2023
- Historic Market Size - Product Segment 2019 - 2023 ($ million)
- 5.4 End-user segment analysis 2019 - 2023
- Historic Market Size - End-user Segment 2019 - 2023 ($ million)
- 5.5 Geography segment analysis 2019 - 2023
- Historic Market Size - Geography Segment 2019 - 2023 ($ million)
- 5.6 Country segment analysis 2019 - 2023
- Historic Market Size - Country Segment 2019 - 2023 ($ million)
6 Qualitative Analysis
- 6.1 AI Impact on Global Kiteboarding Equipment Market
7 Five Forces Analysis
- 7.1 Five forces summary
- Five forces analysis - Comparison between 2024 and 2029
- 7.2 Bargaining power of buyers
- Bargaining power of buyers - Impact of key factors 2024 and 2029
- 7.3 Bargaining power of suppliers
- Bargaining power of suppliers - Impact of key factors in 2024 and 2029
- 7.4 Threat of new entrants
- Threat of new entrants - Impact of key factors in 2024 and 2029
- 7.5 Threat of substitutes
- Threat of substitutes - Impact of key factors in 2024 and 2029
- 7.6 Threat of rivalry
- Threat of rivalry - Impact of key factors in 2024 and 2029
- 7.7 Market condition
- Chart on Market condition - Five forces 2024 and 2029
8 Market Segmentation by Distribution Channel
- 8.1 Market segments
- Chart on Distribution Channel - Market share 2024-2029 (%)
- Data Table on Distribution Channel - Market share 2024-2029 (%)
- 8.2 Comparison by Distribution Channel
- Chart on Comparison by Distribution Channel
- Data Table on Comparison by Distribution Channel
- 8.3 Retail - Market size and forecast 2024-2029
- Chart on Retail - Market size and forecast 2024-2029 ($ million)
- Data Table on Retail - Market size and forecast 2024-2029 ($ million)
- Chart on Retail - Year-over-year growth 2024-2029 (%)
- Data Table on Retail - Year-over-year growth 2024-2029 (%)
- 8.4 Others - Market size and forecast 2024-2029
- Chart on Others - Market size and forecast 2024-2029 ($ million)
- Data Table on Others - Market size and forecast 2024-2029 ($ million)
- Chart on Others - Year-over-year growth 2024-2029 (%)
- Data Table on Others - Year-over-year growth 2024-2029 (%)
- 8.5 Market opportunity by Distribution Channel
- Market opportunity by Distribution Channel ($ million)
- Data Table on Market opportunity by Distribution Channel ($ million)
9 Market Segmentation by Product
- 9.1 Market segments
- Chart on Product - Market share 2024-2029 (%)
- Data Table on Product - Market share 2024-2029 (%)
- 9.2 Comparison by Product
- Chart on Comparison by Product
- Data Table on Comparison by Product
- 9.3 Kites - Market size and forecast 2024-2029
- Chart on Kites - Market size and forecast 2024-2029 ($ million)
- Data Table on Kites - Market size and forecast 2024-2029 ($ million)
- Chart on Kites - Year-over-year growth 2024-2029 (%)
- Data Table on Kites - Year-over-year growth 2024-2029 (%)
- 9.4 Accessories - Market size and forecast 2024-2029
- Chart on Accessories - Market size and forecast 2024-2029 ($ million)
- Data Table on Accessories - Market size and forecast 2024-2029 ($ million)
- Chart on Accessories - Year-over-year growth 2024-2029 (%)
- Data Table on Accessories - Year-over-year growth 2024-2029 (%)
- 9.5 Boards - Market size and forecast 2024-2029
- Chart on Boards - Market size and forecast 2024-2029 ($ million)
- Data Table on Boards - Market size and forecast 2024-2029 ($ million)
- Chart on Boards - Year-over-year growth 2024-2029 (%)
- Data Table on Boards - Year-over-year growth 2024-2029 (%)
- 9.6 Market opportunity by Product
- Market opportunity by Product ($ million)
- Data Table on Market opportunity by Product ($ million)
10 Market Segmentation by End-user
- 10.1 Market segments
- Chart on End-user - Market share 2024-2029 (%)
- Data Table on End-user - Market share 2024-2029 (%)
- 10.2 Comparison by End-user
- Chart on Comparison by End-user
- Data Table on Comparison by End-user
- 10.3 Recreational users - Market size and forecast 2024-2029
- Chart on Recreational users - Market size and forecast 2024-2029 ($ million)
- Data Table on Recreational users - Market size and forecast 2024-2029 ($ million)
- Chart on Recreational users - Year-over-year growth 2024-2029 (%)
- Data Table on Recreational users - Year-over-year growth 2024-2029 (%)
- 10.4 Professional athletes - Market size and forecast 2024-2029
- Chart on Professional athletes - Market size and forecast 2024-2029 ($ million)
- Data Table on Professional athletes - Market size and forecast 2024-2029 ($ million)
- Chart on Professional athletes - Year-over-year growth 2024-2029 (%)
- Data Table on Professional athletes - Year-over-year growth 2024-2029 (%)
- 10.5 Market opportunity by End-user
- Market opportunity by End-user ($ million)
- Data Table on Market opportunity by End-user ($ million)
11 Customer Landscape
- 11.1 Customer landscape overview
- Analysis of price sensitivity, lifecycle, customer purchase basket, adoption rates, and purchase criteria
12 Geographic Landscape
- 12.1 Geographic segmentation
- Chart on Market share By Geographical Landscape 2024-2029 (%)
- Data Table on Market share By Geographical Landscape 2024-2029 (%)
- 12.2 Geographic comparison
- Chart on Geographic comparison
- Data Table on Geographic comparison
- 12.3 Europe - Market size and forecast 2024-2029
- Chart on Europe - Market size and forecast 2024-2029 ($ million)
- Data Table on Europe - Market size and forecast 2024-2029 ($ million)
- Chart on Europe - Year-over-year growth 2024-2029 (%)
- Data Table on Europe - Year-over-year growth 2024-2029 (%)
- 12.4 North America - Market size and forecast 2024-2029
- Chart on North America - Market size and forecast 2024-2029 ($ million)
- Data Table on North America - Market size and forecast 2024-2029 ($ million)
- Chart on North America - Year-over-year growth 2024-2029 (%)
- Data Table on North America - Year-over-year growth 2024-2029 (%)
- 12.5 APAC - Market size and forecast 2024-2029
- Chart on APAC - Market size and forecast 2024-2029 ($ million)
- Data Table on APAC - Market size and forecast 2024-2029 ($ million)
- Chart on APAC - Year-over-year growth 2024-2029 (%)
- Data Table on APAC - Year-over-year growth 2024-2029 (%)
- 12.6 South America - Market size and forecast 2024-2029
- Chart on South America - Market size and forecast 2024-2029 ($ million)
- Data Table on South America - Market size and forecast 2024-2029 ($ million)
- Chart on South America - Year-over-year growth 2024-2029 (%)
- Data Table on South America - Year-over-year growth 2024-2029 (%)
- 12.7 Middle East and Africa - Market size and forecast 2024-2029
- Chart on Middle East and Africa - Market size and forecast 2024-2029 ($ million)
- Data Table on Middle East and Africa - Market size and forecast 2024-2029 ($ million)
- Chart on Middle East and Africa - Year-over-year growth 2024-2029 (%)
- Data Table on Middle East and Africa - Year-over-year growth 2024-2029 (%)
- 12.8 Germany - Market size and forecast 2024-2029
- Chart on Germany - Market size and forecast 2024-2029 ($ million)
- Data Table on Germany - Market size and forecast 2024-2029 ($ million)
- Chart on Germany - Year-over-year growth 2024-2029 (%)
- Data Table on Germany - Year-over-year growth 2024-2029 (%)
- 12.9 US - Market size and forecast 2024-2029
- Chart on US - Market size and forecast 2024-2029 ($ million)
- Data Table on US - Market size and forecast 2024-2029 ($ million)
- Chart on US - Year-over-year growth 2024-2029 (%)
- Data Table on US - Year-over-year growth 2024-2029 (%)
- 12.10 France - Market size and forecast 2024-2029
- Chart on France - Market size and forecast 2024-2029 ($ million)
- Data Table on France - Market size and forecast 2024-2029 ($ million)
- Chart on France - Year-over-year growth 2024-2029 (%)
- Data Table on France - Year-over-year growth 2024-2029 (%)
- 12.11 Australia - Market size and forecast 2024-2029
- Chart on Australia - Market size and forecast 2024-2029 ($ million)
- Data Table on Australia - Market size and forecast 2024-2029 ($ million)
- Chart on Australia - Year-over-year growth 2024-2029 (%)
- Data Table on Australia - Year-over-year growth 2024-2029 (%)
- 12.12 Canada - Market size and forecast 2024-2029
- Chart on Canada - Market size and forecast 2024-2029 ($ million)
- Data Table on Canada - Market size and forecast 2024-2029 ($ million)
- Chart on Canada - Year-over-year growth 2024-2029 (%)
- Data Table on Canada - Year-over-year growth 2024-2029 (%)
- 12.13 Italy - Market size and forecast 2024-2029
- Chart on Italy - Market size and forecast 2024-2029 ($ million)
- Data Table on Italy - Market size and forecast 2024-2029 ($ million)
- Chart on Italy - Year-over-year growth 2024-2029 (%)
- Data Table on Italy - Year-over-year growth 2024-2029 (%)
- 12.14 China - Market size and forecast 2024-2029
- Chart on China - Market size and forecast 2024-2029 ($ million)
- Data Table on China - Market size and forecast 2024-2029 ($ million)
- Chart on China - Year-over-year growth 2024-2029 (%)
- Data Table on China - Year-over-year growth 2024-2029 (%)
- 12.15 UK - Market size and forecast 2024-2029
- Chart on UK - Market size and forecast 2024-2029 ($ million)
- Data Table on UK - Market size and forecast 2024-2029 ($ million)
- Chart on UK - Year-over-year growth 2024-2029 (%)
- Data Table on UK - Year-over-year growth 2024-2029 (%)
- 12.16 Japan - Market size and forecast 2024-2029
- Chart on Japan - Market size and forecast 2024-2029 ($ million)
- Data Table on Japan - Market size and forecast 2024-2029 ($ million)
- Chart on Japan - Year-over-year growth 2024-2029 (%)
- Data Table on Japan - Year-over-year growth 2024-2029 (%)
- 12.17 Mexico - Market size and forecast 2024-2029
- Chart on Mexico - Market size and forecast 2024-2029 ($ million)
- Data Table on Mexico - Market size and forecast 2024-2029 ($ million)
- Chart on Mexico - Year-over-year growth 2024-2029 (%)
- Data Table on Mexico - Year-over-year growth 2024-2029 (%)
- 12.18 Market opportunity By Geographical Landscape
- Market opportunity By Geographical Landscape ($ million)
- Data Tables on Market opportunity By Geographical Landscape ($ million)
13 Drivers, Challenges, and Opportunity/Restraints
- 13.1 Market drivers
- 13.2 Market challenges
- 13.3 Impact of drivers and challenges
- Impact of drivers and challenges in 2024 and 2029
- 13.4 Market opportunities/restraints
14 Competitive Landscape
- 14.1 Overview
- 14.2 Competitive Landscape
- Overview on criticality of inputs and factors of differentiation
- 14.3 Landscape disruption
- Overview on factors of disruption
- 14.4 Industry risks
- Impact of key risks on business
15 Competitive Analysis
- 15.1 Companies profiled
- Companies covered
- 15.2 Company ranking index
- Company ranking index
- 15.3 Market positioning of companies
- Matrix on companies position and classification
- 15.4 AXIS Foils
- AXIS Foils - Overview
- AXIS Foils - Product / Service
- AXIS Foils - Key offerings
- SWOT
- 15.5 Best Kiteboarding
- Best Kiteboarding - Overview
- Best Kiteboarding - Product / Service
- Best Kiteboarding - Key offerings
- SWOT
- 15.6 BOARDS and MORE GmbH
- BOARDS and MORE GmbH - Overview
- BOARDS and MORE GmbH - Product / Service
- BOARDS and MORE GmbH - Key offerings
- SWOT
- 15.7 Cabrinhakites Inc.
- Cabrinhakites Inc. - Overview
- Cabrinhakites Inc. - Product / Service
- Cabrinhakites Inc. - Key offerings
- SWOT
- 15.8 Crazy Fly s.r.o
- Crazy Fly s.r.o - Overview
- Crazy Fly s.r.o - Product / Service
- Crazy Fly s.r.o - Key offerings
- SWOT
- 15.9 Equipe Trading BV
- Equipe Trading BV - Overview
- Equipe Trading BV - Product / Service
- Equipe Trading BV - Key offerings
- SWOT
- 15.10 F ONE
- F ONE - Overview
- F ONE - Product / Service
- F ONE - Key offerings
- SWOT
- 15.11 Go Foil Inc.
- Go Foil Inc. - Overview
- Go Foil Inc. - Product / Service
- Go Foil Inc. - Key offerings
- SWOT
- 15.12 Good Breeze Kiteboarding Inc.
- Good Breeze Kiteboarding Inc. - Overview
- Good Breeze Kiteboarding Inc. - Product / Service
- Good Breeze Kiteboarding Inc. - Key offerings
- SWOT
- 15.13 Litewave Kiteboards
- Litewave Kiteboards - Overview
- Litewave Kiteboards - Product / Service
- Litewave Kiteboards - Key offerings
- SWOT
- 15.14 Motion Sports LLC
- Motion Sports LLC - Overview
- Motion Sports LLC - Product / Service
- Motion Sports LLC - Key offerings
- SWOT
- 15.15 Naish International
- Naish International - Overview
- Naish International - Product / Service
- Naish International - Key offerings
- SWOT
- 15.16 North Actionsports B.V.
- North Actionsports B.V. - Overview
- North Actionsports B.V. - Product / Service
- North Actionsports B.V. - Key offerings
- SWOT
- 15.17 RICCI INTERNATIONAL SRL
- RICCI INTERNATIONAL SRL - Overview
- RICCI INTERNATIONAL SRL - Product / Service
- RICCI INTERNATIONAL SRL - Key offerings
- SWOT
- 15.18 Switch Kiteboarding
- Switch Kiteboarding - Overview
- Switch Kiteboarding - Product / Service
- Switch Kiteboarding - Key offerings
- SWOT
16 Appendix
- 16.1 Scope of the report
- 16.2 Inclusions and exclusions checklist
- Inclusions checklist
- Exclusions checklist
- 16.3 Currency conversion rates for US$
- Currency conversion rates for US$
- 16.4 Research methodology
- Research methodology
- 16.5 Data procurement
- Information sources
- 16.6 Data validation
- Data validation
- 16.7 Validation techniques employed for market sizing
- Validation techniques employed for market sizing
- 16.8 Data synthesis
- Data synthesis
- 16.9 360 degree market analysis
- 360 degree market analysis
- 16.10 List of abbreviations
- List of abbreviations

