|
|
市場調査レポート
商品コード
1558466
ソーラーパネルリサイクルの世界市場 2024-2028Global Solar Panel Recycling Market 2024-2028 |
||||||

|
|||||||
カスタマイズ可能
|
|||||||

| ソーラーパネルリサイクルの世界市場 2024-2028 |
|
出版日: 2024年08月16日
発行: TechNavio
ページ情報: 英文 166 Pages
納期: 即納可能
|

全表示
- 概要
- 図表
- 目次
ソーラーパネルリサイクル市場は2023-2028年に7億9,880万米ドル、予測期間中のCAGRは35.23%で成長すると予測されます。
当レポートでは、ソーラーパネルリサイクル市場の全体的な分析、市場規模・予測、動向、成長促進要因、課題、約25のベンダーを網羅したベンダー分析などを掲載しています。
現在の市場シナリオ、最新動向と促進要因、市場環境全体に関する最新分析を提供しています。市場は、ソーラーPVシステムのコスト削減、ソーラーPVパネル設置の成長、ソーラー廃棄物リサイクルに関連する政府規制によって牽引されています。
| 市場範囲 | |
|---|---|
| 基準年 | 2024 |
| 終了年 | 2028 |
| 予測期間 | 2024-2028 |
| 成長モメンタム | 加速 |
| 前年比2024年 | 27.56% |
| CAGR | 35.23% |
| 増分額 | 7億9,880万米ドル |
本調査では、今後数年間のソーラーパネルリサイクル市場成長を牽引する主な要因の一つとして、再生可能エネルギー源への投資の増加を挙げています。また、ペイグソーラーのビジネスモデルの普及やゼロエネルギービルの市場開拓は、市場の大きな需要につながります。
目次
第1章 エグゼクティブサマリー
- 市場概要
第2章 市場情勢
- 市場エコシステム
- 市場の特徴
- バリューチェーン分析
第3章 市場規模の評価
- 市場の定義
- 市場セグメント分析
- 市場規模 2023
- 市場の見通し 2023-2028
第4章 市場規模実績
- ソーラーパネルリサイクルの世界市場 2018-2022
- 製品別セグメント分析 2018-2022
- タイプ別セグメント分析 2018-2022
- 地域別セグメント分析 2018-2022
- 国別セグメント分析 2018-2022
第5章 ファイブフォース分析
- ファイブフォースの要約
- 買い手の交渉力
- 供給企業の交渉力
- 新規参入業者の脅威
- 代替品の脅威
- 競争の脅威
- 市況
第6章 市場セグメンテーション:製品別
- 市場セグメンテーション
- 比較:製品別
- 結晶質:市場規模と予測 2023-2028
- 薄膜:市場規模と予測 2023-2028
- 市場機会:製品別
第7章 市場セグメンテーション:タイプ別
- 市場セグメンテーション
- 比較:タイプ別
- サーマル:市場規模と予測 2023-2028
- 機械:市場規模と予測 2023-2028
- レーザー:市場規模と予測 2023-2028
- 市場機会:タイプ別
第8章 顧客情勢
- 顧客情勢の概要
第9章 地域別情勢
- 地域別セグメンテーション
- 地域別比較
- 欧州:市場規模と予測 2023-2028
- アジア太平洋:市場規模と予測 2023-2028
- 北米:市場規模と予測 2023-2028
- 中東・アフリカ:市場規模と予測 2023-2028
- 南米:市場規模と予測 2023-2028
- ドイツ:市場規模と予測 2023-2028
- 日本:市場規模と予測 2023-2028
- 米国:市場規模と予測 2023-2028
- イタリア:市場規模と予測 2023-2028
- 中国:市場規模と予測 2023-2028
- 市場機会:地域情勢別
第10章 促進要因・課題・機会・抑制要因
- 市場促進要因
- 市場の課題
- 促進要因と課題の影響
- 市場の機会・抑制要因
第11章 競合情勢
- 概要
- 競合情勢
- 混乱の状況
- 業界のリスク
第12章 競合分析
- 企業プロファイル
- 企業の市場ポジショニング
- Cleanites Recycling
- ENVARIS GmbH
- First Solar Inc.
- NPC Inc.
- Reclaim PV Recycling Pty Ltd.
- Recycle Solar Technologies Ltd.
- Reiling GmbH and Co. KG
- Rinovasol Global Services BV
- SILCONTEL Ltd.
- Silrec Corp.
- Solarcycle Inc.
- The Activ Group Solutions Pty Ltd
- Veolia Environnement SA
- We Recycle Solar
- Yingli Green Energy Holding Co. Ltd.
第13章 付録
Exhibits:
- Exhibits1: Executive Summary - Chart on Market Overview
- Exhibits2: Executive Summary - Data Table on Market Overview
- Exhibits3: Executive Summary - Chart on Global Market Characteristics
- Exhibits4: Executive Summary - Chart on Market By Geographical Landscape
- Exhibits5: Executive Summary - Chart on Market Segmentation by Product
- Exhibits6: Executive Summary - Chart on Market Segmentation by Type
- Exhibits7: Executive Summary - Chart on Incremental Growth
- Exhibits8: Executive Summary - Data Table on Incremental Growth
- Exhibits9: Executive Summary - Chart on Company Market Positioning
- Exhibits10: Parent Market
- Exhibits11: Data Table on - Parent Market
- Exhibits12: Market characteristics analysis
- Exhibits13: Value Chain Analysis
- Exhibits14: Offerings of companies included in the market definition
- Exhibits15: Market segments
- Exhibits16: Chart on Global - Market size and forecast 2023-2028 ($ million)
- Exhibits17: Data Table on Global - Market size and forecast 2023-2028 ($ million)
- Exhibits18: Chart on Global Market: Year-over-year growth 2023-2028 (%)
- Exhibits19: Data Table on Global Market: Year-over-year growth 2023-2028 (%)
- Exhibits20: Historic Market Size - Data Table on Global Solar Panel Recycling Market 2018 - 2022 ($ million)
- Exhibits21: Historic Market Size - Product Segment 2018 - 2022 ($ million)
- Exhibits22: Historic Market Size - Type Segment 2018 - 2022 ($ million)
- Exhibits23: Historic Market Size - Geography Segment 2018 - 2022 ($ million)
- Exhibits24: Historic Market Size - Country Segment 2018 - 2022 ($ million)
- Exhibits25: Five forces analysis - Comparison between 2023 and 2028
- Exhibits26: Bargaining power of buyers - Impact of key factors 2023 and 2028
- Exhibits27: Bargaining power of suppliers - Impact of key factors in 2023 and 2028
- Exhibits28: Threat of new entrants - Impact of key factors in 2023 and 2028
- Exhibits29: Threat of substitutes - Impact of key factors in 2023 and 2028
- Exhibits30: Threat of rivalry - Impact of key factors in 2023 and 2028
- Exhibits31: Chart on Market condition - Five forces 2023 and 2028
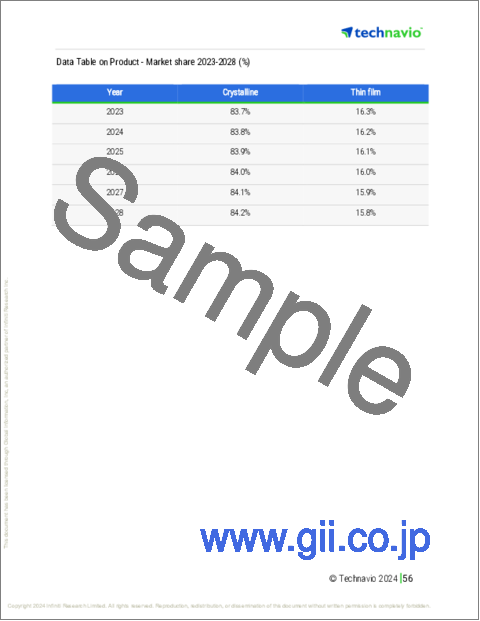
- Exhibits32: Chart on Product - Market share 2023-2028 (%)
- Exhibits33: Data Table on Product - Market share 2023-2028 (%)
- Exhibits34: Chart on Comparison by Product
- Exhibits35: Data Table on Comparison by Product
- Exhibits36: Chart on Crystalline - Market size and forecast 2023-2028 ($ million)
- Exhibits37: Data Table on Crystalline - Market size and forecast 2023-2028 ($ million)
- Exhibits38: Chart on Crystalline - Year-over-year growth 2023-2028 (%)
- Exhibits39: Data Table on Crystalline - Year-over-year growth 2023-2028 (%)
- Exhibits40: Chart on Thin film - Market size and forecast 2023-2028 ($ million)
- Exhibits41: Data Table on Thin film - Market size and forecast 2023-2028 ($ million)
- Exhibits42: Chart on Thin film - Year-over-year growth 2023-2028 (%)
- Exhibits43: Data Table on Thin film - Year-over-year growth 2023-2028 (%)
- Exhibits44: Market opportunity by Product ($ million)
- Exhibits45: Data Table on Market opportunity by Product ($ million)
- Exhibits46: Chart on Type - Market share 2023-2028 (%)
- Exhibits47: Data Table on Type - Market share 2023-2028 (%)
- Exhibits48: Chart on Comparison by Type
- Exhibits49: Data Table on Comparison by Type
- Exhibits50: Chart on Thermal - Market size and forecast 2023-2028 ($ million)
- Exhibits51: Data Table on Thermal - Market size and forecast 2023-2028 ($ million)
- Exhibits52: Chart on Thermal - Year-over-year growth 2023-2028 (%)
- Exhibits53: Data Table on Thermal - Year-over-year growth 2023-2028 (%)
- Exhibits54: Chart on Mechanical - Market size and forecast 2023-2028 ($ million)
- Exhibits55: Data Table on Mechanical - Market size and forecast 2023-2028 ($ million)
- Exhibits56: Chart on Mechanical - Year-over-year growth 2023-2028 (%)
- Exhibits57: Data Table on Mechanical - Year-over-year growth 2023-2028 (%)
- Exhibits58: Chart on Laser - Market size and forecast 2023-2028 ($ million)
- Exhibits59: Data Table on Laser - Market size and forecast 2023-2028 ($ million)
- Exhibits60: Chart on Laser - Year-over-year growth 2023-2028 (%)
- Exhibits61: Data Table on Laser - Year-over-year growth 2023-2028 (%)
- Exhibits62: Market opportunity by Type ($ million)
- Exhibits63: Data Table on Market opportunity by Type ($ million)
- Exhibits64: Analysis of price sensitivity, lifecycle, customer purchase basket, adoption rates, and purchase criteria
- Exhibits65: Chart on Market share By Geographical Landscape 2023-2028 (%)
- Exhibits66: Data Table on Market share By Geographical Landscape 2023-2028 (%)
- Exhibits67: Chart on Geographic comparison
- Exhibits68: Data Table on Geographic comparison
- Exhibits69: Chart on Europe - Market size and forecast 2023-2028 ($ million)
- Exhibits70: Data Table on Europe - Market size and forecast 2023-2028 ($ million)
- Exhibits71: Chart on Europe - Year-over-year growth 2023-2028 (%)
- Exhibits72: Data Table on Europe - Year-over-year growth 2023-2028 (%)
- Exhibits73: Chart on APAC - Market size and forecast 2023-2028 ($ million)
- Exhibits74: Data Table on APAC - Market size and forecast 2023-2028 ($ million)
- Exhibits75: Chart on APAC - Year-over-year growth 2023-2028 (%)
- Exhibits76: Data Table on APAC - Year-over-year growth 2023-2028 (%)
- Exhibits77: Chart on North America - Market size and forecast 2023-2028 ($ million)
- Exhibits78: Data Table on North America - Market size and forecast 2023-2028 ($ million)
- Exhibits79: Chart on North America - Year-over-year growth 2023-2028 (%)
- Exhibits80: Data Table on North America - Year-over-year growth 2023-2028 (%)
- Exhibits81: Chart on Middle East and Africa - Market size and forecast 2023-2028 ($ million)
- Exhibits82: Data Table on Middle East and Africa - Market size and forecast 2023-2028 ($ million)
- Exhibits83: Chart on Middle East and Africa - Year-over-year growth 2023-2028 (%)
- Exhibits84: Data Table on Middle East and Africa - Year-over-year growth 2023-2028 (%)
- Exhibits85: Chart on South America - Market size and forecast 2023-2028 ($ million)
- Exhibits86: Data Table on South America - Market size and forecast 2023-2028 ($ million)
- Exhibits87: Chart on South America - Year-over-year growth 2023-2028 (%)
- Exhibits88: Data Table on South America - Year-over-year growth 2023-2028 (%)
- Exhibits89: Chart on Germany - Market size and forecast 2023-2028 ($ million)
- Exhibits90: Data Table on Germany - Market size and forecast 2023-2028 ($ million)
- Exhibits91: Chart on Germany - Year-over-year growth 2023-2028 (%)
- Exhibits92: Data Table on Germany - Year-over-year growth 2023-2028 (%)
- Exhibits93: Chart on Japan - Market size and forecast 2023-2028 ($ million)
- Exhibits94: Data Table on Japan - Market size and forecast 2023-2028 ($ million)
- Exhibits95: Chart on Japan - Year-over-year growth 2023-2028 (%)
- Exhibits96: Data Table on Japan - Year-over-year growth 2023-2028 (%)
- Exhibits97: Chart on US - Market size and forecast 2023-2028 ($ million)
- Exhibits98: Data Table on US - Market size and forecast 2023-2028 ($ million)
- Exhibits99: Chart on US - Year-over-year growth 2023-2028 (%)
- Exhibits100: Data Table on US - Year-over-year growth 2023-2028 (%)
- Exhibits101: Chart on Italy - Market size and forecast 2023-2028 ($ million)
- Exhibits102: Data Table on Italy - Market size and forecast 2023-2028 ($ million)
- Exhibits103: Chart on Italy - Year-over-year growth 2023-2028 (%)
- Exhibits104: Data Table on Italy - Year-over-year growth 2023-2028 (%)
- Exhibits105: Chart on China - Market size and forecast 2023-2028 ($ million)
- Exhibits106: Data Table on China - Market size and forecast 2023-2028 ($ million)
- Exhibits107: Chart on China - Year-over-year growth 2023-2028 (%)
- Exhibits108: Data Table on China - Year-over-year growth 2023-2028 (%)
- Exhibits109: Market opportunity By Geographical Landscape ($ million)
- Exhibits110: Data Tables on Market opportunity By Geographical Landscape ($ million)
- Exhibits111: Impact of drivers and challenges in 2023 and 2028
- Exhibits112: Overview on criticality of inputs and factors of differentiation
- Exhibits113: Overview on factors of disruption
- Exhibits114: Impact of key risks on business
- Exhibits115: Companies covered
- Exhibits116: Matrix on companies position and classification
- Exhibits117: Cleanites Recycling - Overview
- Exhibits118: Cleanites Recycling - Product / Service
- Exhibits119: Cleanites Recycling - Key offerings
- Exhibits120: ENVARIS GmbH - Overview
- Exhibits121: ENVARIS GmbH - Product / Service
- Exhibits122: ENVARIS GmbH - Key offerings
- Exhibits123: First Solar Inc. - Overview
- Exhibits124: First Solar Inc. - Business segments
- Exhibits125: First Solar Inc. - Key news
- Exhibits126: First Solar Inc. - Key offerings
- Exhibits127: First Solar Inc. - Segment focus
- Exhibits128: NPC Inc. - Overview
- Exhibits129: NPC Inc. - Product / Service
- Exhibits130: NPC Inc. - Key offerings
- Exhibits131: Reclaim PV Recycling Pty Ltd. - Overview
- Exhibits132: Reclaim PV Recycling Pty Ltd. - Product / Service
- Exhibits133: Reclaim PV Recycling Pty Ltd. - Key offerings
- Exhibits134: Recycle Solar Technologies Ltd. - Overview
- Exhibits135: Recycle Solar Technologies Ltd. - Product / Service
- Exhibits136: Recycle Solar Technologies Ltd. - Key offerings
- Exhibits137: Reiling GmbH and Co. KG - Overview
- Exhibits138: Reiling GmbH and Co. KG - Product / Service
- Exhibits139: Reiling GmbH and Co. KG - Key offerings
- Exhibits140: Rinovasol Global Services BV - Overview
- Exhibits141: Rinovasol Global Services BV - Product / Service
- Exhibits142: Rinovasol Global Services BV - Key offerings
- Exhibits143: SILCONTEL Ltd. - Overview
- Exhibits144: SILCONTEL Ltd. - Product / Service
- Exhibits145: SILCONTEL Ltd. - Key offerings
- Exhibits146: Silrec Corp. - Overview
- Exhibits147: Silrec Corp. - Product / Service
- Exhibits148: Silrec Corp. - Key offerings
- Exhibits149: Solarcycle Inc. - Overview
- Exhibits150: Solarcycle Inc. - Product / Service
- Exhibits151: Solarcycle Inc. - Key offerings
- Exhibits152: The Activ Group Solutions Pty Ltd - Overview
- Exhibits153: The Activ Group Solutions Pty Ltd - Product / Service
- Exhibits154: The Activ Group Solutions Pty Ltd - Key offerings
- Exhibits155: Veolia Environnement SA - Overview
- Exhibits156: Veolia Environnement SA - Business segments
- Exhibits157: Veolia Environnement SA - Key news
- Exhibits158: Veolia Environnement SA - Key offerings
- Exhibits159: Veolia Environnement SA - Segment focus
- Exhibits160: We Recycle Solar - Overview
- Exhibits161: We Recycle Solar - Product / Service
- Exhibits162: We Recycle Solar - Key offerings
- Exhibits163: Yingli Green Energy Holding Co. Ltd. - Overview
- Exhibits164: Yingli Green Energy Holding Co. Ltd. - Product / Service
- Exhibits165: Yingli Green Energy Holding Co. Ltd. - Key news
- Exhibits166: Yingli Green Energy Holding Co. Ltd. - Key offerings
- Exhibits167: Inclusions checklist
- Exhibits168: Exclusions checklist
- Exhibits169: Currency conversion rates for US$
- Exhibits170: Research methodology
- Exhibits171: Information sources
- Exhibits172: Data validation
- Exhibits173: Validation techniques employed for market sizing
- Exhibits174: Data synthesis
- Exhibits175: 360 degree market analysis
- Exhibits176: List of abbreviations
The solar panel recycling market is forecasted to grow by USD 798.8 mn during 2023-2028, accelerating at a CAGR of 35.23% during the forecast period. The report on the solar panel recycling market provides a holistic analysis, market size and forecast, trends, growth drivers, and challenges, as well as vendor analysis covering around 25 vendors.
The report offers an up-to-date analysis regarding the current market scenario, the latest trends and drivers, and the overall market environment. The market is driven by reduction in costs of solar pv systems, growth in solar pv panel installation, and government regulations pertaining to solar waste recycling.
Technavio's solar panel recycling market is segmented as below:
| Market Scope | |
|---|---|
| Base Year | 2024 |
| End Year | 2028 |
| Series Year | 2024-2028 |
| Growth Momentum | Accelerate |
| YOY 2024 | 27.56% |
| CAGR | 35.23% |
| Incremental Value | $798.8 mn |
By Product
- Crystalline
- Thin film
By Type
- Thermal
- Mechanical
- Laser
By Geographical Landscape
- Europe
- APAC
- North America
- Middle East and Africa
- South America
This study identifies the increasing investment in renewable energy sources as one of the prime reasons driving the solar panel recycling market growth during the next few years. Also, rise in popularity of payg solar business model and development of zero-energy buildings will lead to sizable demand in the market.
The report on the solar panel recycling market covers the following areas:
- Solar panel recycling market sizing
- Solar panel recycling market forecast
- Solar panel recycling market industry analysis
The robust vendor analysis is designed to help clients improve their market position, and in line with this, this report provides a detailed analysis of several leading solar panel recycling market vendors that include Aurubis AG, Canadian Solar Inc., Cleanites Recycling, ENVARIS GmbH, First Solar Inc., NPC Inc., Reclaim PV Recycling Pty Ltd., Recycle Solar Technologies Ltd., Reiling GmbH and Co. KG, Rinovasol Global Services BV, SiC Processing GmbH, SILCONTEL Ltd., Silrec Corp., Solarcycle Inc., SunPower Corp., The Activ Group Solutions Pty Ltd, Trina Solar Co. Ltd., Veolia Environnement SA, We Recycle Solar, and Yingli Green Energy Holding Co. Ltd.. Also, the solar panel recycling market analysis report includes information on upcoming trends and challenges that will influence market growth. This is to help companies strategize and leverage all forthcoming growth opportunities.
The study was conducted using an objective combination of primary and secondary information including inputs from key participants in the industry. The report contains a comprehensive market and vendor landscape in addition to an analysis of the key vendors.
The publisher presents a detailed picture of the market by the way of study, synthesis, and summation of data from multiple sources by an analysis of key parameters such as profit, pricing, competition, and promotions. It presents various market facets by identifying the key industry influencers. The data presented is comprehensive, reliable, and a result of extensive research - both primary and secondary. The market research reports provide a complete competitive landscape and an in-depth vendor selection methodology and analysis using qualitative and quantitative research to forecast the accurate market growth.
Table of Contents
1 Executive Summary
- 1.1 Market overview
- Executive Summary - Chart on Market Overview
- Executive Summary - Data Table on Market Overview
- Executive Summary - Chart on Global Market Characteristics
- Executive Summary - Chart on Market By Geographical Landscape
- Executive Summary - Chart on Market Segmentation by Product
- Executive Summary - Chart on Market Segmentation by Type
- Executive Summary - Chart on Incremental Growth
- Executive Summary - Data Table on Incremental Growth
- Executive Summary - Chart on Company Market Positioning
2 Market Landscape
- 2.1 Market ecosystem
- Parent Market
- Data Table on - Parent Market
- 2.2 Market characteristics
- Market characteristics analysis
- 2.3 Value chain analysis
- Value Chain Analysis
3 Market Sizing
- 3.1 Market definition
- Offerings of companies included in the market definition
- 3.2 Market segment analysis
- Market segments
- 3.3 Market size 2023
- 3.4 Market outlook: Forecast for 2023-2028
- Chart on Global - Market size and forecast 2023-2028 ($ million)
- Data Table on Global - Market size and forecast 2023-2028 ($ million)
- Chart on Global Market: Year-over-year growth 2023-2028 (%)
- Data Table on Global Market: Year-over-year growth 2023-2028 (%)
4 Historic Market Size
- 4.1 Global Solar Panel Recycling Market 2018 - 2022
- Historic Market Size - Data Table on Global Solar Panel Recycling Market 2018 - 2022 ($ million)
- 4.2 Product segment analysis 2018 - 2022
- Historic Market Size - Product Segment 2018 - 2022 ($ million)
- 4.3 Type segment analysis 2018 - 2022
- Historic Market Size - Type Segment 2018 - 2022 ($ million)
- 4.4 Geography segment analysis 2018 - 2022
- Historic Market Size - Geography Segment 2018 - 2022 ($ million)
- 4.5 Country segment analysis 2018 - 2022
- Historic Market Size - Country Segment 2018 - 2022 ($ million)
5 Five Forces Analysis
- 5.1 Five forces summary
- Five forces analysis - Comparison between 2023 and 2028
- 5.2 Bargaining power of buyers
- Bargaining power of buyers - Impact of key factors 2023 and 2028
- 5.3 Bargaining power of suppliers
- Bargaining power of suppliers - Impact of key factors in 2023 and 2028
- 5.4 Threat of new entrants
- Threat of new entrants - Impact of key factors in 2023 and 2028
- 5.5 Threat of substitutes
- Threat of substitutes - Impact of key factors in 2023 and 2028
- 5.6 Threat of rivalry
- Threat of rivalry - Impact of key factors in 2023 and 2028
- 5.7 Market condition
- Chart on Market condition - Five forces 2023 and 2028
6 Market Segmentation by Product
- 6.1 Market segments
- Chart on Product - Market share 2023-2028 (%)
- Data Table on Product - Market share 2023-2028 (%)
- 6.2 Comparison by Product
- Chart on Comparison by Product
- Data Table on Comparison by Product
- 6.3 Crystalline - Market size and forecast 2023-2028
- Chart on Crystalline - Market size and forecast 2023-2028 ($ million)
- Data Table on Crystalline - Market size and forecast 2023-2028 ($ million)
- Chart on Crystalline - Year-over-year growth 2023-2028 (%)
- Data Table on Crystalline - Year-over-year growth 2023-2028 (%)
- 6.4 Thin film - Market size and forecast 2023-2028
- Chart on Thin film - Market size and forecast 2023-2028 ($ million)
- Data Table on Thin film - Market size and forecast 2023-2028 ($ million)
- Chart on Thin film - Year-over-year growth 2023-2028 (%)
- Data Table on Thin film - Year-over-year growth 2023-2028 (%)
- 6.5 Market opportunity by Product
- Market opportunity by Product ($ million)
- Data Table on Market opportunity by Product ($ million)
7 Market Segmentation by Type
- 7.1 Market segments
- Chart on Type - Market share 2023-2028 (%)
- Data Table on Type - Market share 2023-2028 (%)
- 7.2 Comparison by Type
- Chart on Comparison by Type
- Data Table on Comparison by Type
- 7.3 Thermal - Market size and forecast 2023-2028
- Chart on Thermal - Market size and forecast 2023-2028 ($ million)
- Data Table on Thermal - Market size and forecast 2023-2028 ($ million)
- Chart on Thermal - Year-over-year growth 2023-2028 (%)
- Data Table on Thermal - Year-over-year growth 2023-2028 (%)
- 7.4 Mechanical - Market size and forecast 2023-2028
- Chart on Mechanical - Market size and forecast 2023-2028 ($ million)
- Data Table on Mechanical - Market size and forecast 2023-2028 ($ million)
- Chart on Mechanical - Year-over-year growth 2023-2028 (%)
- Data Table on Mechanical - Year-over-year growth 2023-2028 (%)
- 7.5 Laser - Market size and forecast 2023-2028
- Chart on Laser - Market size and forecast 2023-2028 ($ million)
- Data Table on Laser - Market size and forecast 2023-2028 ($ million)
- Chart on Laser - Year-over-year growth 2023-2028 (%)
- Data Table on Laser - Year-over-year growth 2023-2028 (%)
- 7.6 Market opportunity by Type
- Market opportunity by Type ($ million)
- Data Table on Market opportunity by Type ($ million)
8 Customer Landscape
- 8.1 Customer landscape overview
- Analysis of price sensitivity, lifecycle, customer purchase basket, adoption rates, and purchase criteria
9 Geographic Landscape
- 9.1 Geographic segmentation
- Chart on Market share By Geographical Landscape 2023-2028 (%)
- Data Table on Market share By Geographical Landscape 2023-2028 (%)
- 9.2 Geographic comparison
- Chart on Geographic comparison
- Data Table on Geographic comparison
- 9.3 Europe - Market size and forecast 2023-2028
- Chart on Europe - Market size and forecast 2023-2028 ($ million)
- Data Table on Europe - Market size and forecast 2023-2028 ($ million)
- Chart on Europe - Year-over-year growth 2023-2028 (%)
- Data Table on Europe - Year-over-year growth 2023-2028 (%)
- 9.4 APAC - Market size and forecast 2023-2028
- Chart on APAC - Market size and forecast 2023-2028 ($ million)
- Data Table on APAC - Market size and forecast 2023-2028 ($ million)
- Chart on APAC - Year-over-year growth 2023-2028 (%)
- Data Table on APAC - Year-over-year growth 2023-2028 (%)
- 9.5 North America - Market size and forecast 2023-2028
- Chart on North America - Market size and forecast 2023-2028 ($ million)
- Data Table on North America - Market size and forecast 2023-2028 ($ million)
- Chart on North America - Year-over-year growth 2023-2028 (%)
- Data Table on North America - Year-over-year growth 2023-2028 (%)
- 9.6 Middle East and Africa - Market size and forecast 2023-2028
- Chart on Middle East and Africa - Market size and forecast 2023-2028 ($ million)
- Data Table on Middle East and Africa - Market size and forecast 2023-2028 ($ million)
- Chart on Middle East and Africa - Year-over-year growth 2023-2028 (%)
- Data Table on Middle East and Africa - Year-over-year growth 2023-2028 (%)
- 9.7 South America - Market size and forecast 2023-2028
- Chart on South America - Market size and forecast 2023-2028 ($ million)
- Data Table on South America - Market size and forecast 2023-2028 ($ million)
- Chart on South America - Year-over-year growth 2023-2028 (%)
- Data Table on South America - Year-over-year growth 2023-2028 (%)
- 9.8 Germany - Market size and forecast 2023-2028
- Chart on Germany - Market size and forecast 2023-2028 ($ million)
- Data Table on Germany - Market size and forecast 2023-2028 ($ million)
- Chart on Germany - Year-over-year growth 2023-2028 (%)
- Data Table on Germany - Year-over-year growth 2023-2028 (%)
- 9.9 Japan - Market size and forecast 2023-2028
- Chart on Japan - Market size and forecast 2023-2028 ($ million)
- Data Table on Japan - Market size and forecast 2023-2028 ($ million)
- Chart on Japan - Year-over-year growth 2023-2028 (%)
- Data Table on Japan - Year-over-year growth 2023-2028 (%)
- 9.10 US - Market size and forecast 2023-2028
- Chart on US - Market size and forecast 2023-2028 ($ million)
- Data Table on US - Market size and forecast 2023-2028 ($ million)
- Chart on US - Year-over-year growth 2023-2028 (%)
- Data Table on US - Year-over-year growth 2023-2028 (%)
- 9.11 Italy - Market size and forecast 2023-2028
- Chart on Italy - Market size and forecast 2023-2028 ($ million)
- Data Table on Italy - Market size and forecast 2023-2028 ($ million)
- Chart on Italy - Year-over-year growth 2023-2028 (%)
- Data Table on Italy - Year-over-year growth 2023-2028 (%)
- 9.12 China - Market size and forecast 2023-2028
- Chart on China - Market size and forecast 2023-2028 ($ million)
- Data Table on China - Market size and forecast 2023-2028 ($ million)
- Chart on China - Year-over-year growth 2023-2028 (%)
- Data Table on China - Year-over-year growth 2023-2028 (%)
- 9.13 Market opportunity By Geographical Landscape
- Market opportunity By Geographical Landscape ($ million)
- Data Tables on Market opportunity By Geographical Landscape ($ million)
10 Drivers, Challenges, and Opportunity/Restraints
- 10.1 Market drivers
- 10.2 Market challenges
- 10.3 Impact of drivers and challenges
- Impact of drivers and challenges in 2023 and 2028
- 10.4 Market opportunities/restraints
11 Competitive Landscape
- 11.1 Overview
- 11.2 Competitive Landscape
- Overview on criticality of inputs and factors of differentiation
- 11.3 Landscape disruption
- Overview on factors of disruption
- 11.4 Industry risks
- Impact of key risks on business
12 Competitive Analysis
- 12.1 Companies profiled
- Companies covered
- 12.2 Market positioning of companies
- Matrix on companies position and classification
- 12.3 Cleanites Recycling
- Cleanites Recycling - Overview
- Cleanites Recycling - Product / Service
- Cleanites Recycling - Key offerings
- 12.4 ENVARIS GmbH
- ENVARIS GmbH - Overview
- ENVARIS GmbH - Product / Service
- ENVARIS GmbH - Key offerings
- 12.5 First Solar Inc.
- First Solar Inc. - Overview
- First Solar Inc. - Business segments
- First Solar Inc. - Key news
- First Solar Inc. - Key offerings
- First Solar Inc. - Segment focus
- 12.6 NPC Inc.
- NPC Inc. - Overview
- NPC Inc. - Product / Service
- NPC Inc. - Key offerings
- 12.7 Reclaim PV Recycling Pty Ltd.
- Reclaim PV Recycling Pty Ltd. - Overview
- Reclaim PV Recycling Pty Ltd. - Product / Service
- Reclaim PV Recycling Pty Ltd. - Key offerings
- 12.8 Recycle Solar Technologies Ltd.
- Recycle Solar Technologies Ltd. - Overview
- Recycle Solar Technologies Ltd. - Product / Service
- Recycle Solar Technologies Ltd. - Key offerings
- 12.9 Reiling GmbH and Co. KG
- Reiling GmbH and Co. KG - Overview
- Reiling GmbH and Co. KG - Product / Service
- Reiling GmbH and Co. KG - Key offerings
- 12.10 Rinovasol Global Services BV
- Rinovasol Global Services BV - Overview
- Rinovasol Global Services BV - Product / Service
- Rinovasol Global Services BV - Key offerings
- 12.11 SILCONTEL Ltd.
- SILCONTEL Ltd. - Overview
- SILCONTEL Ltd. - Product / Service
- SILCONTEL Ltd. - Key offerings
- 12.12 Silrec Corp.
- Silrec Corp. - Overview
- Silrec Corp. - Product / Service
- Silrec Corp. - Key offerings
- 12.13 Solarcycle Inc.
- Solarcycle Inc. - Overview
- Solarcycle Inc. - Product / Service
- Solarcycle Inc. - Key offerings
- 12.14 The Activ Group Solutions Pty Ltd
- The Activ Group Solutions Pty Ltd - Overview
- The Activ Group Solutions Pty Ltd - Product / Service
- The Activ Group Solutions Pty Ltd - Key offerings
- 12.15 Veolia Environnement SA
- Veolia Environnement SA - Overview
- Veolia Environnement SA - Business segments
- Veolia Environnement SA - Key news
- Veolia Environnement SA - Key offerings
- Veolia Environnement SA - Segment focus
- 12.16 We Recycle Solar
- We Recycle Solar - Overview
- We Recycle Solar - Product / Service
- We Recycle Solar - Key offerings
- 12.17 Yingli Green Energy Holding Co. Ltd.
- Yingli Green Energy Holding Co. Ltd. - Overview
- Yingli Green Energy Holding Co. Ltd. - Product / Service
- Yingli Green Energy Holding Co. Ltd. - Key news
- Yingli Green Energy Holding Co. Ltd. - Key offerings
13 Appendix
- 13.1 Scope of the report
- 13.2 Inclusions and exclusions checklist
- Inclusions checklist
- Exclusions checklist
- 13.3 Currency conversion rates for US$
- Currency conversion rates for US$
- 13.4 Research methodology
- Research methodology
- 13.5 Data procurement
- Information sources
- 13.6 Data validation
- Data validation
- 13.7 Validation techniques employed for market sizing
- Validation techniques employed for market sizing
- 13.8 Data synthesis
- Data synthesis
- 13.9 360 degree market analysis
- 360 degree market analysis
- 13.10 List of abbreviations
- List of abbreviations

