|
|
市場調査レポート
商品コード
1144590
車載コンピュータシステムの世界市場 2022-2026Global In-Vehicle Computer System Market 2022-2026 |
||||||
|
|
|||||||
|
● お客様のご希望に応じて、既存データの加工や未掲載情報(例:国別セグメント)の追加などの対応が可能です。 詳細はお問い合わせください。 |
|||||||


| 車載コンピュータシステムの世界市場 2022-2026 |
|
出版日: 2022年10月17日
発行: TechNavio
ページ情報: 英文 120 Pages
納期: 即納可能
|
- 全表示
- 概要
- 図表
- 目次
当レポートでは車載コンピュータシステムの市場規模は、2022年から2026年の間に23億4000万米ドルの増加が見込まれ、予測期間中に15.07%のCAGRで成長すると予測しています。当レポートでは、車載コンピュータシステム市場の全体分析、市場規模・予測、動向、成長促進要因・課題、約25社のベンダーを網羅したベンダー分析などを掲載しています。
また、現在の世界の市場動向と促進要因、市場全体の環境に関する最新の分析も行っています。
市場は、コンシューマーエレクトロニクスとコネクテッドビークル・ソリューションの高い相関性、スマートフォン統合の需要の高まり、クラウド技術とIoTの採用の増加によって牽引されています。
本調査では、今後数年間の車載コンピュータシステム市場の成長を牽引する主要な要因の一つとして、スマートフォンの統合の増加を挙げています。また、車載用ai技術を搭載したOSやモノのインターネットとの統合における技術革新が進むことで、市場の大きな需要につながるでしょう。
目次
第1章 エグゼクティブサマリー
- 市場概要
第2章 市場情勢
- 市場エコシステム
第3章 市場規模
- 市場の定義
- 市場セグメント分析
- 市場規模 2021
- 市場の見通し:2021-2026年の予測
第4章 ファイブフォース分析
- ファイブフォースの要約
- 買い手の交渉力
- 供給企業の交渉力
- 新規参入業者の脅威
- 代替品の脅威
- 競争の脅威
- 市況
第5章 アプリケーション別市場セグメンテーション
- 市場内訳
- 用途別比較
- 乗用車 - 市場規模と予測 2021-2026
- 商用車 - 市場規模と予測 2021-2026
- アプリケーション別の市場機会
第6章 顧客情勢
- 顧客情勢の概要
第7章 地域別情勢
- 地域別セグメンテーション
- 地域別比較
- 北米 - 市場規模と予測 2021-2026
- 欧州 - 市場規模と予測 2021-2026
- APAC - 市場規模と予測 2021-2026
- 南米 - 市場規模と予測 2021-2026
- 中東およびアフリカ - 市場規模と予測 2021-2026
- 米国 - 市場規模と予測 2021-2026
- 中国 - 市場規模と予測 2021-2026
- ドイツ - 市場規模と予測 2021-2026
- 英国 - 市場規模と予測 2021-2026
- フランス - 市場規模と予測 2021-2026
- 地域情勢別の市場機会
第8章 促進要因、課題、および動向
- 市場促進要因
- 市場の課題
- 促進要因と課題の影響
- 市場動向
第9章 ベンダー情勢
- 概要
- ベンダー情勢
- 混乱の状況
- 業界のリスク
第10章 ベンダー分析
- 対象ベンダー
- ベンダーの市場ポジショニング
- Acrosser Technology Co. Ltd.
- American Portwell Technology Inc.
- Axiomtek Co. Ltd.
- IBASE Technology Inc.
- IEI Integration Corp.
- Lanner Electronics Inc.
- NEXCOM International Co. Ltd.
- Premio Inc.
- S and T AG
- SINTRONES Technology Corp.
第11章 付録
Exhibits:
- Exhibits1: Executive Summary - Chart on Market Overview
- Exhibits2: Executive Summary - Data Table on Market Overview
- Exhibits3: Executive Summary - Chart on Global Market Characteristics
- Exhibits4: Executive Summary - Chart on Market By Geographical Landscape
- Exhibits5: Executive Summary - Chart on Market Segmentation by Application
- Exhibits6: Executive Summary - Chart on Incremental Growth
- Exhibits7: Executive Summary - Data Table on Incremental Growth
- Exhibits8: Executive Summary - Chart on Vendor Market Positioning
- Exhibits9: Parent market
- Exhibits10: Market Characteristics
- Exhibits11: Offerings of vendors included in the market definition
- Exhibits12: Market segments
- Exhibits13: Chart on Global - Market size and forecast 2021-2026 ($ million)
- Exhibits14: Data Table on Global - Market size and forecast 2021-2026 ($ million)
- Exhibits15: Chart on Global Market: Year-over-year growth 2021-2026 (%)
- Exhibits16: Data Table on Global Market: Year-over-year growth 2021-2026 (%)
- Exhibits17: Five forces analysis - Comparison between 2021 and 2026
- Exhibits18: Chart on Bargaining power of buyers - Impact of key factors 2021 and 2026
- Exhibits19: Bargaining power of suppliers - Impact of key factors in 2021 and 2026
- Exhibits20: Threat of new entrants - Impact of key factors in 2021 and 2026
- Exhibits21: Threat of substitutes - Impact of key factors in 2021 and 2026
- Exhibits22: Threat of rivalry - Impact of key factors in 2021 and 2026
- Exhibits23: Chart on Market condition - Five forces 2021 and 2026
- Exhibits24: Chart on Application - Market share 2021-2026 (%)
- Exhibits25: Data Table on Application - Market share 2021-2026 (%)
- Exhibits26: Chart on Comparison by Application
- Exhibits27: Data Table on Comparison by Application
- Exhibits28: Chart on Passenger vehicle - Market size and forecast 2021-2026 ($ million)
- Exhibits29: Data Table on Passenger vehicle - Market size and forecast 2021-2026 ($ million)
- Exhibits30: Chart on Passenger vehicle - Year-over-year growth 2021-2026 (%)
- Exhibits31: Data Table on Passenger vehicle - Year-over-year growth 2021-2026 (%)
- Exhibits32: Chart on Commercial vehicle - Market size and forecast 2021-2026 ($ million)
- Exhibits33: Data Table on Commercial vehicle - Market size and forecast 2021-2026 ($ million)
- Exhibits34: Chart on Commercial vehicle - Year-over-year growth 2021-2026 (%)
- Exhibits35: Data Table on Commercial vehicle - Year-over-year growth 2021-2026 (%)
- Exhibits36: Market opportunity by Application ($ million)
- Exhibits37: Analysis of price sensitivity, lifecycle, customer purchase basket, adoption rates, and purchase criteria
- Exhibits38: Chart on Market share By Geographical Landscape 2021-2026 (%)
- Exhibits39: Data Table on Market share By Geographical Landscape 2021-2026 (%)
- Exhibits40: Chart on Geographic comparison
- Exhibits41: Data Table on Geographic comparison
- Exhibits42: Chart on North America - Market size and forecast 2021-2026 ($ million)
- Exhibits43: Data Table on North America - Market size and forecast 2021-2026 ($ million)
- Exhibits44: Chart on North America - Year-over-year growth 2021-2026 (%)
- Exhibits45: Data Table on North America - Year-over-year growth 2021-2026 (%)
- Exhibits46: Chart on Europe - Market size and forecast 2021-2026 ($ million)
- Exhibits47: Data Table on Europe - Market size and forecast 2021-2026 ($ million)
- Exhibits48: Chart on Europe - Year-over-year growth 2021-2026 (%)
- Exhibits49: Data Table on Europe - Year-over-year growth 2021-2026 (%)
- Exhibits50: Chart on APAC - Market size and forecast 2021-2026 ($ million)
- Exhibits51: Data Table on APAC - Market size and forecast 2021-2026 ($ million)
- Exhibits52: Chart on APAC - Year-over-year growth 2021-2026 (%)
- Exhibits53: Data Table on APAC - Year-over-year growth 2021-2026 (%)
- Exhibits54: Chart on South America - Market size and forecast 2021-2026 ($ million)
- Exhibits55: Data Table on South America - Market size and forecast 2021-2026 ($ million)
- Exhibits56: Chart on South America - Year-over-year growth 2021-2026 (%)
- Exhibits57: Data Table on South America - Year-over-year growth 2021-2026 (%)
- Exhibits58: Chart on Middle East and Africa - Market size and forecast 2021-2026 ($ million)
- Exhibits59: Data Table on Middle East and Africa - Market size and forecast 2021-2026 ($ million)
- Exhibits60: Chart on Middle East and Africa - Year-over-year growth 2021-2026 (%)
- Exhibits61: Data Table on Middle East and Africa - Year-over-year growth 2021-2026 (%)
- Exhibits62: Chart on US - Market size and forecast 2021-2026 ($ million)
- Exhibits63: Data Table on US - Market size and forecast 2021-2026 ($ million)
- Exhibits64: Chart on US - Year-over-year growth 2021-2026 (%)
- Exhibits65: Data Table on US - Year-over-year growth 2021-2026 (%)
- Exhibits66: Chart on China - Market size and forecast 2021-2026 ($ million)
- Exhibits67: Data Table on China - Market size and forecast 2021-2026 ($ million)
- Exhibits68: Chart on China - Year-over-year growth 2021-2026 (%)
- Exhibits69: Data Table on China - Year-over-year growth 2021-2026 (%)
- Exhibits70: Chart on Germany - Market size and forecast 2021-2026 ($ million)
- Exhibits71: Data Table on Germany - Market size and forecast 2021-2026 ($ million)
- Exhibits72: Chart on Germany - Year-over-year growth 2021-2026 (%)
- Exhibits73: Data Table on Germany - Year-over-year growth 2021-2026 (%)
- Exhibits74: Chart on UK - Market size and forecast 2021-2026 ($ million)
- Exhibits75: Data Table on UK - Market size and forecast 2021-2026 ($ million)
- Exhibits76: Chart on UK - Year-over-year growth 2021-2026 (%)
- Exhibits77: Data Table on UK - Year-over-year growth 2021-2026 (%)
- Exhibits78: Chart on France - Market size and forecast 2021-2026 ($ million)
- Exhibits79: Data Table on France - Market size and forecast 2021-2026 ($ million)
- Exhibits80: Chart on France - Year-over-year growth 2021-2026 (%)
- Exhibits81: Data Table on France - Year-over-year growth 2021-2026 (%)
- Exhibits82: Market opportunity By Geographical Landscape ($ million)
- Exhibits83: Impact of drivers and challenges in 2021 and 2026
- Exhibits84: Overview on Criticality of inputs and Factors of differentiation
- Exhibits85: Overview on factors of disruption
- Exhibits86: Impact of key risks on business
- Exhibits87: Vendors covered
- Exhibits88: Matrix on vendor position and classification
- Exhibits89: Acrosser Technology Co. Ltd. - Overview
- Exhibits90: Acrosser Technology Co. Ltd. - Product / Service
- Exhibits91: Acrosser Technology Co. Ltd. - Key offerings
- Exhibits92: American Portwell Technology Inc. - Overview
- Exhibits93: American Portwell Technology Inc. - Product / Service
- Exhibits94: American Portwell Technology Inc. - Key news
- Exhibits95: American Portwell Technology Inc. - Key offerings
- Exhibits96: Axiomtek Co. Ltd. - Overview
- Exhibits97: Axiomtek Co. Ltd. - Product / Service
- Exhibits98: Axiomtek Co. Ltd. - Key offerings
- Exhibits99: IBASE Technology Inc. - Overview
- Exhibits100: IBASE Technology Inc. - Product / Service
- Exhibits101: IBASE Technology Inc. - Key offerings
- Exhibits102: IEI Integration Corp. - Overview
- Exhibits103: IEI Integration Corp. - Product / Service
- Exhibits104: IEI Integration Corp. - Key news
- Exhibits105: IEI Integration Corp. - Key offerings
- Exhibits106: Lanner Electronics Inc. - Overview
- Exhibits107: Lanner Electronics Inc. - Product / Service
- Exhibits108: Lanner Electronics Inc. - Key offerings
- Exhibits109: NEXCOM International Co. Ltd. - Overview
- Exhibits110: NEXCOM International Co. Ltd. - Product / Service
- Exhibits111: NEXCOM International Co. Ltd. - Key offerings
- Exhibits112: Premio Inc. - Overview
- Exhibits113: Premio Inc. - Product / Service
- Exhibits114: Premio Inc. - Key offerings
- Exhibits115: S and T AG - Overview
- Exhibits116: S and T AG - Business segments
- Exhibits117: S and T AG - Key offerings
- Exhibits118: S and T AG - Segment focus
- Exhibits119: SINTRONES Technology Corp. - Overview
- Exhibits120: SINTRONES Technology Corp. - Product / Service
- Exhibits121: SINTRONES Technology Corp. - Key offerings
- Exhibits122: Inclusions checklist
- Exhibits123: Exclusions checklist
- Exhibits124: Currency conversion rates for US$
- Exhibits125: Research methodology
- Exhibits126: Validation techniques employed for market sizing
- Exhibits127: Information sources
- Exhibits128: List of abbreviations
Technavio has been monitoring the in-vehicle computer system market and it is poised to grow by $2.34 billion during 2022-2026, accelerating at a CAGR of 15.07% during the forecast period. Our report on the in-vehicle computer system market provides a holistic analysis, market size and forecast, trends, growth drivers, and challenges, as well as vendor analysis covering around 25 vendors.
The report offers an up-to-date analysis regarding the current global market scenario, the latest trends and drivers, and the overall market environment. The market is driven by a high correlation between consumer electronics and connected vehicle solutions, rising demand for smartphone integration, and a rise in the adoption of cloud technologies and IoT.
The in-vehicle computer system market analysis includes the application segment and geographic landscape.
Technavio's in-vehicle computer system market is segmented as below:
By Application
- Passenger Vehicles
- Commercial Vehicle
By Geographic
- North America
- Europe
- APAC
- South America
- Middle East and Africa
This study identifies the increased integration of smartphones as one of the prime reasons driving the in-vehicle computer system market growth during the next few years. Also, increasing innovation in OS and internet-of-things integration powered by ai technology for automotive will lead to sizable demand in the market.
- In-vehicle computer system market sizing
- In-vehicle computer system market forecast
- In-vehicle computer system market industry analysis
Technavio's robust vendor analysis is designed to help clients improve their market position, and in line with this, this report provides a detailed analysis of several leading in-vehicle computer system market vendors that include AAEON Technology Inc., Acrosser Technology Co. Ltd., ADLINK Technology Inc., American Portwell Technology Inc., Avalue Technology Inc., Axiomtek Co. Ltd., IBASE Technology Inc., IEI Integration Corp., JLT Mobile Computers AB, Lanner Electronics Inc., Neousys Technology Inc., NEXCOM International Co. Ltd., OnLogic Inc., Premio Inc., roda computer GmbH, S and T AG, SD OMEGA Co. Ltd., SINTRONES Technology Corp., WINSONIC ELECTRONICS CO. LTD., and ZF Friedrichshafen AG. Also, the in-vehicle computer system market analysis report includes information on upcoming trends and challenges that will influence market growth. This is to help companies strategize and leverage all forthcoming growth opportunities.
The study was conducted using an objective combination of primary and secondary information including inputs from key participants in the industry. The report contains a comprehensive market and vendor landscape in addition to an analysis of the key vendors.
Table of Contents
1 Executive Summary
- 1.1 Market overview
- Exhibit 01: Executive Summary - Chart on Market Overview
- Exhibit 02: Executive Summary - Data Table on Market Overview
- Exhibit 03: Executive Summary - Chart on Global Market Characteristics
- Exhibit 04: Executive Summary - Chart on Market By Geographical Landscape
- Exhibit 05: Executive Summary - Chart on Market Segmentation by Application
- Exhibit 06: Executive Summary - Chart on Incremental Growth
- Exhibit 07: Executive Summary - Data Table on Incremental Growth
- Exhibit 08: Executive Summary - Chart on Vendor Market Positioning
2 Market Landscape
- 2.1 Market ecosystem
- Exhibit 09: Parent market
- Exhibit 10: Market Characteristics
3 Market Sizing
- 3.1 Market definition
- Exhibit 11: Offerings of vendors included in the market definition
- 3.2 Market segment analysis
- Exhibit 12: Market segments
- 3.3 Market size 2021
- 3.4 Market outlook: Forecast for 2021-2026
- Exhibit 13: Chart on Global - Market size and forecast 2021-2026 ($ million)
- Exhibit 14: Data Table on Global - Market size and forecast 2021-2026 ($ million)
- Exhibit 15: Chart on Global Market: Year-over-year growth 2021-2026 (%)
- Exhibit 16: Data Table on Global Market: Year-over-year growth 2021-2026 (%)
4 Five Forces Analysis
- 4.1 Five forces summary
- Exhibit 17: Five forces analysis - Comparison between 2021 and 2026
- 4.2 Bargaining power of buyers
- Exhibit 18: Chart on Bargaining power of buyers - Impact of key factors 2021 and 2026
- 4.3 Bargaining power of suppliers
- Exhibit 19: Bargaining power of suppliers - Impact of key factors in 2021 and 2026
- 4.4 Threat of new entrants
- Exhibit 20: Threat of new entrants - Impact of key factors in 2021 and 2026
- 4.5 Threat of substitutes
- Exhibit 21: Threat of substitutes - Impact of key factors in 2021 and 2026
- 4.6 Threat of rivalry
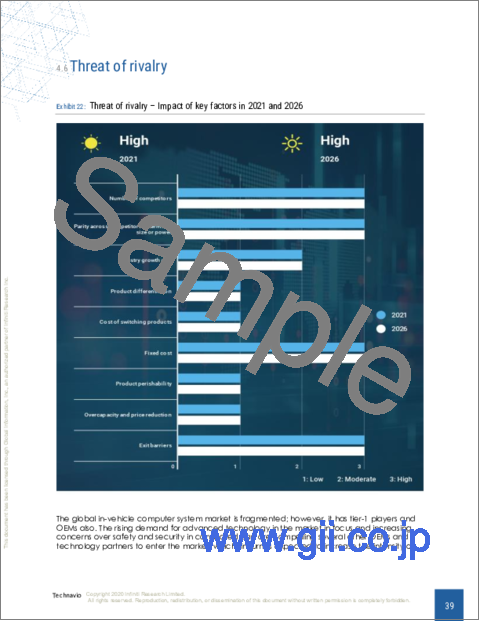
- Exhibit 22: Threat of rivalry - Impact of key factors in 2021 and 2026
- 4.7 Market condition
- Exhibit 23: Chart on Market condition - Five forces 2021 and 2026
5 Market Segmentation by Application
- 5.1 Market segments
- Exhibit 24: Chart on Application - Market share 2021-2026 (%)
- Exhibit 25: Data Table on Application - Market share 2021-2026 (%)
- 5.2 Comparison by Application
- Exhibit 26: Chart on Comparison by Application
- Exhibit 27: Data Table on Comparison by Application
- 5.3 Passenger vehicle - Market size and forecast 2021-2026
- Exhibit 28: Chart on Passenger vehicle - Market size and forecast 2021-2026 ($ million)
- Exhibit 29: Data Table on Passenger vehicle - Market size and forecast 2021-2026 ($ million)
- Exhibit 30: Chart on Passenger vehicle - Year-over-year growth 2021-2026 (%)
- Exhibit 31: Data Table on Passenger vehicle - Year-over-year growth 2021-2026 (%)
- 5.4 Commercial vehicle - Market size and forecast 2021-2026
- Exhibit 32: Chart on Commercial vehicle - Market size and forecast 2021-2026 ($ million)
- Exhibit 33: Data Table on Commercial vehicle - Market size and forecast 2021-2026 ($ million)
- Exhibit 34: Chart on Commercial vehicle - Year-over-year growth 2021-2026 (%)
- Exhibit 35: Data Table on Commercial vehicle - Year-over-year growth 2021-2026 (%)
- 5.5 Market opportunity by Application
- Exhibit 36: Market opportunity by Application ($ million)
6 Customer Landscape
- 6.1 Customer landscape overview
- Exhibit 37: Analysis of price sensitivity, lifecycle, customer purchase basket, adoption rates, and purchase criteria
7 Geographic Landscape
- 7.1 Geographic segmentation
- Exhibit 38: Chart on Market share By Geographical Landscape 2021-2026 (%)
- Exhibit 39: Data Table on Market share By Geographical Landscape 2021-2026 (%)
- 7.2 Geographic comparison
- Exhibit 40: Chart on Geographic comparison
- Exhibit 41: Data Table on Geographic comparison
- 7.3 North America - Market size and forecast 2021-2026
- Exhibit 42: Chart on North America - Market size and forecast 2021-2026 ($ million)
- Exhibit 43: Data Table on North America - Market size and forecast 2021-2026 ($ million)
- Exhibit 44: Chart on North America - Year-over-year growth 2021-2026 (%)
- Exhibit 45: Data Table on North America - Year-over-year growth 2021-2026 (%)
- 7.4 Europe - Market size and forecast 2021-2026
- Exhibit 46: Chart on Europe - Market size and forecast 2021-2026 ($ million)
- Exhibit 47: Data Table on Europe - Market size and forecast 2021-2026 ($ million)
- Exhibit 48: Chart on Europe - Year-over-year growth 2021-2026 (%)
- Exhibit 49: Data Table on Europe - Year-over-year growth 2021-2026 (%)
- 7.5 APAC - Market size and forecast 2021-2026
- Exhibit 50: Chart on APAC - Market size and forecast 2021-2026 ($ million)
- Exhibit 51: Data Table on APAC - Market size and forecast 2021-2026 ($ million)
- Exhibit 52: Chart on APAC - Year-over-year growth 2021-2026 (%)
- Exhibit 53: Data Table on APAC - Year-over-year growth 2021-2026 (%)
- 7.6 South America - Market size and forecast 2021-2026
- Exhibit 54: Chart on South America - Market size and forecast 2021-2026 ($ million)
- Exhibit 55: Data Table on South America - Market size and forecast 2021-2026 ($ million)
- Exhibit 56: Chart on South America - Year-over-year growth 2021-2026 (%)
- Exhibit 57: Data Table on South America - Year-over-year growth 2021-2026 (%)
- 7.7 Middle East and Africa - Market size and forecast 2021-2026
- Exhibit 58: Chart on Middle East and Africa - Market size and forecast 2021-2026 ($ million)
- Exhibit 59: Data Table on Middle East and Africa - Market size and forecast 2021-2026 ($ million)
- Exhibit 60: Chart on Middle East and Africa - Year-over-year growth 2021-2026 (%)
- Exhibit 61: Data Table on Middle East and Africa - Year-over-year growth 2021-2026 (%)
- 7.8 US - Market size and forecast 2021-2026
- Exhibit 62: Chart on US - Market size and forecast 2021-2026 ($ million)
- Exhibit 63: Data Table on US - Market size and forecast 2021-2026 ($ million)
- Exhibit 64: Chart on US - Year-over-year growth 2021-2026 (%)
- Exhibit 65: Data Table on US - Year-over-year growth 2021-2026 (%)
- 7.9 China - Market size and forecast 2021-2026
- Exhibit 66: Chart on China - Market size and forecast 2021-2026 ($ million)
- Exhibit 67: Data Table on China - Market size and forecast 2021-2026 ($ million)
- Exhibit 68: Chart on China - Year-over-year growth 2021-2026 (%)
- Exhibit 69: Data Table on China - Year-over-year growth 2021-2026 (%)
- 7.10 Germany - Market size and forecast 2021-2026
- Exhibit 70: Chart on Germany - Market size and forecast 2021-2026 ($ million)
- Exhibit 71: Data Table on Germany - Market size and forecast 2021-2026 ($ million)
- Exhibit 72: Chart on Germany - Year-over-year growth 2021-2026 (%)
- Exhibit 73: Data Table on Germany - Year-over-year growth 2021-2026 (%)
- 7.11 UK - Market size and forecast 2021-2026
- Exhibit 74: Chart on UK - Market size and forecast 2021-2026 ($ million)
- Exhibit 75: Data Table on UK - Market size and forecast 2021-2026 ($ million)
- Exhibit 76: Chart on UK - Year-over-year growth 2021-2026 (%)
- Exhibit 77: Data Table on UK - Year-over-year growth 2021-2026 (%)
- 7.12 France - Market size and forecast 2021-2026
- Exhibit 78: Chart on France - Market size and forecast 2021-2026 ($ million)
- Exhibit 79: Data Table on France - Market size and forecast 2021-2026 ($ million)
- Exhibit 80: Chart on France - Year-over-year growth 2021-2026 (%)
- Exhibit 81: Data Table on France - Year-over-year growth 2021-2026 (%)
- 7.13 Market opportunity By Geographical Landscape
- Exhibit 82: Market opportunity By Geographical Landscape ($ million)
8 Drivers, Challenges, and Trends
- 8.1 Market drivers
- 8.2 Market challenges
- 8.3 Impact of drivers and challenges
- Exhibit 83: Impact of drivers and challenges in 2021 and 2026
- 8.4 Market trends
9 Vendor Landscape
- 9.1 Overview
- 9.2 Vendor landscape
- Exhibit 84: Overview on Criticality of inputs and Factors of differentiation
- 9.3 Landscape disruption
- Exhibit 85: Overview on factors of disruption
- 9.4 Industry risks
- Exhibit 86: Impact of key risks on business
10 Vendor Analysis
- 10.1 Vendors covered
- Exhibit 87: Vendors covered
- 10.2 Market positioning of vendors
- Exhibit 88: Matrix on vendor position and classification
- 10.3 Acrosser Technology Co. Ltd.
- Exhibit 89: Acrosser Technology Co. Ltd. - Overview
- Exhibit 90: Acrosser Technology Co. Ltd. - Product / Service
- Exhibit 91: Acrosser Technology Co. Ltd. - Key offerings
- 10.4 American Portwell Technology Inc.
- Exhibit 92: American Portwell Technology Inc. - Overview
- Exhibit 93: American Portwell Technology Inc. - Product / Service
- Exhibit 94: American Portwell Technology Inc. - Key news
- Exhibit 95: American Portwell Technology Inc. - Key offerings
- 10.5 Axiomtek Co. Ltd.
- Exhibit 96: Axiomtek Co. Ltd. - Overview
- Exhibit 97: Axiomtek Co. Ltd. - Product / Service
- Exhibit 98: Axiomtek Co. Ltd. - Key offerings
- 10.6 IBASE Technology Inc.
- Exhibit 99: IBASE Technology Inc. - Overview
- Exhibit 100: IBASE Technology Inc. - Product / Service
- Exhibit 101: IBASE Technology Inc. - Key offerings
- 10.7 IEI Integration Corp.
- Exhibit 102: IEI Integration Corp. - Overview
- Exhibit 103: IEI Integration Corp. - Product / Service
- Exhibit 104: IEI Integration Corp. - Key news
- Exhibit 105: IEI Integration Corp. - Key offerings
- 10.8 Lanner Electronics Inc.
- Exhibit 106: Lanner Electronics Inc. - Overview
- Exhibit 107: Lanner Electronics Inc. - Product / Service
- Exhibit 108: Lanner Electronics Inc. - Key offerings
- 10.9 NEXCOM International Co. Ltd.
- Exhibit 109: NEXCOM International Co. Ltd. - Overview
- Exhibit 110: NEXCOM International Co. Ltd. - Product / Service
- Exhibit 111: NEXCOM International Co. Ltd. - Key offerings
- 10.10 Premio Inc.
- Exhibit 112: Premio Inc. - Overview
- Exhibit 113: Premio Inc. - Product / Service
- Exhibit 114: Premio Inc. - Key offerings
- 10.11 S and T AG
- Exhibit 115: S and T AG - Overview
- Exhibit 116: S and T AG - Business segments
- Exhibit 117: S and T AG - Key offerings
- Exhibit 118: S and T AG - Segment focus
- 10.12 SINTRONES Technology Corp.
- Exhibit 119: SINTRONES Technology Corp. - Overview
- Exhibit 120: SINTRONES Technology Corp. - Product / Service
- Exhibit 121: SINTRONES Technology Corp. - Key offerings
11 Appendix
- 11.1 Scope of the report
- 11.2 Inclusions and exclusions checklist
- Exhibit 122: Inclusions checklist
- Exhibit 123: Exclusions checklist
- 11.3 Currency conversion rates for US$
- Exhibit 124: Currency conversion rates for US$
- 11.4 Research methodology
- Exhibit 125: Research methodology
- Exhibit 126: Validation techniques employed for market sizing
- Exhibit 127: Information sources
- 11.5 List of abbreviations
- Exhibit 128: List of abbreviations