|
|
市場調査レポート
商品コード
1517251
ポリマーバインダーの世界市場 2024-2028Global polymer binder market 2024-2028 |
||||||

|
|||||||
カスタマイズ可能
|
|||||||


| ポリマーバインダーの世界市場 2024-2028 |
|
出版日: 2024年06月13日
発行: TechNavio
ページ情報: 英文 166 Pages
納期: 即納可能
|

全表示
- 概要
- 図表
- 目次
ポリマーバインダー市場は2023-2028年に126億1,240万米ドル、予測期間中のCAGRは8.51%で成長すると予測されます。
当レポートでは、ポリマーバインダー市場の全体的な分析、市場規模・予測、動向、成長促進要因、課題、約25のベンダーを網羅したベンダー分析などを掲載しています。
現在の市場シナリオ、最新動向と促進要因、市場環境全体に関する最新分析を提供しています。繊維産業の成長、新興国市場のポリマーバインダー需要の拡大、コーティング処方におけるポリマーバインダーの使用増加などが市場を牽引しています。
| 市場範囲 | |
|---|---|
| 基準年 | 2024 |
| 終了年 | 2028 |
| 予測期間 | 2024-2028 |
| 成長モメンタム | 加速 |
| 前年比2024年 | 7.67% |
| CAGR | 8.51% |
| 増分額 | 126億1,240万米ドル |
本調査では、ポリマーバインダーベンダーの垂直統合志向の高まりが、今後数年間のポリマーバインダー市場成長を牽引する主要因の1つであると分析しています。また、研究開発活動の増加やリチウムポリマー電池の需要拡大も市場の大きな需要につながります。
目次
第1章 エグゼクティブサマリー
- 市場概要
第2章 市場情勢
- 市場エコシステム
- 市場の特徴
- バリューチェーン分析
第3章 市場規模の評価
- 市場の定義
- 市場セグメント分析
- 市場規模 2023
- 市場の見通し 2023-2028
第4章 市場規模実績
- 世界ポリマーバインダー市場 2018-2022
- 用途別セグメント分析 2018-2022
- 地域別セグメント分析 2018-2022
- 国別セグメント分析 2018-2022
第5章 ファイブフォース分析
- ファイブフォースの要約
- 買い手の交渉力
- 供給企業の交渉力
- 新規参入業者の脅威
- 代替品の脅威
- 競争の脅威
- 市況
第6章 市場セグメンテーション:用途別
- 市場セグメンテーション
- 比較:用途別
- 建築用コーティング:市場規模と予測 2023-2028
- 接着剤およびシーラント:市場規模と予測 2023-2028
- 繊維およびカーペット:市場規模と予測 2023-2028
- 紙と板紙:市場規模と予測 2023-2028
- その他:市場規模と予測 2023-2028
- 市場機会:用途別
第7章 顧客情勢
- 顧客情勢の概要
第8章 地域別情勢
- 地域別セグメンテーション
- 地域別比較
- アジア太平洋:市場規模と予測 2023-2028
- 欧州:市場規模と予測 2023-2028
- 北米:市場規模と予測 2023-2028
- 中東・アフリカ:市場規模と予測 2023-2028
- 南米:市場規模と予測 2023-2028
- 中国:市場規模と予測 2023-2028
- 米国:市場規模と予測 2023-2028
- 日本:市場規模と予測 2023-2028
- ドイツ:市場規模と予測 2023-2028
- 韓国:市場規模と予測 2023-2028
- イタリア:市場規模と予測 2023-2028
- 市場機会:地域情勢別
第9章 促進要因・課題・機会・抑制要因
- 市場促進要因
- 市場の課題
- 促進要因と課題の影響
- 市場の機会・抑制要因
第10章 競合情勢
- 概要
- 競合情勢
- 混乱の状況
- 業界のリスク
第11章 競合分析
- 企業プロファイル
- 企業の市場ポジショニング
- Arkema Group
- BASF SE
- Celanese Corp.
- CH Polymers Oy
- Chang Chun Group
- D and L Industries Inc.
- Shandong Hearst Building Material Co. Ltd.
- Synthomer Plc
- Dow Chemical Co.
- Wacker Chemie AG
第12章 付録
Exhibits:
- Exhibits1: Executive Summary - Chart on Market Overview
- Exhibits2: Executive Summary - Data Table on Market Overview
- Exhibits3: Executive Summary - Chart on Global Market Characteristics
- Exhibits4: Executive Summary - Chart on Market By Geographical Landscape
- Exhibits5: Executive Summary - Chart on Market Segmentation by Application
- Exhibits6: Executive Summary - Chart on Incremental Growth
- Exhibits7: Executive Summary - Data Table on Incremental Growth
- Exhibits8: Executive Summary - Chart on Company Market Positioning
- Exhibits9: Parent Market
- Exhibits10: Data Table on - Parent Market
- Exhibits11: Market characteristics analysis
- Exhibits12: Value Chain Analysis
- Exhibits13: Offerings of companies included in the market definition
- Exhibits14: Market segments
- Exhibits15: Chart on Global - Market size and forecast 2023-2028 ($ million)
- Exhibits16: Data Table on Global - Market size and forecast 2023-2028 ($ million)
- Exhibits17: Chart on Global Market: Year-over-year growth 2023-2028 (%)
- Exhibits18: Data Table on Global Market: Year-over-year growth 2023-2028 (%)
- Exhibits19: Historic Market Size - Data Table on Global Polymer Binder Market 2018 - 2022 ($ million)
- Exhibits20: Historic Market Size - Application Segment 2018 - 2022 ($ million)
- Exhibits21: Historic Market Size - Geography Segment 2018 - 2022 ($ million)
- Exhibits22: Historic Market Size - Country Segment 2018 - 2022 ($ million)
- Exhibits23: Five forces analysis - Comparison between 2023 and 2028
- Exhibits24: Bargaining power of buyers - Impact of key factors 2023 and 2028
- Exhibits25: Bargaining power of suppliers - Impact of key factors in 2023 and 2028
- Exhibits26: Threat of new entrants - Impact of key factors in 2023 and 2028
- Exhibits27: Threat of substitutes - Impact of key factors in 2023 and 2028
- Exhibits28: Threat of rivalry - Impact of key factors in 2023 and 2028
- Exhibits29: Chart on Market condition - Five forces 2023 and 2028
- Exhibits30: Chart on Application - Market share 2023-2028 (%)
- Exhibits31: Data Table on Application - Market share 2023-2028 (%)
- Exhibits32: Chart on Comparison by Application
- Exhibits33: Data Table on Comparison by Application
- Exhibits34: Chart on Architectural coatings - Market size and forecast 2023-2028 ($ million)
- Exhibits35: Data Table on Architectural coatings - Market size and forecast 2023-2028 ($ million)
- Exhibits36: Chart on Architectural coatings - Year-over-year growth 2023-2028 (%)
- Exhibits37: Data Table on Architectural coatings - Year-over-year growth 2023-2028 (%)
- Exhibits38: Chart on Adhesives and sealants - Market size and forecast 2023-2028 ($ million)
- Exhibits39: Data Table on Adhesives and sealants - Market size and forecast 2023-2028 ($ million)
- Exhibits40: Chart on Adhesives and sealants - Year-over-year growth 2023-2028 (%)
- Exhibits41: Data Table on Adhesives and sealants - Year-over-year growth 2023-2028 (%)
- Exhibits42: Chart on Textile and carpets - Market size and forecast 2023-2028 ($ million)
- Exhibits43: Data Table on Textile and carpets - Market size and forecast 2023-2028 ($ million)
- Exhibits44: Chart on Textile and carpets - Year-over-year growth 2023-2028 (%)
- Exhibits45: Data Table on Textile and carpets - Year-over-year growth 2023-2028 (%)
- Exhibits46: Chart on Paper and board - Market size and forecast 2023-2028 ($ million)
- Exhibits47: Data Table on Paper and board - Market size and forecast 2023-2028 ($ million)
- Exhibits48: Chart on Paper and board - Year-over-year growth 2023-2028 (%)
- Exhibits49: Data Table on Paper and board - Year-over-year growth 2023-2028 (%)
- Exhibits50: Chart on Others - Market size and forecast 2023-2028 ($ million)
- Exhibits51: Data Table on Others - Market size and forecast 2023-2028 ($ million)
- Exhibits52: Chart on Others - Year-over-year growth 2023-2028 (%)
- Exhibits53: Data Table on Others - Year-over-year growth 2023-2028 (%)
- Exhibits54: Market opportunity by Application ($ million)
- Exhibits55: Data Table on Market opportunity by Application ($ million)
- Exhibits56: Analysis of price sensitivity, lifecycle, customer purchase basket, adoption rates, and purchase criteria
- Exhibits57: Chart on Market share By Geographical Landscape 2023-2028 (%)
- Exhibits58: Data Table on Market share By Geographical Landscape 2023-2028 (%)
- Exhibits59: Chart on Geographic comparison
- Exhibits60: Data Table on Geographic comparison
- Exhibits61: Chart on APAC - Market size and forecast 2023-2028 ($ million)
- Exhibits62: Data Table on APAC - Market size and forecast 2023-2028 ($ million)
- Exhibits63: Chart on APAC - Year-over-year growth 2023-2028 (%)
- Exhibits64: Data Table on APAC - Year-over-year growth 2023-2028 (%)
- Exhibits65: Chart on Europe - Market size and forecast 2023-2028 ($ million)
- Exhibits66: Data Table on Europe - Market size and forecast 2023-2028 ($ million)
- Exhibits67: Chart on Europe - Year-over-year growth 2023-2028 (%)
- Exhibits68: Data Table on Europe - Year-over-year growth 2023-2028 (%)
- Exhibits69: Chart on North America - Market size and forecast 2023-2028 ($ million)
- Exhibits70: Data Table on North America - Market size and forecast 2023-2028 ($ million)
- Exhibits71: Chart on North America - Year-over-year growth 2023-2028 (%)
- Exhibits72: Data Table on North America - Year-over-year growth 2023-2028 (%)
- Exhibits73: Chart on Middle East and Africa - Market size and forecast 2023-2028 ($ million)
- Exhibits74: Data Table on Middle East and Africa - Market size and forecast 2023-2028 ($ million)
- Exhibits75: Chart on Middle East and Africa - Year-over-year growth 2023-2028 (%)
- Exhibits76: Data Table on Middle East and Africa - Year-over-year growth 2023-2028 (%)
- Exhibits77: Chart on South America - Market size and forecast 2023-2028 ($ million)
- Exhibits78: Data Table on South America - Market size and forecast 2023-2028 ($ million)
- Exhibits79: Chart on South America - Year-over-year growth 2023-2028 (%)
- Exhibits80: Data Table on South America - Year-over-year growth 2023-2028 (%)
- Exhibits81: Chart on China - Market size and forecast 2023-2028 ($ million)
- Exhibits82: Data Table on China - Market size and forecast 2023-2028 ($ million)
- Exhibits83: Chart on China - Year-over-year growth 2023-2028 (%)
- Exhibits84: Data Table on China - Year-over-year growth 2023-2028 (%)
- Exhibits85: Chart on US - Market size and forecast 2023-2028 ($ million)
- Exhibits86: Data Table on US - Market size and forecast 2023-2028 ($ million)
- Exhibits87: Chart on US - Year-over-year growth 2023-2028 (%)
- Exhibits88: Data Table on US - Year-over-year growth 2023-2028 (%)
- Exhibits89: Chart on Japan - Market size and forecast 2023-2028 ($ million)
- Exhibits90: Data Table on Japan - Market size and forecast 2023-2028 ($ million)
- Exhibits91: Chart on Japan - Year-over-year growth 2023-2028 (%)
- Exhibits92: Data Table on Japan - Year-over-year growth 2023-2028 (%)
- Exhibits93: Chart on Germany - Market size and forecast 2023-2028 ($ million)
- Exhibits94: Data Table on Germany - Market size and forecast 2023-2028 ($ million)
- Exhibits95: Chart on Germany - Year-over-year growth 2023-2028 (%)
- Exhibits96: Data Table on Germany - Year-over-year growth 2023-2028 (%)
- Exhibits97: Chart on South Korea - Market size and forecast 2023-2028 ($ million)
- Exhibits98: Data Table on South Korea - Market size and forecast 2023-2028 ($ million)
- Exhibits99: Chart on South Korea - Year-over-year growth 2023-2028 (%)
- Exhibits100: Data Table on South Korea - Year-over-year growth 2023-2028 (%)
- Exhibits101: Chart on Italy - Market size and forecast 2023-2028 ($ million)
- Exhibits102: Data Table on Italy - Market size and forecast 2023-2028 ($ million)
- Exhibits103: Chart on Italy - Year-over-year growth 2023-2028 (%)
- Exhibits104: Data Table on Italy - Year-over-year growth 2023-2028 (%)
- Exhibits105: Market opportunity By Geographical Landscape ($ million)
- Exhibits106: Data Tables on Market opportunity By Geographical Landscape ($ million)
- Exhibits107: Impact of drivers and challenges in 2023 and 2028
- Exhibits108: Overview on criticality of inputs and factors of differentiation
- Exhibits109: Overview on factors of disruption
- Exhibits110: Impact of key risks on business
- Exhibits111: Companies covered
- Exhibits112: Matrix on companies position and classification
- Exhibits113: Arkema Group - Overview
- Exhibits114: Arkema Group - Business segments
- Exhibits115: Arkema Group - Key news
- Exhibits116: Arkema Group - Key offerings
- Exhibits117: Arkema Group - Segment focus
- Exhibits118: BASF SE - Overview
- Exhibits119: BASF SE - Business segments
- Exhibits120: BASF SE - Key news
- Exhibits121: BASF SE - Key offerings
- Exhibits122: BASF SE - Segment focus
- Exhibits123: Celanese Corp. - Overview
- Exhibits124: Celanese Corp. - Business segments
- Exhibits125: Celanese Corp. - Key news
- Exhibits126: Celanese Corp. - Key offerings
- Exhibits127: Celanese Corp. - Segment focus
- Exhibits128: CH Polymers Oy - Overview
- Exhibits129: CH Polymers Oy - Product / Service
- Exhibits130: CH Polymers Oy - Key offerings
- Exhibits131: Chang Chun Group - Overview
- Exhibits132: Chang Chun Group - Product / Service
- Exhibits133: Chang Chun Group - Key offerings
- Exhibits134: D and L Industries Inc. - Overview
- Exhibits135: D and L Industries Inc. - Business segments
- Exhibits136: D and L Industries Inc. - Key offerings
- Exhibits137: D and L Industries Inc. - Segment focus
- Exhibits138: Shandong Hearst Building Material Co. Ltd. - Overview
- Exhibits139: Shandong Hearst Building Material Co. Ltd. - Product / Service
- Exhibits140: Shandong Hearst Building Material Co. Ltd. - Key offerings
- Exhibits141: Synthomer Plc - Overview
- Exhibits142: Synthomer Plc - Business segments
- Exhibits143: Synthomer Plc - Key news
- Exhibits144: Synthomer Plc - Key offerings
- Exhibits145: Synthomer Plc - Segment focus
- Exhibits146: Dow Chemical Co. - Overview
- Exhibits147: Dow Chemical Co. - Business segments
- Exhibits148: Dow Chemical Co. - Key news
- Exhibits149: Dow Chemical Co. - Key offerings
- Exhibits150: Dow Chemical Co. - Segment focus
- Exhibits151: Wacker Chemie AG - Overview
- Exhibits152: Wacker Chemie AG - Business segments
- Exhibits153: Wacker Chemie AG - Key news
- Exhibits154: Wacker Chemie AG - Key offerings
- Exhibits155: Wacker Chemie AG - Segment focus
- Exhibits156: Inclusions checklist
- Exhibits157: Exclusions checklist
- Exhibits158: Currency conversion rates for US$
- Exhibits159: Research methodology
- Exhibits160: Information sources
- Exhibits161: Data validation
- Exhibits162: Validation techniques employed for market sizing
- Exhibits163: Data synthesis
- Exhibits164: 360 degree market analysis
- Exhibits165: List of abbreviations
The polymer binder market is forecasted to grow by USD 12612.4 mn during 2023-2028, accelerating at a CAGR of 8.51% during the forecast period. The report on the polymer binder market provides a holistic analysis, market size and forecast, trends, growth drivers, and challenges, as well as vendor analysis covering around 25 vendors.
The report offers an up-to-date analysis regarding the current market scenario, the latest trends and drivers, and the overall market environment. The market is driven by growth in textile industry, growing demand for polymer binders from developing countries, and increasing use of polymer binders in coating formulation.
Technavio's polymer binder market is segmented as below:
| Market Scope | |
|---|---|
| Base Year | 2024 |
| End Year | 2028 |
| Series Year | 2024-2028 |
| Growth Momentum | Accelerate |
| YOY 2024 | 7.67% |
| CAGR | 8.51% |
| Incremental Value | $12612.4mn |
By Application
- Architectural coatings
- Adhesives and sealants
- Textile and carpets
- Paper and board
- Others
By Geographical Landscape
- APAC
- Europe
- North America
- Middle East and Africa
- South America
This study identifies the increase in preference for vertical integration among polymer binder vendors as one of the prime reasons driving the polymer binder market growth during the next few years. Also, increase in r&d activities and growing demand for lithium polymer batteries will lead to sizable demand in the market.
The report on the polymer binder market covers the following areas:
- Polymer binder market sizing
- Polymer binder market forecast
- Polymer binder market industry analysis
The robust vendor analysis is designed to help clients improve their market position, and in line with this, this report provides a detailed analysis of several leading polymer binder market vendors that include Arkema Group, APL, BASF SE, Celanese Corp., CH Polymers Oy, Chang Chun Group, D and L Industries Inc., Jesons Industries Ltd, Mayfair Biotech Pvt. Ltd., OMNOVA Solutions Inc., Shandong Hearst Building Material Co. Ltd., Stahl Holdings B.V., Synthomer Plc, Dow Chemical Co., Toagosei Co. Ltd., Trinseo PLC, Visen Industries Ltd., Wacker Chemie AG, and Zydex Inc.. Also, the polymer binder market analysis report includes information on upcoming trends and challenges that will influence market growth. This is to help companies strategize and leverage all forthcoming growth opportunities.
The study was conducted using an objective combination of primary and secondary information including inputs from key participants in the industry. The report contains a comprehensive market and vendor landscape in addition to an analysis of the key vendors.
The publisher presents a detailed picture of the market by the way of study, synthesis, and summation of data from multiple sources by an analysis of key parameters such as profit, pricing, competition, and promotions. It presents various market facets by identifying the key industry influencers. The data presented is comprehensive, reliable, and a result of extensive research - both primary and secondary. The market research reports provide a complete competitive landscape and an in-depth vendor selection methodology and analysis using qualitative and quantitative research to forecast the accurate market growth.
Table of Contents
1 Executive Summary
- 1.1 Market overview
- Executive Summary - Chart on Market Overview
- Executive Summary - Data Table on Market Overview
- Executive Summary - Chart on Global Market Characteristics
- Executive Summary - Chart on Market By Geographical Landscape
- Executive Summary - Chart on Market Segmentation by Application
- Executive Summary - Chart on Incremental Growth
- Executive Summary - Data Table on Incremental Growth
- Executive Summary - Chart on Company Market Positioning
2 Market Landscape
- 2.1 Market ecosystem
- Parent Market
- Data Table on - Parent Market
- 2.2 Market characteristics
- Market characteristics analysis
- 2.3 Value chain analysis
- Value Chain Analysis
3 Market Sizing
- 3.1 Market definition
- Offerings of companies included in the market definition
- 3.2 Market segment analysis
- Market segments
- 3.3 Market size 2023
- 3.4 Market outlook: Forecast for 2023-2028
- Chart on Global - Market size and forecast 2023-2028 ($ million)
- Data Table on Global - Market size and forecast 2023-2028 ($ million)
- Chart on Global Market: Year-over-year growth 2023-2028 (%)
- Data Table on Global Market: Year-over-year growth 2023-2028 (%)
4 Historic Market Size
- 4.1 Global Polymer Binder Market 2018 - 2022
- Historic Market Size - Data Table on Global Polymer Binder Market 2018 - 2022 ($ million)
- 4.2 Application segment analysis 2018 - 2022
- Historic Market Size - Application Segment 2018 - 2022 ($ million)
- 4.3 Geography segment analysis 2018 - 2022
- Historic Market Size - Geography Segment 2018 - 2022 ($ million)
- 4.4 Country segment analysis 2018 - 2022
- Historic Market Size - Country Segment 2018 - 2022 ($ million)
5 Five Forces Analysis
- 5.1 Five forces summary
- Five forces analysis - Comparison between 2023 and 2028
- 5.2 Bargaining power of buyers
- Bargaining power of buyers - Impact of key factors 2023 and 2028
- 5.3 Bargaining power of suppliers
- Bargaining power of suppliers - Impact of key factors in 2023 and 2028
- 5.4 Threat of new entrants
- Threat of new entrants - Impact of key factors in 2023 and 2028
- 5.5 Threat of substitutes
- Threat of substitutes - Impact of key factors in 2023 and 2028
- 5.6 Threat of rivalry
- Threat of rivalry - Impact of key factors in 2023 and 2028
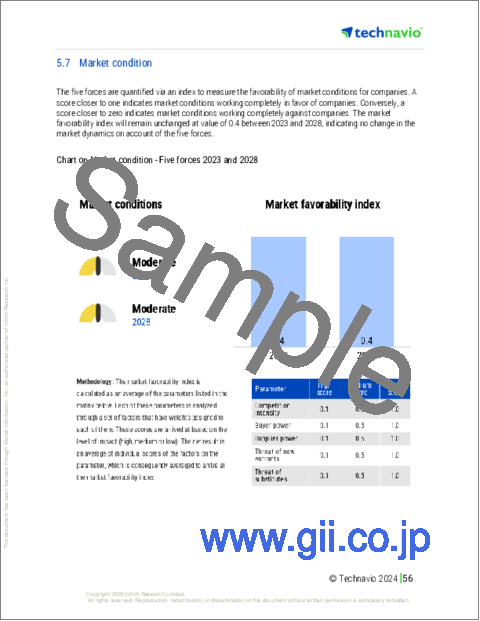
- 5.7 Market condition
- Chart on Market condition - Five forces 2023 and 2028
6 Market Segmentation by Application
- 6.1 Market segments
- Chart on Application - Market share 2023-2028 (%)
- Data Table on Application - Market share 2023-2028 (%)
- 6.2 Comparison by Application
- Chart on Comparison by Application
- Data Table on Comparison by Application
- 6.3 Architectural coatings - Market size and forecast 2023-2028
- Chart on Architectural coatings - Market size and forecast 2023-2028 ($ million)
- Data Table on Architectural coatings - Market size and forecast 2023-2028 ($ million)
- Chart on Architectural coatings - Year-over-year growth 2023-2028 (%)
- Data Table on Architectural coatings - Year-over-year growth 2023-2028 (%)
- 6.4 Adhesives and sealants - Market size and forecast 2023-2028
- Chart on Adhesives and sealants - Market size and forecast 2023-2028 ($ million)
- Data Table on Adhesives and sealants - Market size and forecast 2023-2028 ($ million)
- Chart on Adhesives and sealants - Year-over-year growth 2023-2028 (%)
- Data Table on Adhesives and sealants - Year-over-year growth 2023-2028 (%)
- 6.5 Textile and carpets - Market size and forecast 2023-2028
- Chart on Textile and carpets - Market size and forecast 2023-2028 ($ million)
- Data Table on Textile and carpets - Market size and forecast 2023-2028 ($ million)
- Chart on Textile and carpets - Year-over-year growth 2023-2028 (%)
- Data Table on Textile and carpets - Year-over-year growth 2023-2028 (%)
- 6.6 Paper and board - Market size and forecast 2023-2028
- Chart on Paper and board - Market size and forecast 2023-2028 ($ million)
- Data Table on Paper and board - Market size and forecast 2023-2028 ($ million)
- Chart on Paper and board - Year-over-year growth 2023-2028 (%)
- Data Table on Paper and board - Year-over-year growth 2023-2028 (%)
- 6.7 Others - Market size and forecast 2023-2028
- Chart on Others - Market size and forecast 2023-2028 ($ million)
- Data Table on Others - Market size and forecast 2023-2028 ($ million)
- Chart on Others - Year-over-year growth 2023-2028 (%)
- Data Table on Others - Year-over-year growth 2023-2028 (%)
- 6.8 Market opportunity by Application
- Market opportunity by Application ($ million)
- Data Table on Market opportunity by Application ($ million)
7 Customer Landscape
- 7.1 Customer landscape overview
- Analysis of price sensitivity, lifecycle, customer purchase basket, adoption rates, and purchase criteria
8 Geographic Landscape
- 8.1 Geographic segmentation
- Chart on Market share By Geographical Landscape 2023-2028 (%)
- Data Table on Market share By Geographical Landscape 2023-2028 (%)
- 8.2 Geographic comparison
- Chart on Geographic comparison
- Data Table on Geographic comparison
- 8.3 APAC - Market size and forecast 2023-2028
- Chart on APAC - Market size and forecast 2023-2028 ($ million)
- Data Table on APAC - Market size and forecast 2023-2028 ($ million)
- Chart on APAC - Year-over-year growth 2023-2028 (%)
- Data Table on APAC - Year-over-year growth 2023-2028 (%)
- 8.4 Europe - Market size and forecast 2023-2028
- Chart on Europe - Market size and forecast 2023-2028 ($ million)
- Data Table on Europe - Market size and forecast 2023-2028 ($ million)
- Chart on Europe - Year-over-year growth 2023-2028 (%)
- Data Table on Europe - Year-over-year growth 2023-2028 (%)
- 8.5 North America - Market size and forecast 2023-2028
- Chart on North America - Market size and forecast 2023-2028 ($ million)
- Data Table on North America - Market size and forecast 2023-2028 ($ million)
- Chart on North America - Year-over-year growth 2023-2028 (%)
- Data Table on North America - Year-over-year growth 2023-2028 (%)
- 8.6 Middle East and Africa - Market size and forecast 2023-2028
- Chart on Middle East and Africa - Market size and forecast 2023-2028 ($ million)
- Data Table on Middle East and Africa - Market size and forecast 2023-2028 ($ million)
- Chart on Middle East and Africa - Year-over-year growth 2023-2028 (%)
- Data Table on Middle East and Africa - Year-over-year growth 2023-2028 (%)
- 8.7 South America - Market size and forecast 2023-2028
- Chart on South America - Market size and forecast 2023-2028 ($ million)
- Data Table on South America - Market size and forecast 2023-2028 ($ million)
- Chart on South America - Year-over-year growth 2023-2028 (%)
- Data Table on South America - Year-over-year growth 2023-2028 (%)
- 8.8 China - Market size and forecast 2023-2028
- Chart on China - Market size and forecast 2023-2028 ($ million)
- Data Table on China - Market size and forecast 2023-2028 ($ million)
- Chart on China - Year-over-year growth 2023-2028 (%)
- Data Table on China - Year-over-year growth 2023-2028 (%)
- 8.9 US - Market size and forecast 2023-2028
- Chart on US - Market size and forecast 2023-2028 ($ million)
- Data Table on US - Market size and forecast 2023-2028 ($ million)
- Chart on US - Year-over-year growth 2023-2028 (%)
- Data Table on US - Year-over-year growth 2023-2028 (%)
- 8.10 Japan - Market size and forecast 2023-2028
- Chart on Japan - Market size and forecast 2023-2028 ($ million)
- Data Table on Japan - Market size and forecast 2023-2028 ($ million)
- Chart on Japan - Year-over-year growth 2023-2028 (%)
- Data Table on Japan - Year-over-year growth 2023-2028 (%)
- 8.11 Germany - Market size and forecast 2023-2028
- Chart on Germany - Market size and forecast 2023-2028 ($ million)
- Data Table on Germany - Market size and forecast 2023-2028 ($ million)
- Chart on Germany - Year-over-year growth 2023-2028 (%)
- Data Table on Germany - Year-over-year growth 2023-2028 (%)
- 8.12 South Korea - Market size and forecast 2023-2028
- Chart on South Korea - Market size and forecast 2023-2028 ($ million)
- Data Table on South Korea - Market size and forecast 2023-2028 ($ million)
- Chart on South Korea - Year-over-year growth 2023-2028 (%)
- Data Table on South Korea - Year-over-year growth 2023-2028 (%)
- 8.13 Italy - Market size and forecast 2023-2028
- Chart on Italy - Market size and forecast 2023-2028 ($ million)
- Data Table on Italy - Market size and forecast 2023-2028 ($ million)
- Chart on Italy - Year-over-year growth 2023-2028 (%)
- Data Table on Italy - Year-over-year growth 2023-2028 (%)
- 8.14 Market opportunity By Geographical Landscape
- Market opportunity By Geographical Landscape ($ million)
- Data Tables on Market opportunity By Geographical Landscape ($ million)
9 Drivers, Challenges, and Opportunity/Restraints
- 9.1 Market drivers
- 9.2 Market challenges
- 9.3 Impact of drivers and challenges
- Impact of drivers and challenges in 2023 and 2028
- 9.4 Market opportunities/restraints
10 Competitive Landscape
- 10.1 Overview
- 10.2 Competitive Landscape
- Overview on criticality of inputs and factors of differentiation
- 10.3 Landscape disruption
- Overview on factors of disruption
- 10.4 Industry risks
- Impact of key risks on business
11 Competitive Analysis
- 11.1 Companies profiled
- Companies covered
- 11.2 Market positioning of companies
- Matrix on companies position and classification
- 11.3 Arkema Group
- Arkema Group - Overview
- Arkema Group - Business segments
- Arkema Group - Key news
- Arkema Group - Key offerings
- Arkema Group - Segment focus
- 11.4 BASF SE
- BASF SE - Overview
- BASF SE - Business segments
- BASF SE - Key news
- BASF SE - Key offerings
- BASF SE - Segment focus
- 11.5 Celanese Corp.
- Celanese Corp. - Overview
- Celanese Corp. - Business segments
- Celanese Corp. - Key news
- Celanese Corp. - Key offerings
- Celanese Corp. - Segment focus
- 11.6 CH Polymers Oy
- CH Polymers Oy - Overview
- CH Polymers Oy - Product / Service
- CH Polymers Oy - Key offerings
- 11.7 Chang Chun Group
- Chang Chun Group - Overview
- Chang Chun Group - Product / Service
- Chang Chun Group - Key offerings
- 11.8 D and L Industries Inc.
- D and L Industries Inc. - Overview
- D and L Industries Inc. - Business segments
- D and L Industries Inc. - Key offerings
- D and L Industries Inc. - Segment focus
- 11.9 Shandong Hearst Building Material Co. Ltd.
- Shandong Hearst Building Material Co. Ltd. - Overview
- Shandong Hearst Building Material Co. Ltd. - Product / Service
- Shandong Hearst Building Material Co. Ltd. - Key offerings
- 11.10 Synthomer Plc
- Synthomer Plc - Overview
- Synthomer Plc - Business segments
- Synthomer Plc - Key news
- Synthomer Plc - Key offerings
- Synthomer Plc - Segment focus
- 11.11 Dow Chemical Co.
- Dow Chemical Co. - Overview
- Dow Chemical Co. - Business segments
- Dow Chemical Co. - Key news
- Dow Chemical Co. - Key offerings
- Dow Chemical Co. - Segment focus
- 11.12 Wacker Chemie AG
- Wacker Chemie AG - Overview
- Wacker Chemie AG - Business segments
- Wacker Chemie AG - Key news
- Wacker Chemie AG - Key offerings
- Wacker Chemie AG - Segment focus
12 Appendix
- 12.1 Scope of the report
- 12.2 Inclusions and exclusions checklist
- Inclusions checklist
- Exclusions checklist
- 12.3 Currency conversion rates for US$
- Currency conversion rates for US$
- 12.4 Research methodology
- Research methodology
- 12.5 Data procurement
- Information sources
- 12.6 Data validation
- Data validation
- 12.7 Validation techniques employed for market sizing
- Validation techniques employed for market sizing
- 12.8 Data synthesis
- Data synthesis
- 12.9 360 degree market analysis
- 360 degree market analysis
- 12.10 List of abbreviations
- List of abbreviations

