|
|
市場調査レポート
商品コード
1132215
スマートフォン向けセンサーの世界市場 2022-2026Global Sensors Market for Smartphones 2022-2026 |
||||||
|
|
|||||||
|
● お客様のご希望に応じて、既存データの加工や未掲載情報(例:国別セグメント)の追加などの対応が可能です。 詳細はお問い合わせください。 |
|||||||


| スマートフォン向けセンサーの世界市場 2022-2026 |
|
出版日: 2022年09月01日
発行: TechNavio
ページ情報: 英文 120 Pages
納期: 即納可能
|
- 全表示
- 概要
- 図表
- 目次
当レポートによるとスマートフォン向けセンサーの市場規模は、2022年から2026年の間に5億7829万米ドル増加する見通しで、予測期間中にCAGR1.99%で成長すると予測しています。
当レポートでは、スマートフォン向けセンサー市場の全体分析、市場規模と予測、動向、成長促進要因・課題、約25社のベンダーを網羅したベンダー分析などをお届けします。
また、現在の世界の市場動向と促進要因、市場全体の環境について最新の分析を提供しています。市場は、企業によるモバイルARアプリケーションの導入の増加、カメラモジュールにおけるCMOSセンサーの使用、プレミアムレンジのスマートフォンにおけるより多くのセンサーの統合によって牽引されています。
本調査では、センサーフュージョン技術の出現が、今後数年間のスマートフォン向けセンサー市場の成長を促進する主要な理由の1つであると位置付けています。また、複数レンズのカメラモジュールの普及とM&A件数の増加は、市場の大規模な需要につながるでしょう。
目次
第1章 エグゼクティブサマリー
- 市場概要
第2章 市場情勢
- 市場エコシステム
第3章 市場規模
- 市場の定義
- 市場セグメント分析
- 市場規模 2021
- 市場の見通し:2021-2026年の予測
第4章 ファイブフォース分析
- ファイブフォースの要約
- 買い手の交渉力
- 供給企業の交渉力
- 新規参入業者の脅威
- 代替品の脅威
- 競争の脅威
- 市況
第5章 価格別市場セグメンテーション
- 市場内訳
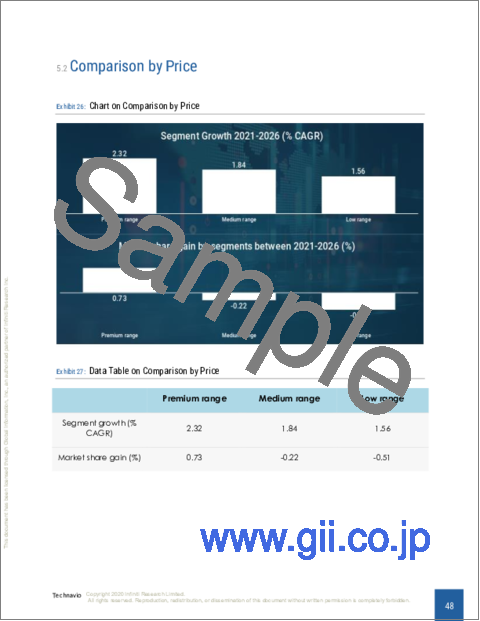
- 価格別比較
- プレミアム価格帯 - 市場規模と予測 2021-2026
- 中価格帯 - 市場規模と予測 2021-2026
- 低価格帯 - 市場規模と予測 2021-2026
- 価格別の市場機会
第6章 顧客情勢
- 顧客情勢の概要
第7章 地域別情勢
- 地域別セグメンテーション
- 地域別比較
- APAC - 市場規模と予測 2021-2026
- 北米 - 市場規模と予測 2021-2026
- 欧州 - 市場規模と予測 2021-2026
- 南米 - 市場規模と予測 2021-2026
- 中東およびアフリカ - 市場規模と予測 2021-2026
- 中国 - 市場規模と予測 2021-2026
- 韓国 - 市場規模と予測 2021-2026
- 米国 - 市場規模と予測 2021-2026
- 日本 - 市場規模と予測 2021-2026
- 台湾 - 市場規模と予測 2021-2026
- 地域情勢別の市場機会
第8章 促進要因、課題、および動向
- 市場促進要因
- 市場の課題
- 促進要因と課題の影響
- 市場動向
第9章 ベンダー情勢
- 概要
- ベンダー情勢
- 混乱の状況
- 業界のリスク
第10章 ベンダー分析
- 対象ベンダー
- ベンダーの市場ポジショニング
- Alps Alpine Co. Ltd
- ams AG
- Fujitsu Ltd.
- Murata Manufacturing Co. Ltd.
- OMNIVISION Technologies Inc.
- Panasonic Corp
- Qualcomm Inc.
- Robert Bosch GmbH
- Samsung Electronics Co. Ltd.
- STMicroelectronics NV
第11章 付録
Exhibits:
- Exhibits1: Executive Summary - Chart on Market Overview
- Exhibits2: Executive Summary - Data Table on Market Overview
- Exhibits3: Executive Summary - Chart on Global Market Characteristics
- Exhibits4: Executive Summary - Chart on Market By Geographical Landscape
- Exhibits5: Executive Summary - Chart on Market Segmentation by Price
- Exhibits6: Executive Summary - Chart on Incremental Growth
- Exhibits7: Executive Summary - Data Table on Incremental Growth
- Exhibits8: Executive Summary - Chart on Vendor Market Positioning
- Exhibits9: Parent market
- Exhibits10: Market Characteristics
- Exhibits11: Offerings of vendors included in the market definition
- Exhibits12: Market segments
- Exhibits13: Chart on Global - Market size and forecast 2021-2026 ($ million)
- Exhibits14: Data Table on Global - Market size and forecast 2021-2026 ($ million)
- Exhibits15: Chart on Global Market: Year-over-year growth 2021-2026 (%)
- Exhibits16: Data Table on Global Market: Year-over-year growth 2021-2026 (%)
- Exhibits17: Five forces analysis - Comparison between 2021 and 2026
- Exhibits18: Chart on Bargaining power of buyers - Impact of key factors 2021 and 2026
- Exhibits19: Bargaining power of suppliers - Impact of key factors in 2021 and 2026
- Exhibits20: Threat of new entrants - Impact of key factors in 2021 and 2026
- Exhibits21: Threat of substitutes - Impact of key factors in 2021 and 2026
- Exhibits22: Threat of rivalry - Impact of key factors in 2021 and 2026
- Exhibits23: Chart on Market condition - Five forces 2021 and 2026
- Exhibits24: Chart on Price - Market share 2021-2026 (%)
- Exhibits25: Data Table on Price - Market share 2021-2026 (%)
- Exhibits26: Chart on Comparison by Price
- Exhibits27: Data Table on Comparison by Price
- Exhibits28: Chart on Premium range - Market size and forecast 2021-2026 ($ million)
- Exhibits29: Data Table on Premium range - Market size and forecast 2021-2026 ($ million)
- Exhibits30: Chart on Premium range - Year-over-year growth 2021-2026 (%)
- Exhibits31: Data Table on Premium range - Year-over-year growth 2021-2026 (%)
- Exhibits32: Chart on Medium range - Market size and forecast 2021-2026 ($ million)
- Exhibits33: Data Table on Medium range - Market size and forecast 2021-2026 ($ million)
- Exhibits34: Chart on Medium range - Year-over-year growth 2021-2026 (%)
- Exhibits35: Data Table on Medium range - Year-over-year growth 2021-2026 (%)
- Exhibits36: Chart on Low range - Market size and forecast 2021-2026 ($ million)
- Exhibits37: Data Table on Low range - Market size and forecast 2021-2026 ($ million)
- Exhibits38: Chart on Low range - Year-over-year growth 2021-2026 (%)
- Exhibits39: Data Table on Low range - Year-over-year growth 2021-2026 (%)
- Exhibits40: Market opportunity by Price ($ million)
- Exhibits41: Analysis of price sensitivity, lifecycle, customer purchase basket, adoption rates, and purchase criteria
- Exhibits42: Chart on Market share By Geographical Landscape 2021-2026 (%)
- Exhibits43: Data Table on Market share By Geographical Landscape 2021-2026 (%)
- Exhibits44: Chart on Geographic comparison
- Exhibits45: Data Table on Geographic comparison
- Exhibits46: Chart on APAC - Market size and forecast 2021-2026 ($ million)
- Exhibits47: Data Table on APAC - Market size and forecast 2021-2026 ($ million)
- Exhibits48: Chart on APAC - Year-over-year growth 2021-2026 (%)
- Exhibits49: Data Table on APAC - Year-over-year growth 2021-2026 (%)
- Exhibits50: Chart on North America - Market size and forecast 2021-2026 ($ million)
- Exhibits51: Data Table on North America - Market size and forecast 2021-2026 ($ million)
- Exhibits52: Chart on North America - Year-over-year growth 2021-2026 (%)
- Exhibits53: Data Table on North America - Year-over-year growth 2021-2026 (%)
- Exhibits54: Chart on Europe - Market size and forecast 2021-2026 ($ million)
- Exhibits55: Data Table on Europe - Market size and forecast 2021-2026 ($ million)
- Exhibits56: Chart on Europe - Year-over-year growth 2021-2026 (%)
- Exhibits57: Data Table on Europe - Year-over-year growth 2021-2026 (%)
- Exhibits58: Chart on South America - Market size and forecast 2021-2026 ($ million)
- Exhibits59: Data Table on South America - Market size and forecast 2021-2026 ($ million)
- Exhibits60: Chart on South America - Year-over-year growth 2021-2026 (%)
- Exhibits61: Data Table on South America - Year-over-year growth 2021-2026 (%)
- Exhibits62: Chart on Middle East and Africa - Market size and forecast 2021-2026 ($ million)
- Exhibits63: Data Table on Middle East and Africa - Market size and forecast 2021-2026 ($ million)
- Exhibits64: Chart on Middle East and Africa - Year-over-year growth 2021-2026 (%)
- Exhibits65: Data Table on Middle East and Africa - Year-over-year growth 2021-2026 (%)
- Exhibits66: Chart on China - Market size and forecast 2021-2026 ($ million)
- Exhibits67: Data Table on China - Market size and forecast 2021-2026 ($ million)
- Exhibits68: Chart on China - Year-over-year growth 2021-2026 (%)
- Exhibits69: Data Table on China - Year-over-year growth 2021-2026 (%)
- Exhibits70: Chart on South Korea - Market size and forecast 2021-2026 ($ million)
- Exhibits71: Data Table on South Korea - Market size and forecast 2021-2026 ($ million)
- Exhibits72: Chart on South Korea - Year-over-year growth 2021-2026 (%)
- Exhibits73: Data Table on South Korea - Year-over-year growth 2021-2026 (%)
- Exhibits74: Chart on US - Market size and forecast 2021-2026 ($ million)
- Exhibits75: Data Table on US - Market size and forecast 2021-2026 ($ million)
- Exhibits76: Chart on US - Year-over-year growth 2021-2026 (%)
- Exhibits77: Data Table on US - Year-over-year growth 2021-2026 (%)
- Exhibits78: Chart on Japan - Market size and forecast 2021-2026 ($ million)
- Exhibits79: Data Table on Japan - Market size and forecast 2021-2026 ($ million)
- Exhibits80: Chart on Japan - Year-over-year growth 2021-2026 (%)
- Exhibits81: Data Table on Japan - Year-over-year growth 2021-2026 (%)
- Exhibits82: Chart on Taiwan - Market size and forecast 2021-2026 ($ million)
- Exhibits83: Data Table on Taiwan - Market size and forecast 2021-2026 ($ million)
- Exhibits84: Chart on Taiwan - Year-over-year growth 2021-2026 (%)
- Exhibits85: Data Table on Taiwan - Year-over-year growth 2021-2026 (%)
- Exhibits86: Market opportunity By Geographical Landscape ($ million)
- Exhibits87: Impact of drivers and challenges in 2021 and 2026
- Exhibits88: Overview on Criticality of inputs and Factors of differentiation
- Exhibits89: Overview on factors of disruption
- Exhibits90: Impact of key risks on business
- Exhibits91: Vendors covered
- Exhibits92: Matrix on vendor position and classification
- Exhibits93: Alps Alpine Co. Ltd - Overview
- Exhibits94: Alps Alpine Co. Ltd - Business segments
- Exhibits95: Alps Alpine Co. Ltd - Key news
- Exhibits96: Alps Alpine Co. Ltd - Key offerings
- Exhibits97: Alps Alpine Co. Ltd - Segment focus
- Exhibits98: ams AG - Overview
- Exhibits99: ams AG - Business segments
- Exhibits100: ams AG - Key news
- Exhibits101: ams AG - Key offerings
- Exhibits102: ams AG - Segment focus
- Exhibits103: Fujitsu Ltd. - Overview
- Exhibits104: Fujitsu Ltd. - Business segments
- Exhibits105: Fujitsu Ltd. - Key offerings
- Exhibits106: Fujitsu Ltd. - Segment focus
- Exhibits107: Murata Manufacturing Co. Ltd. - Overview
- Exhibits108: Murata Manufacturing Co. Ltd. - Business segments
- Exhibits109: Murata Manufacturing Co. Ltd. - Key news
- Exhibits110: Murata Manufacturing Co. Ltd. - Key offerings
- Exhibits111: Murata Manufacturing Co. Ltd. - Segment focus
- Exhibits112: OMNIVISION Technologies Inc. - Overview
- Exhibits113: OMNIVISION Technologies Inc. - Product / Service
- Exhibits114: OMNIVISION Technologies Inc. - Key offerings
- Exhibits115: Panasonic Corp - Overview
- Exhibits116: Panasonic Corp - Business segments
- Exhibits117: Panasonic Corp - Key news
- Exhibits118: Panasonic Corp - Key offerings
- Exhibits119: Panasonic Corp - Segment focus
- Exhibits120: Qualcomm Inc. - Overview
- Exhibits121: Qualcomm Inc. - Business segments
- Exhibits122: Qualcomm Inc. - Key news
- Exhibits123: Qualcomm Inc. - Key offerings
- Exhibits124: Qualcomm Inc. - Segment focus
- Exhibits125: Robert Bosch GmbH - Overview
- Exhibits126: Robert Bosch GmbH - Business segments
- Exhibits127: Robert Bosch GmbH - Key news
- Exhibits128: Robert Bosch GmbH - Key offerings
- Exhibits129: Robert Bosch GmbH - Segment focus
- Exhibits130: Samsung Electronics Co. Ltd. - Overview
- Exhibits131: Samsung Electronics Co. Ltd. - Business segments
- Exhibits132: Samsung Electronics Co. Ltd. - Key news
- Exhibits133: Samsung Electronics Co. Ltd. - Key offerings
- Exhibits134: Samsung Electronics Co. Ltd. - Segment focus
- Exhibits135: STMicroelectronics NV - Overview
- Exhibits136: STMicroelectronics NV - Business segments
- Exhibits137: STMicroelectronics NV - Key news
- Exhibits138: STMicroelectronics NV - Key offerings
- Exhibits139: STMicroelectronics NV - Segment focus
- Exhibits140: Inclusions checklist
- Exhibits141: Currency conversion rates for US$
- Exhibits142: Research methodology
- Exhibits143: Validation techniques employed for market sizing
- Exhibits144: Information sources
- Exhibits145: List of abbreviations
Technavio has been monitoring the sensors market for smartphones and it is poised to grow by $578.29 mn during 2022-2026, decelerating at a CAGR of 1.99% during the forecast period. Our report on the sensors market for smartphones provides a holistic analysis, market size and forecast, trends, growth drivers, and challenges, as well as vendor analysis covering around 25 vendors.
The report offers an up-to-date analysis of the current global market scenario, the latest trends and drivers, and the overall market environment. The market is driven by the increasing implementation of mobile AR applications by enterprises, the use of CMOS sensors in camera modules, and the integration of more sensors in premium-range smartphones.
The sensors market for smartphone analysis includes price segments and geographic landscapes.
Technavio's sensors market for smartphones is segmented as below:
By Price
- Premium Range
- Medium range
- Low range
By Geographical Landscape
- APAC
- North America
- Europe
- South America
- The Middle East and Africa
This study identifies the emergence of sensor fusion technology as one of the prime reasons driving the sensors market for smartphones growth during the next few years. Also, the growing popularity of multiple-lens camera modules and the rise in the number of m and a will lead to sizable demand in the market.
- Sensors market for smartphone sizing
- Sensors market for smartphones forecast
- Sensors market for smartphones industry analysis
Technavio's robust vendor analysis is designed to help clients improve their market position, and in line with this, this report provides a detailed analysis of several leading sensors market for smartphones vendors that include Alps Alpine Co. Ltd, AMS AG, Broadcom Inc., CEVA Inc., Fingerprint Cards AB, Fujitsu Ltd., Murata Manufacturing Co. Ltd., OMNIVISION Technologies Inc., Panasonic Corp, Qualcomm Inc., Robert Bosch GmbH, ROHM Co. Ltd., Samsung Electronics Co. Ltd., Sensirion AG, Shenzhen Goodix Technology Co. Ltd., Sony Group Corp., STMicroelectronics NV, Synaptics Inc., and TDK Corp. Also, the sensors market for smartphones analysis report includes information on upcoming trends and challenges that will influence market growth. This is to help companies strategize and leverage all future growth opportunities.
The study was conducted using an objective combination of primary and secondary information including inputs from key participants in the industry. The report contains a comprehensive market and vendor landscape in addition to an analysis of the key vendors.
Table of Contents
1 Executive Summary
- 1.1 Market overview
- Exhibit 01: Executive Summary - Chart on Market Overview
- Exhibit 02: Executive Summary - Data Table on Market Overview
- Exhibit 03: Executive Summary - Chart on Global Market Characteristics
- Exhibit 04: Executive Summary - Chart on Market By Geographical Landscape
- Exhibit 05: Executive Summary - Chart on Market Segmentation by Price
- Exhibit 06: Executive Summary - Chart on Incremental Growth
- Exhibit 07: Executive Summary - Data Table on Incremental Growth
- Exhibit 08: Executive Summary - Chart on Vendor Market Positioning
2 Market Landscape
- 2.1 Market ecosystem
- Exhibit 09: Parent market
- Exhibit 10: Market Characteristics
3 Market Sizing
- 3.1 Market definition
- Exhibit 11: Offerings of vendors included in the market definition
- 3.2 Market segment analysis
- Exhibit 12: Market segments
- 3.3 Market size 2021
- 3.4 Market outlook: Forecast for 2021-2026
- Exhibit 13: Chart on Global - Market size and forecast 2021-2026 ($ million)
- Exhibit 14: Data Table on Global - Market size and forecast 2021-2026 ($ million)
- Exhibit 15: Chart on Global Market: Year-over-year growth 2021-2026 (%)
- Exhibit 16: Data Table on Global Market: Year-over-year growth 2021-2026 (%)
4 Five Forces Analysis
- 4.1 Five forces summary
- Exhibit 17: Five forces analysis - Comparison between 2021 and 2026
- 4.2 Bargaining power of buyers
- Exhibit 18: Chart on Bargaining power of buyers - Impact of key factors 2021 and 2026
- 4.3 Bargaining power of suppliers
- Exhibit 19: Bargaining power of suppliers - Impact of key factors in 2021 and 2026
- 4.4 Threat of new entrants
- Exhibit 20: Threat of new entrants - Impact of key factors in 2021 and 2026
- 4.5 Threat of substitutes
- Exhibit 21: Threat of substitutes - Impact of key factors in 2021 and 2026
- 4.6 Threat of rivalry
- Exhibit 22: Threat of rivalry - Impact of key factors in 2021 and 2026
- 4.7 Market condition
- Exhibit 23: Chart on Market condition - Five forces 2021 and 2026
5 Market Segmentation by Price
- 5.1 Market segments
- Exhibit 24: Chart on Price - Market share 2021-2026 (%)
- Exhibit 25: Data Table on Price - Market share 2021-2026 (%)
- 5.2 Comparison by Price
- Exhibit 26: Chart on Comparison by Price
- Exhibit 27: Data Table on Comparison by Price
- 5.3 Premium range - Market size and forecast 2021-2026
- Exhibit 28: Chart on Premium range - Market size and forecast 2021-2026 ($ million)
- Exhibit 29: Data Table on Premium range - Market size and forecast 2021-2026 ($ million)
- Exhibit 30: Chart on Premium range - Year-over-year growth 2021-2026 (%)
- Exhibit 31: Data Table on Premium range - Year-over-year growth 2021-2026 (%)
- 5.4 Medium range - Market size and forecast 2021-2026
- Exhibit 32: Chart on Medium range - Market size and forecast 2021-2026 ($ million)
- Exhibit 33: Data Table on Medium range - Market size and forecast 2021-2026 ($ million)
- Exhibit 34: Chart on Medium range - Year-over-year growth 2021-2026 (%)
- Exhibit 35: Data Table on Medium range - Year-over-year growth 2021-2026 (%)
- 5.5 Low range - Market size and forecast 2021-2026
- Exhibit 36: Chart on Low range - Market size and forecast 2021-2026 ($ million)
- Exhibit 37: Data Table on Low range - Market size and forecast 2021-2026 ($ million)
- Exhibit 38: Chart on Low range - Year-over-year growth 2021-2026 (%)
- Exhibit 39: Data Table on Low range - Year-over-year growth 2021-2026 (%)
- 5.6 Market opportunity by Price
- Exhibit 40: Market opportunity by Price ($ million)
6 Customer Landscape
- 6.1 Customer landscape overview
- Exhibit 41: Analysis of price sensitivity, lifecycle, customer purchase basket, adoption rates, and purchase criteria
7 Geographic Landscape
- 7.1 Geographic segmentation
- Exhibit 42: Chart on Market share By Geographical Landscape 2021-2026 (%)
- Exhibit 43: Data Table on Market share By Geographical Landscape 2021-2026 (%)
- 7.2 Geographic comparison
- Exhibit 44: Chart on Geographic comparison
- Exhibit 45: Data Table on Geographic comparison
- 7.3 APAC - Market size and forecast 2021-2026
- Exhibit 46: Chart on APAC - Market size and forecast 2021-2026 ($ million)
- Exhibit 47: Data Table on APAC - Market size and forecast 2021-2026 ($ million)
- Exhibit 48: Chart on APAC - Year-over-year growth 2021-2026 (%)
- Exhibit 49: Data Table on APAC - Year-over-year growth 2021-2026 (%)
- 7.4 North America - Market size and forecast 2021-2026
- Exhibit 50: Chart on North America - Market size and forecast 2021-2026 ($ million)
- Exhibit 51: Data Table on North America - Market size and forecast 2021-2026 ($ million)
- Exhibit 52: Chart on North America - Year-over-year growth 2021-2026 (%)
- Exhibit 53: Data Table on North America - Year-over-year growth 2021-2026 (%)
- 7.5 Europe - Market size and forecast 2021-2026
- Exhibit 54: Chart on Europe - Market size and forecast 2021-2026 ($ million)
- Exhibit 55: Data Table on Europe - Market size and forecast 2021-2026 ($ million)
- Exhibit 56: Chart on Europe - Year-over-year growth 2021-2026 (%)
- Exhibit 57: Data Table on Europe - Year-over-year growth 2021-2026 (%)
- 7.6 South America - Market size and forecast 2021-2026
- Exhibit 58: Chart on South America - Market size and forecast 2021-2026 ($ million)
- Exhibit 59: Data Table on South America - Market size and forecast 2021-2026 ($ million)
- Exhibit 60: Chart on South America - Year-over-year growth 2021-2026 (%)
- Exhibit 61: Data Table on South America - Year-over-year growth 2021-2026 (%)
- 7.7 Middle East and Africa - Market size and forecast 2021-2026
- Exhibit 62: Chart on Middle East and Africa - Market size and forecast 2021-2026 ($ million)
- Exhibit 63: Data Table on Middle East and Africa - Market size and forecast 2021-2026 ($ million)
- Exhibit 64: Chart on Middle East and Africa - Year-over-year growth 2021-2026 (%)
- Exhibit 65: Data Table on Middle East and Africa - Year-over-year growth 2021-2026 (%)
- 7.8 China - Market size and forecast 2021-2026
- Exhibit 66: Chart on China - Market size and forecast 2021-2026 ($ million)
- Exhibit 67: Data Table on China - Market size and forecast 2021-2026 ($ million)
- Exhibit 68: Chart on China - Year-over-year growth 2021-2026 (%)
- Exhibit 69: Data Table on China - Year-over-year growth 2021-2026 (%)
- 7.9 South Korea - Market size and forecast 2021-2026
- Exhibit 70: Chart on South Korea - Market size and forecast 2021-2026 ($ million)
- Exhibit 71: Data Table on South Korea - Market size and forecast 2021-2026 ($ million)
- Exhibit 72: Chart on South Korea - Year-over-year growth 2021-2026 (%)
- Exhibit 73: Data Table on South Korea - Year-over-year growth 2021-2026 (%)
- 7.10 US - Market size and forecast 2021-2026
- Exhibit 74: Chart on US - Market size and forecast 2021-2026 ($ million)
- Exhibit 75: Data Table on US - Market size and forecast 2021-2026 ($ million)
- Exhibit 76: Chart on US - Year-over-year growth 2021-2026 (%)
- Exhibit 77: Data Table on US - Year-over-year growth 2021-2026 (%)
- 7.11 Japan - Market size and forecast 2021-2026
- Exhibit 78: Chart on Japan - Market size and forecast 2021-2026 ($ million)
- Exhibit 79: Data Table on Japan - Market size and forecast 2021-2026 ($ million)
- Exhibit 80: Chart on Japan - Year-over-year growth 2021-2026 (%)
- Exhibit 81: Data Table on Japan - Year-over-year growth 2021-2026 (%)
- 7.12 Taiwan - Market size and forecast 2021-2026
- Exhibit 82: Chart on Taiwan - Market size and forecast 2021-2026 ($ million)
- Exhibit 83: Data Table on Taiwan - Market size and forecast 2021-2026 ($ million)
- Exhibit 84: Chart on Taiwan - Year-over-year growth 2021-2026 (%)
- Exhibit 85: Data Table on Taiwan - Year-over-year growth 2021-2026 (%)
- 7.13 Market opportunity By Geographical Landscape
- Exhibit 86: Market opportunity By Geographical Landscape ($ million)
8 Drivers, Challenges, and Trends
- 8.1 Market drivers
- 8.2 Market challenges
- 8.3 Impact of drivers and challenges
- Exhibit 87: Impact of drivers and challenges in 2021 and 2026
- 8.4 Market trends
9 Vendor Landscape
- 9.1 Overview
- 9.2 Vendor landscape
- Exhibit 88: Overview on Criticality of inputs and Factors of differentiation
- 9.3 Landscape disruption
- Exhibit 89: Overview on factors of disruption
- 9.4 Industry risks
- Exhibit 90: Impact of key risks on business
10 Vendor Analysis
- 10.1 Vendors covered
- Exhibit 91: Vendors covered
- 10.2 Market positioning of vendors
- Exhibit 92: Matrix on vendor position and classification
- 10.3 Alps Alpine Co. Ltd
- Exhibit 93: Alps Alpine Co. Ltd - Overview
- Exhibit 94: Alps Alpine Co. Ltd - Business segments
- Exhibit 95: Alps Alpine Co. Ltd - Key news
- Exhibit 96: Alps Alpine Co. Ltd - Key offerings
- Exhibit 97: Alps Alpine Co. Ltd - Segment focus
- 10.4 ams AG
- Exhibit 98: ams AG - Overview
- Exhibit 99: ams AG - Business segments
- Exhibit 100: ams AG - Key news
- Exhibit 101: ams AG - Key offerings
- Exhibit 102: ams AG - Segment focus
- 10.5 Fujitsu Ltd.
- Exhibit 103: Fujitsu Ltd. - Overview
- Exhibit 104: Fujitsu Ltd. - Business segments
- Exhibit 105: Fujitsu Ltd. - Key offerings
- Exhibit 106: Fujitsu Ltd. - Segment focus
- 10.6 Murata Manufacturing Co. Ltd.
- Exhibit 107: Murata Manufacturing Co. Ltd. - Overview
- Exhibit 108: Murata Manufacturing Co. Ltd. - Business segments
- Exhibit 109: Murata Manufacturing Co. Ltd. - Key news
- Exhibit 110: Murata Manufacturing Co. Ltd. - Key offerings
- Exhibit 111: Murata Manufacturing Co. Ltd. - Segment focus
- 10.7 OMNIVISION Technologies Inc.
- Exhibit 112: OMNIVISION Technologies Inc. - Overview
- Exhibit 113: OMNIVISION Technologies Inc. - Product / Service
- Exhibit 114: OMNIVISION Technologies Inc. - Key offerings
- 10.8 Panasonic Corp
- Exhibit 115: Panasonic Corp - Overview
- Exhibit 116: Panasonic Corp - Business segments
- Exhibit 117: Panasonic Corp - Key news
- Exhibit 118: Panasonic Corp - Key offerings
- Exhibit 119: Panasonic Corp - Segment focus
- 10.9 Qualcomm Inc.
- Exhibit 120: Qualcomm Inc. - Overview
- Exhibit 121: Qualcomm Inc. - Business segments
- Exhibit 122: Qualcomm Inc. - Key news
- Exhibit 123: Qualcomm Inc. - Key offerings
- Exhibit 124: Qualcomm Inc. - Segment focus
- 10.10 Robert Bosch GmbH
- Exhibit 125: Robert Bosch GmbH - Overview
- Exhibit 126: Robert Bosch GmbH - Business segments
- Exhibit 127: Robert Bosch GmbH - Key news
- Exhibit 128: Robert Bosch GmbH - Key offerings
- Exhibit 129: Robert Bosch GmbH - Segment focus
- 10.11 Samsung Electronics Co. Ltd.
- Exhibit 130: Samsung Electronics Co. Ltd. - Overview
- Exhibit 131: Samsung Electronics Co. Ltd. - Business segments
- Exhibit 132: Samsung Electronics Co. Ltd. - Key news
- Exhibit 133: Samsung Electronics Co. Ltd. - Key offerings
- Exhibit 134: Samsung Electronics Co. Ltd. - Segment focus
- 10.12 STMicroelectronics NV
- Exhibit 135: STMicroelectronics NV - Overview
- Exhibit 136: STMicroelectronics NV - Business segments
- Exhibit 137: STMicroelectronics NV - Key news
- Exhibit 138: STMicroelectronics NV - Key offerings
- Exhibit 139: STMicroelectronics NV - Segment focus
11 Appendix
- 11.1 Scope of the report
- 11.2 Inclusions and exclusions checklist
- Exhibit 140: Inclusions checklist
- 11.3 Currency conversion rates for US$
- Exhibit 141: Currency conversion rates for US$
- 11.4 Research methodology
- Exhibit 142: Research methodology
- Exhibit 143: Validation techniques employed for market sizing
- Exhibit 144: Information sources
- 11.5 List of abbreviations
- Exhibit 145: List of abbreviations
- The market potential of smartphone sensors in Middle Eastern countries such as the UAE is high as industries are proactively implementing smart connected solutions and digital technologies. The increased demand for smartphones and smart city initiatives, as well as improvements in broadband services, are driving the adoption of smartphone sensors in the Middle East. Owing to a rise in the adoption of smartphones in this region, smartphone manufacturers are focusing on setting up more manufacturing plants. The above-mentioned initiatives will increase the partnerships with sensor manufacturers for the integration of advanced sensors, such as fingerprint sensors, to provide advanced functionalities in smartphones at reasonable prices. Further, the digitalization of transport infrastructure is a key enabler for the adoption of smartphone sensors in the Middle East. In addition, increased Internet penetration and the rapid development of mobile communications offer high opportunities for the sensors market for smartphones in Africa. For instance, as of 2021, the Internet penetration in this region was more than 70%. However, MEA will generate much lower demand than other regions, and the market in the region will grow at a slow pace during the forecast period due to the non-availability of the infrastructure required for high-speed Internet. Furthermore, many African countries are expected to show slower adoption during the forecast period due to the lack of infrastructure and connectivity.
- of skilled human resource: Test and measurement equipment such as tunable diode laser analyzer (TDLA), optical time-domain reflectometer (OTDR), and process analyzers are required to be used by an expert in chemical and instrumentation engineering. Many of these equipment are used in manufacturing or production process. The individuals using this equipment need to have an overall understanding of the process to operate the equipment efficiently. One of the major challenges to the market is the lack of skilled human resource in the market. In many instances, end-users are not really satisfied with the use of these test and measurement equipment if they were not properly installed, serviced or calibrated properly. This also deters potential buyers to invest in these test and measurement equipment.