|
|
市場調査レポート
商品コード
1101625
レブリン酸の世界市場:2022年~2026年Global Levulinic Acid Market 2022-2026 |
||||||
|
|
|||||||
|
● お客様のご希望に応じて、既存データの加工や未掲載情報(例:国別セグメント)の追加などの対応が可能です。 詳細はお問い合わせください。 |
|||||||


| レブリン酸の世界市場:2022年~2026年 |
|
出版日: 2022年06月28日
発行: TechNavio
ページ情報: 英文 120 Pages
納期: 即納可能
|
- 全表示
- 概要
- 図表
- 目次
世界のレブリン酸の市場規模は、2022年~2026年の間に3,436.9トンの増加が見込まれ、予測期間中にCAGRで7.68%の成長が予測されています。
市場は、石油系化学品に対するレブリン酸の選好の高まり、レブリン酸およびその誘導体のさまざまな用途、市場ベンダーの戦略的イニシアティブによって牽引されています。
当レポートでは、世界のレブリン酸市場について調査分析し、市場規模・予測、動向、成長促進要因・課題、約25社のベンダーを網羅したベンダー分析などを提供しています。
目次
第1章 エグゼクティブサマリー
- 市場概要
第2章 市場情勢
- 市場のエコシステム
第3章 市場規模
- 市場の定義
- 市場セグメント分析
- 市場規模:2021年
- 市場の見通し:2021年~2026年の予測
第4章 ファイブフォース分析
- ファイブフォースの要約
- 買い手の交渉力
- サプライヤーの交渉力
- 新興企業の脅威
- 代替品の脅威
- 競合企業の脅威
- 市況
第5章 市場セグメンテーション:エンドユーザー別
- 市場セグメント
- 比較:エンドユーザー別
- 農業 - 市場規模と予測:2021年~2026年
- 医薬品 - 市場規模と予測:2021年~2026年
- 食品・飲料 - 市場規模と予測:2021年~2026年
- 化粧品 - 市場規模と予測:2021年~2026年
- その他 - 市場規模と予測:2021年~2026年
- 市場機会:エンドユーザー別
第6章 顧客情勢
- 顧客情勢の概要
第7章 地域別情勢
- 地域別セグメンテーション
- 地域別比較
- 北米 - 市場規模と予測:2021年~2026年
- 欧州 - 市場規模と予測:2021年~2026年
- アジア太平洋地域 - 市場規模と予測:2021年~2026年
- 南米 - 市場規模と予測:2021年~2026年
- 中東とアフリカ - 市場規模と予測:2021年~2026年
- 米国 - 市場規模と予測:2021年~2026年
- 中国 - 市場規模と予測:2021年~2026年
- ドイツ - 市場規模と予測:2021年~2026年
- イタリア - 市場規模と予測:2021年~2026年
- カナダ - 市場規模と予測:2021年~2026年
- フランス - 市場規模と予測:2021年~2026年
- 市場機会:地域情勢別
第8章 促進要因、課題、および動向
- 市場促進要因
- 市場の課題
- 促進要因と課題の影響
- 市場動向
第9章 ベンダー情勢
- 概要
- ベンダー情勢
- 混乱の状況
- 業界のリスク
第10章 ベンダー分析
- 対象ベンダー
- ベンダーの市場ポジショニング
- Advanced Biotech
- Augustus Oils Ltd.
- Aurochemicals
- BEIJING LYS CHEMICALS Co. Ltd.
- Charkit Chemical Co. LLC.
- GFBiochemicals Ltd.
- Hefei TNJ Chemical Industry Co. Ltd.
- Merck and Co. Inc.
- Simagchem Corp.
- The Sherwin Williams Co.
第11章 付録
Exhibits:
- Exhibits1: Executive Summary - Chart on Market Overview
- Exhibits2: Executive Summary - Data Table on Market Overview
- Exhibits3: Executive Summary - Chart on Global Market Characteristics
- Exhibits4: Executive Summary - Chart on Market By Geographical Landscape
- Exhibits5: Executive Summary - Chart on Market Segmentation by End-user
- Exhibits6: Executive Summary - Chart on Incremental Growth
- Exhibits7: Executive Summary - Data Table on Incremental Growth
- Exhibits8: Executive Summary - Chart on Vendor Market Positioning
- Exhibits9: Parent market
- Exhibits10: Market Characteristics
- Exhibits11: Offerings of vendors included in the market definition
- Exhibits12: Market segments
- Exhibits13: Chart on Global - Market size and forecast 2021-2026 (t)
- Exhibits14: Data Table on Global - Market size and forecast 2021-2026 (t)
- Exhibits15: Chart on Global Market- Year-over-year growth 2021-2026 (%)
- Exhibits16: Data Table on Global Market- Year-over-year growth 2021-2026 (%)
- Exhibits17: Five forces analysis - Comparison between 2021 and 2026
- Exhibits18: Chart on Bargaining power of buyers - Impact of key factors 2021 and 2026
- Exhibits19: Bargaining power of suppliers - Impact of key factors in 2021 and 2026
- Exhibits20: Threat of new entrants - Impact of key factors in 2021 and 2026
- Exhibits21: Threat of substitutes - Impact of key factors in 2021 and 2026
- Exhibits22: Threat of rivalry - Impact of key factors in 2021 and 2026
- Exhibits23: Chart on Market condition - Five forces 2021 and 2026
- Exhibits24: Chart on End-user - Market share 2021-2026 (%)
- Exhibits25: Data Table on End-user - Market share 2021-2026 (%)
- Exhibits26: Chart on Comparison by End-user
- Exhibits27: Data Table on Comparison by End-user
- Exhibits28: Chart on Agriculture - Market size and forecast 2021-2026 (t)
- Exhibits29: Data Table on Agriculture - Market size and forecast 2021-2026 (t)
- Exhibits30: Chart on Agriculture - Year-over-year growth 2021-2026 (%)
- Exhibits31: Data Table on Agriculture - Year-over-year growth 2021-2026 (%)
- Exhibits32: Chart on Pharmaceuticals - Market size and forecast 2021-2026 (t)
- Exhibits33: Data Table on Pharmaceuticals - Market size and forecast 2021-2026 (t)
- Exhibits34: Chart on Pharmaceuticals - Year-over-year growth 2021-2026 (%)
- Exhibits35: Data Table on Pharmaceuticals - Year-over-year growth 2021-2026 (%)
- Exhibits36: Chart on Food and beverage - Market size and forecast 2021-2026 (t)
- Exhibits37: Data Table on Food and beverage - Market size and forecast 2021-2026 (t)
- Exhibits38: Chart on Food and beverage - Year-over-year growth 2021-2026 (%)
- Exhibits39: Data Table on Food and beverage - Year-over-year growth 2021-2026 (%)
- Exhibits40: Chart on Cosmetics - Market size and forecast 2021-2026 (t)
- Exhibits41: Data Table on Cosmetics - Market size and forecast 2021-2026 (t)
- Exhibits42: Chart on Cosmetics - Year-over-year growth 2021-2026 (%)
- Exhibits43: Data Table on Cosmetics - Year-over-year growth 2021-2026 (%)
- Exhibits44: Chart on Others - Market size and forecast 2021-2026 (t)
- Exhibits45: Data Table on Others - Market size and forecast 2021-2026 (t)
- Exhibits46: Chart on Others - Year-over-year growth 2021-2026 (%)
- Exhibits47: Data Table on Others - Year-over-year growth 2021-2026 (%)
- Exhibits48: Market opportunity by End-user (t)
- Exhibits49: Analysis of price sensitivity, lifecycle, customer purchase basket, adoption rates, and purchase criteria
- Exhibits50: Chart on Market share By Geographical Landscape 2021-2026 (%)
- Exhibits51: Data Table on Market share By Geographical Landscape 2021-2026 (%)
- Exhibits52: Chart on Geographic comparison
- Exhibits53: Data Table on Geographic comparison
- Exhibits54: Chart on North America - Market size and forecast 2021-2026 (t)
- Exhibits55: Data Table on North America - Market size and forecast 2021-2026 (t)
- Exhibits56: Chart on North America - Year-over-year growth 2021-2026 (%)
- Exhibits57: Data Table on North America - Year-over-year growth 2021-2026 (%)
- Exhibits58: Chart on Europe - Market size and forecast 2021-2026 (t)
- Exhibits59: Data Table on Europe - Market size and forecast 2021-2026 (t)
- Exhibits60: Chart on Europe - Year-over-year growth 2021-2026 (%)
- Exhibits61: Data Table on Europe - Year-over-year growth 2021-2026 (%)
- Exhibits62: Chart on APAC - Market size and forecast 2021-2026 (t)
- Exhibits63: Data Table on APAC - Market size and forecast 2021-2026 (t)
- Exhibits64: Chart on APAC - Year-over-year growth 2021-2026 (%)
- Exhibits65: Data Table on APAC - Year-over-year growth 2021-2026 (%)
- Exhibits66: Chart on South America - Market size and forecast 2021-2026 (t)
- Exhibits67: Data Table on South America - Market size and forecast 2021-2026 (t)
- Exhibits68: Chart on South America - Year-over-year growth 2021-2026 (%)
- Exhibits69: Data Table on South America - Year-over-year growth 2021-2026 (%)
- Exhibits70: Chart on Middle East and Africa - Market size and forecast 2021-2026 (t)
- Exhibits71: Data Table on Middle East and Africa - Market size and forecast 2021-2026 (t)
- Exhibits72: Chart on Middle East and Africa - Year-over-year growth 2021-2026 (%)
- Exhibits73: Data Table on Middle East and Africa - Year-over-year growth 2021-2026 (%)
- Exhibits74: Chart on US - Market size and forecast 2021-2026 (t)
- Exhibits75: Data Table on US - Market size and forecast 2021-2026 (t)
- Exhibits76: Chart on US - Year-over-year growth 2021-2026 (%)
- Exhibits77: Data Table on US - Year-over-year growth 2021-2026 (%)
- Exhibits78: Chart on China - Market size and forecast 2021-2026 (t)
- Exhibits79: Data Table on China - Market size and forecast 2021-2026 (t)
- Exhibits80: Chart on China - Year-over-year growth 2021-2026 (%)
- Exhibits81: Data Table on China - Year-over-year growth 2021-2026 (%)
- Exhibits82: Chart on Germany - Market size and forecast 2021-2026 (t)
- Exhibits83: Data Table on Germany - Market size and forecast 2021-2026 (t)
- Exhibits84: Chart on Germany - Year-over-year growth 2021-2026 (%)
- Exhibits85: Data Table on Germany - Year-over-year growth 2021-2026 (%)
- Exhibits86: Chart on Italy - Market size and forecast 2021-2026 (t)
- Exhibits87: Data Table on Italy - Market size and forecast 2021-2026 (t)
- Exhibits88: Chart on Italy - Year-over-year growth 2021-2026 (%)
- Exhibits89: Data Table on Italy - Year-over-year growth 2021-2026 (%)
- Exhibits90: Chart on Canada - Market size and forecast 2021-2026 (t)
- Exhibits91: Data Table on Canada - Market size and forecast 2021-2026 (t)
- Exhibits92: Chart on Canada - Year-over-year growth 2021-2026 (%)
- Exhibits93: Data Table on Canada - Year-over-year growth 2021-2026 (%)
- Exhibits94: Chart on France - Market size and forecast 2021-2026 (t)
- Exhibits95: Data Table on France - Market size and forecast 2021-2026 (t)
- Exhibits96: Chart on France - Year-over-year growth 2021-2026 (%)
- Exhibits97: Data Table on France - Year-over-year growth 2021-2026 (%)
- Exhibits98: Market opportunity By Geographical Landscape (t)
- Exhibits99: Impact of drivers and challenges in 2021 and 2026
- Exhibits100: Overview on Criticality of inputs and Factors of differentiation
- Exhibits101: Overview on factors of disruption
- Exhibits102: Impact of key risks on business
- Exhibits103: Vendors covered
- Exhibits104: Matrix on vendor position and classification
- Exhibits105: Advanced Biotech - Overview
- Exhibits106: Advanced Biotech - Product / Service
- Exhibits107: Advanced Biotech - Key offerings
- Exhibits108: Augustus Oils Ltd. - Overview
- Exhibits109: Augustus Oils Ltd. - Product / Service
- Exhibits110: Augustus Oils Ltd. - Key offerings
- Exhibits111: Aurochemicals - Overview
- Exhibits112: Aurochemicals - Product / Service
- Exhibits113: Aurochemicals - Key offerings
- Exhibits114: BEIJING LYS CHEMICALS Co. Ltd. - Overview
- Exhibits115: BEIJING LYS CHEMICALS Co. Ltd. - Product / Service
- Exhibits116: BEIJING LYS CHEMICALS Co. Ltd. - Key offerings
- Exhibits117: Charkit Chemical Co. LLC. - Overview
- Exhibits118: Charkit Chemical Co. LLC. - Product / Service
- Exhibits119: Charkit Chemical Co. LLC. - Key offerings
- Exhibits120: GFBiochemicals Ltd. - Overview
- Exhibits121: GFBiochemicals Ltd. - Product / Service
- Exhibits122: GFBiochemicals Ltd. - Key offerings
- Exhibits123: Hefei TNJ Chemical Industry Co. Ltd. - Overview
- Exhibits124: Hefei TNJ Chemical Industry Co. Ltd. - Product / Service
- Exhibits125: Hefei TNJ Chemical Industry Co. Ltd. - Key offerings
- Exhibits126: Merck and Co. Inc. - Overview
- Exhibits127: Merck and Co. Inc. - Business segments
- Exhibits128: Merck and Co. Inc. - Key news
- Exhibits129: Merck and Co. Inc. - Key offerings
- Exhibits130: Merck and Co. Inc. - Segment focus
- Exhibits131: Simagchem Corp. - Overview
- Exhibits132: Simagchem Corp. - Product / Service
- Exhibits133: Simagchem Corp. - Key offerings
- Exhibits134: The Sherwin Williams Co. - Overview
- Exhibits135: The Sherwin Williams Co. - Business segments
- Exhibits136: The Sherwin Williams Co. - Key news
- Exhibits137: The Sherwin Williams Co. - Key offerings
- Exhibits138: The Sherwin Williams Co. - Segment focus
- Exhibits139: Inclusions checklist
- Exhibits140: Exclusions checklist
- Exhibits141: Currency conversion rates for US$
- Exhibits142: Research methodology
- Exhibits143: Validation techniques employed for market sizing
- Exhibits144: Information sources
- Exhibits145: List of abbreviations
Technavio has been monitoring the levulinic acid market and it is poised to grow by 3436.9 tons during 2022-2026, accelerating at a CAGR of 7.68% during the forecast period. Our report on the levulinic acid market provides a holistic analysis, market size and forecast, trends, growth drivers, and challenges, as well as vendor analysis covering around 25 vendors.
The report offers an up-to-date analysis regarding the current global market scenario, the latest trends and drivers, and the overall market environment. The market is driven by the growing preference for levulinic acid over petroleum-based chemicals, various applications of levulinic acid and its derivatives, and strategic initiatives of market vendors.
The levulinic acid market analysis includes the end-user segment and geographic landscape.
Technavio's levulinic acid market is segmented as below:
By End-user
- Agriculture
- Pharmaceuticals
- Food and beverage
- Cosmetics
- Others
By Geographical Landscape
- North America
- Europe
- APAC
- South America
- The Middle East and Africa
This study identifies the production of green transportation fuels from biomass as one of the prime reasons driving the levulinic acid market growth during the next few years. Also, consumer demand for synthetic chemical-free cosmetic products and growing demand for bio-based additives in the agricultural industry will lead to sizable demand in the market.
- Levulinic acid market sizing
- Levulinic acid market forecast
- Levulinic acid market industry analysis
Technavio's robust vendor analysis is designed to help clients improve their market position. In line with this, this report provides a detailed analysis of several leading levulinic acid market vendors that include Advanced Biotech, Augustus Oils Ltd., Agrochemicals, BEIJING LYS CHEMICALS Co. Ltd., Charkit Chemical Co. LLC., De Monchy Aromatics Ltd., GFBiochemicals Ltd., Hefei TNJ Chemical Industry Co. Ltd., Merck and Co. Inc., Otto Chemie Pvt. Ltd., RXChemicals, Shanghai M and U International Trade Co. Ltd., Simagchem Corp., Synerzine Inc., The Sherwin Williams Co., Tokyo Chemical Industry Co. Ltd., and Vigon International Inc. Also, the levulinic acid market analysis report includes information on upcoming trends and challenges that will influence market growth. This is to help companies strategize and leverage all forthcoming growth opportunities.
The study was conducted using an objective combination of primary and secondary information including inputs from key participants in the industry. The report contains a comprehensive market and vendor landscape and an analysis of the key vendors.
Table of Contents
1 Executive Summary
- 1.1 Market overview
- Exhibit 01: Executive Summary - Chart on Market Overview
- Exhibit 02: Executive Summary - Data Table on Market Overview
- Exhibit 03: Executive Summary - Chart on Global Market Characteristics
- Exhibit 04: Executive Summary - Chart on Market By Geographical Landscape
- Exhibit 05: Executive Summary - Chart on Market Segmentation by End-user
- Exhibit 06: Executive Summary - Chart on Incremental Growth
- Exhibit 07: Executive Summary - Data Table on Incremental Growth
- Exhibit 08: Executive Summary - Chart on Vendor Market Positioning
2 Market Landscape
- 2.1 Market ecosystem
- Exhibit 09: Parent market
- Exhibit 10: Market Characteristics
3 Market Sizing
- 3.1 Market definition
- Exhibit 11: Offerings of vendors included in the market definition
- 3.2 Market segment analysis
- Exhibit 12: Market segments
- 3.3 Market size 2021
- 3.4 Market outlook: Forecast for 2021-2026
- Exhibit 13: Chart on Global - Market size and forecast 2021-2026 (t)
- Exhibit 14: Data Table on Global - Market size and forecast 2021-2026 (t)
- Exhibit 15: Chart on Global Market- Year-over-year growth 2021-2026 (%)
- Exhibit 16: Data Table on Global Market- Year-over-year growth 2021-2026 (%)
4 Five Forces Analysis
- 4.1 Five forces summary
- Exhibit 17: Five forces analysis - Comparison between 2021 and 2026
- 4.2 Bargaining power of buyers
- Exhibit 18: Chart on Bargaining power of buyers - Impact of key factors 2021 and 2026
- 4.3 Bargaining power of suppliers
- Exhibit 19: Bargaining power of suppliers - Impact of key factors in 2021 and 2026
- 4.4 Threat of new entrants
- Exhibit 20: Threat of new entrants - Impact of key factors in 2021 and 2026
- 4.5 Threat of substitutes
- Exhibit 21: Threat of substitutes - Impact of key factors in 2021 and 2026
- 4.6 Threat of rivalry
- Exhibit 22: Threat of rivalry - Impact of key factors in 2021 and 2026
- 4.7 Market condition
- Exhibit 23: Chart on Market condition - Five forces 2021 and 2026
5 Market Segmentation by End-user
- 5.1 Market segments
- Exhibit 24: Chart on End-user - Market share 2021-2026 (%)
- Exhibit 25: Data Table on End-user - Market share 2021-2026 (%)
- 5.2 Comparison by End-user
- Exhibit 26: Chart on Comparison by End-user
- Exhibit 27: Data Table on Comparison by End-user
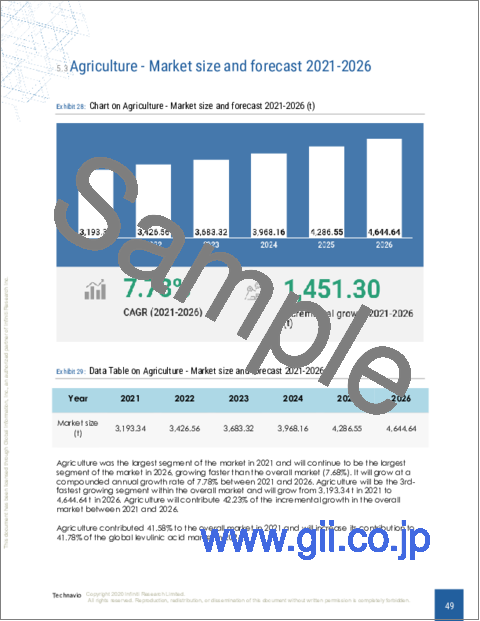
- 5.3 Agriculture - Market size and forecast 2021-2026
- Exhibit 28: Chart on Agriculture - Market size and forecast 2021-2026 (t)
- Exhibit 29: Data Table on Agriculture - Market size and forecast 2021-2026 (t)
- Exhibit 30: Chart on Agriculture - Year-over-year growth 2021-2026 (%)
- Exhibit 31: Data Table on Agriculture - Year-over-year growth 2021-2026 (%)
- 5.4 Pharmaceuticals - Market size and forecast 2021-2026
- Exhibit 32: Chart on Pharmaceuticals - Market size and forecast 2021-2026 (t)
- Exhibit 33: Data Table on Pharmaceuticals - Market size and forecast 2021-2026 (t)
- Exhibit 34: Chart on Pharmaceuticals - Year-over-year growth 2021-2026 (%)
- Exhibit 35: Data Table on Pharmaceuticals - Year-over-year growth 2021-2026 (%)
- 5.5 Food and beverage - Market size and forecast 2021-2026
- Exhibit 36: Chart on Food and beverage - Market size and forecast 2021-2026 (t)
- Exhibit 37: Data Table on Food and beverage - Market size and forecast 2021-2026 (t)
- Exhibit 38: Chart on Food and beverage - Year-over-year growth 2021-2026 (%)
- Exhibit 39: Data Table on Food and beverage - Year-over-year growth 2021-2026 (%)
- 5.6 Cosmetics - Market size and forecast 2021-2026
- Exhibit 40: Chart on Cosmetics - Market size and forecast 2021-2026 (t)
- Exhibit 41: Data Table on Cosmetics - Market size and forecast 2021-2026 (t)
- Exhibit 42: Chart on Cosmetics - Year-over-year growth 2021-2026 (%)
- Exhibit 43: Data Table on Cosmetics - Year-over-year growth 2021-2026 (%)
- 5.7 Others - Market size and forecast 2021-2026
- Exhibit 44: Chart on Others - Market size and forecast 2021-2026 (t)
- Exhibit 45: Data Table on Others - Market size and forecast 2021-2026 (t)
- Exhibit 46: Chart on Others - Year-over-year growth 2021-2026 (%)
- Exhibit 47: Data Table on Others - Year-over-year growth 2021-2026 (%)
- 5.8 Market opportunity by End-user
- Exhibit 48: Market opportunity by End-user (t)
6 Customer Landscape
- 6.1 Customer landscape overview
- Exhibit 49: Analysis of price sensitivity, lifecycle, customer purchase basket, adoption rates, and purchase criteria
7 Geographic Landscape
- 7.1 Geographic segmentation
- Exhibit 50: Chart on Market share By Geographical Landscape 2021-2026 (%)
- Exhibit 51: Data Table on Market share By Geographical Landscape 2021-2026 (%)
- 7.2 Geographic comparison
- Exhibit 52: Chart on Geographic comparison
- Exhibit 53: Data Table on Geographic comparison
- 7.3 North America - Market size and forecast 2021-2026
- Exhibit 54: Chart on North America - Market size and forecast 2021-2026 (t)
- Exhibit 55: Data Table on North America - Market size and forecast 2021-2026 (t)
- Exhibit 56: Chart on North America - Year-over-year growth 2021-2026 (%)
- Exhibit 57: Data Table on North America - Year-over-year growth 2021-2026 (%)
- 7.4 Europe - Market size and forecast 2021-2026
- Exhibit 58: Chart on Europe - Market size and forecast 2021-2026 (t)
- Exhibit 59: Data Table on Europe - Market size and forecast 2021-2026 (t)
- Exhibit 60: Chart on Europe - Year-over-year growth 2021-2026 (%)
- Exhibit 61: Data Table on Europe - Year-over-year growth 2021-2026 (%)
- 7.5 APAC - Market size and forecast 2021-2026
- Exhibit 62: Chart on APAC - Market size and forecast 2021-2026 (t)
- Exhibit 63: Data Table on APAC - Market size and forecast 2021-2026 (t)
- Exhibit 64: Chart on APAC - Year-over-year growth 2021-2026 (%)
- Exhibit 65: Data Table on APAC - Year-over-year growth 2021-2026 (%)
- 7.6 South America - Market size and forecast 2021-2026
- Exhibit 66: Chart on South America - Market size and forecast 2021-2026 (t)
- Exhibit 67: Data Table on South America - Market size and forecast 2021-2026 (t)
- Exhibit 68: Chart on South America - Year-over-year growth 2021-2026 (%)
- Exhibit 69: Data Table on South America - Year-over-year growth 2021-2026 (%)
- 7.7 Middle East and Africa - Market size and forecast 2021-2026
- Exhibit 70: Chart on Middle East and Africa - Market size and forecast 2021-2026 (t)
- Exhibit 71: Data Table on Middle East and Africa - Market size and forecast 2021-2026 (t)
- Exhibit 72: Chart on Middle East and Africa - Year-over-year growth 2021-2026 (%)
- Exhibit 73: Data Table on Middle East and Africa - Year-over-year growth 2021-2026 (%)
- 7.8 US - Market size and forecast 2021-2026
- Exhibit 74: Chart on US - Market size and forecast 2021-2026 (t)
- Exhibit 75: Data Table on US - Market size and forecast 2021-2026 (t)
- Exhibit 76: Chart on US - Year-over-year growth 2021-2026 (%)
- Exhibit 77: Data Table on US - Year-over-year growth 2021-2026 (%)
- 7.9 China - Market size and forecast 2021-2026
- Exhibit 78: Chart on China - Market size and forecast 2021-2026 (t)
- Exhibit 79: Data Table on China - Market size and forecast 2021-2026 (t)
- Exhibit 80: Chart on China - Year-over-year growth 2021-2026 (%)
- Exhibit 81: Data Table on China - Year-over-year growth 2021-2026 (%)
- 7.10 Germany - Market size and forecast 2021-2026
- Exhibit 82: Chart on Germany - Market size and forecast 2021-2026 (t)
- Exhibit 83: Data Table on Germany - Market size and forecast 2021-2026 (t)
- Exhibit 84: Chart on Germany - Year-over-year growth 2021-2026 (%)
- Exhibit 85: Data Table on Germany - Year-over-year growth 2021-2026 (%)
- 7.11 Italy - Market size and forecast 2021-2026
- Exhibit 86: Chart on Italy - Market size and forecast 2021-2026 (t)
- Exhibit 87: Data Table on Italy - Market size and forecast 2021-2026 (t)
- Exhibit 88: Chart on Italy - Year-over-year growth 2021-2026 (%)
- Exhibit 89: Data Table on Italy - Year-over-year growth 2021-2026 (%)
- 7.12 Canada - Market size and forecast 2021-2026
- Exhibit 90: Chart on Canada - Market size and forecast 2021-2026 (t)
- Exhibit 91: Data Table on Canada - Market size and forecast 2021-2026 (t)
- Exhibit 92: Chart on Canada - Year-over-year growth 2021-2026 (%)
- Exhibit 93: Data Table on Canada - Year-over-year growth 2021-2026 (%)
- 7.13 France - Market size and forecast 2021-2026
- Exhibit 94: Chart on France - Market size and forecast 2021-2026 (t)
- Exhibit 95: Data Table on France - Market size and forecast 2021-2026 (t)
- Exhibit 96: Chart on France - Year-over-year growth 2021-2026 (%)
- Exhibit 97: Data Table on France - Year-over-year growth 2021-2026 (%)
- 7.14 Market opportunity By Geographical Landscape
- Exhibit 98: Market opportunity By Geographical Landscape (t)
8 Drivers, Challenges, and Trends
- 8.1 Market drivers
- 8.2 Market challenges
- 8.3 Impact of drivers and challenges
- Exhibit 99: Impact of drivers and challenges in 2021 and 2026
- 8.4 Market trends
9 Vendor Landscape
- 9.1 Overview
- 9.2 Vendor landscape
- Exhibit 100: Overview on Criticality of inputs and Factors of differentiation
- 9.3 Landscape disruption
- Exhibit 101: Overview on factors of disruption
- 9.4 Industry risks
- Exhibit 102: Impact of key risks on business
10 Vendor Analysis
- 10.1 Vendors covered
- Exhibit 103: Vendors covered
- 10.2 Market positioning of vendors
- Exhibit 104: Matrix on vendor position and classification
- 10.3 Advanced Biotech
- Exhibit 105: Advanced Biotech - Overview
- Exhibit 106: Advanced Biotech - Product / Service
- Exhibit 107: Advanced Biotech - Key offerings
- 10.4 Augustus Oils Ltd.
- Exhibit 108: Augustus Oils Ltd. - Overview
- Exhibit 109: Augustus Oils Ltd. - Product / Service
- Exhibit 110: Augustus Oils Ltd. - Key offerings
- 10.5 Aurochemicals
- Exhibit 111: Aurochemicals - Overview
- Exhibit 112: Aurochemicals - Product / Service
- Exhibit 113: Aurochemicals - Key offerings
- 10.6 BEIJING LYS CHEMICALS Co. Ltd.
- Exhibit 114: BEIJING LYS CHEMICALS Co. Ltd. - Overview
- Exhibit 115: BEIJING LYS CHEMICALS Co. Ltd. - Product / Service
- Exhibit 116: BEIJING LYS CHEMICALS Co. Ltd. - Key offerings
- 10.7 Charkit Chemical Co. LLC.
- Exhibit 117: Charkit Chemical Co. LLC. - Overview
- Exhibit 118: Charkit Chemical Co. LLC. - Product / Service
- Exhibit 119: Charkit Chemical Co. LLC. - Key offerings
- 10.8 GFBiochemicals Ltd.
- Exhibit 120: GFBiochemicals Ltd. - Overview
- Exhibit 121: GFBiochemicals Ltd. - Product / Service
- Exhibit 122: GFBiochemicals Ltd. - Key offerings
- 10.9 Hefei TNJ Chemical Industry Co. Ltd.
- Exhibit 123: Hefei TNJ Chemical Industry Co. Ltd. - Overview
- Exhibit 124: Hefei TNJ Chemical Industry Co. Ltd. - Product / Service
- Exhibit 125: Hefei TNJ Chemical Industry Co. Ltd. - Key offerings
- 10.10 Merck and Co. Inc.
- Exhibit 126: Merck and Co. Inc. - Overview
- Exhibit 127: Merck and Co. Inc. - Business segments
- Exhibit 128: Merck and Co. Inc. - Key news
- Exhibit 129: Merck and Co. Inc. - Key offerings
- Exhibit 130: Merck and Co. Inc. - Segment focus
- 10.11 Simagchem Corp.
- Exhibit 131: Simagchem Corp. - Overview
- Exhibit 132: Simagchem Corp. - Product / Service
- Exhibit 133: Simagchem Corp. - Key offerings
- 10.12 The Sherwin Williams Co.
- Exhibit 134: The Sherwin Williams Co. - Overview
- Exhibit 135: The Sherwin Williams Co. - Business segments
- Exhibit 136: The Sherwin Williams Co. - Key news
- Exhibit 137: The Sherwin Williams Co. - Key offerings
- Exhibit 138: The Sherwin Williams Co. - Segment focus
11 Appendix
- 11.1 Scope of the report
- 11.2 Inclusions and exclusions checklist
- Exhibit 139: Inclusions checklist
- Exhibit 140: Exclusions checklist
- 11.3 Currency conversion rates for US$
- Exhibit 141: Currency conversion rates for US$
- 11.4 Research methodology
- Exhibit 142: Research methodology
- Exhibit 143: Validation techniques employed for market sizing
- Exhibit 144: Information sources
- 11.5 List of abbreviations
- Exhibit 145: List of abbreviations