|
|
市場調査レポート
商品コード
1792191
世界の医療出版市場、2025年~2029年Global Medical Publishing Market 2025-2029 |
||||||

|
|||||||
カスタマイズ可能
|
|||||||


| 世界の医療出版市場、2025年~2029年 |
|
出版日: 2025年08月10日
発行: TechNavio
ページ情報: 英文 212 Pages
納期: 即納可能
|

全表示
- 概要
- 図表
- 目次
医療出版市場は2024-2029年に18億530万米ドル、予測期間中のCAGRは2.8%で成長すると予測されます。
当レポートでは、医療出版市場の全体的な分析、市場規模・予測、動向、成長促進要因、課題、約25のベンダーを網羅したベンダー分析などを掲載しています。
現在の市場シナリオ、最新動向と促進要因、市場環境全体に関する最新分析を提供しています。市場を牽引するのは、デジタル出版の増加、ソーシャルメディアの普及、臨床試験数の増加などです。
| 市場範囲 | |
|---|---|
| 基準年 | 2025年 |
| 終了年 | 2029年 |
| 予測期間 | 2025年~2029年 |
| 成長モメンタム | 加速 |
| 前年比 | 2.6% |
| CAGR | 2.8% |
| 増分額 | 18億530万米ドル |
本調査は、業界の主要参加者からのインプットを含め、一次情報と二次情報を客観的に組み合わせて実施しました。レポートには、主要企業の分析に加え、包括的な市場規模データ、地域別分析によるセグメント、ベンダー情勢が含まれています。レポートには過去データと予測データがあります。
本調査では、今後数年間の医療出版市場の成長を促進する主な要因の1つとして、OA出版モデルへの移行を挙げています。また、汎用検索エンジンの利用が増加し、医療電子書籍の影響力が高まっていることも、市場の大きな需要につながると考えられます。
目次
第1章 エグゼクティブサマリー
- 市場概要
第2章 Technavio分析
- 価格・ライフサイクル・顧客購入バスケット・採用率・購入基準の分析
- インプットの重要性と差別化の要因
- 混乱の要因
- 促進要因と課題の影響
第3章 市場情勢
- 市場エコシステム
- 市場の特徴
- バリューチェーン分析
第4章 市場規模
- 市場の定義
- 市場セグメント分析
- 市場規模、2024年
- 市場の見通し、2024年~2029年
第5章 市場規模実績
- 世界の医療出版市場、2019年~2023年
- タイプ別セグメント分析、2019年~2023年
- 製品別セグメント分析、2019年~2023年
- プラットフォーム別セグメント分析、2019年~2023年
- 地域別セグメント分析、2019年~2023年
- 国別セグメント分析、2019年~2023年
第6章 定性分析
- AIの影響:世界の医療出版市場
第7章 ファイブフォース分析
- ファイブフォースの要約
- 買い手の交渉力
- 供給企業の交渉力
- 新規参入業者の脅威
- 代替品の脅威
- 競争の脅威
- 市況
第8章 市場セグメンテーション:タイプ別
- 市場セグメント
- 比較:タイプ別
- オープンアクセスモデル:市場規模と予測、2024年~2029年
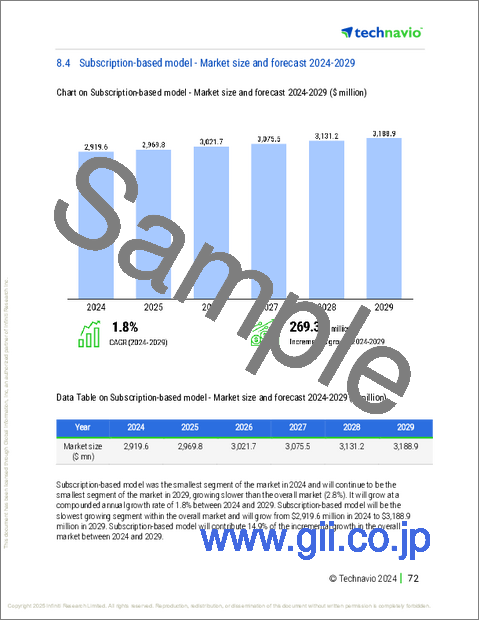
- サブスクリプションモデル:市場規模と予測、2024年~2029年
- 市場機会:タイプ別
第9章 市場セグメンテーション:製品別
- 市場セグメント
- 比較:製品別
- ジャーナル:市場規模と予測、2024年~2029年
- 電子書籍:市場規模と予測、2024年~2029年
- 印刷本:市場規模と予測、2024年~2029年
- 市場機会:製品別
第10章 市場セグメンテーション:プラットフォーム別
- 市場セグメント
- 比較:プラットフォーム別
- デジタル:市場規模と予測、2024年~2029年
- 印刷:市場規模と予測、2024年~2029年
- 市場機会:プラットフォーム別
第11章 顧客情勢
- 顧客情勢の概要
第12章 地域情勢
- 地域別セグメンテーション
- 地域別比較
- 北米:市場規模と予測、2024年~2029年
- 欧州:市場規模と予測、2024年~2029年
- アジア太平洋:市場規模と予測、2024年~2029年
- 南米:市場規模と予測、2024年~2029年
- 中東・アフリカ:市場規模と予測、2024年~2029年
- 米国:市場規模と予測、2024年~2029年
- 中国:市場規模と予測、2024年~2029年
- カナダ:市場規模と予測、2024年~2029年
- ドイツ:市場規模と予測、2024年~2029年
- 英国:市場規模と予測、2024年~2029年
- フランス:市場規模と予測、2024年~2029年
- 日本:市場規模と予測、2024年~2029年
- イタリア:市場規模と予測、2024年~2029年
- スペイン:市場規模と予測、2024年~2029年
- ブラジル:市場規模と予測、2024年~2029年
- 市場機会:地域情勢別
第13章 促進要因・課題・機会・抑制要因
- 市場促進要因
- 市場の課題
- 促進要因と課題の影響
- 市場の機会・抑制要因
第14章 競合情勢
- 概要
- 競合情勢
- 混乱の状況
- 業界のリスク
第15章 競合分析
- 企業プロファイル
- 企業ランキング指数
- 企業の市場ポジショニング
- American Medical Association
- Australian Medical Association Ltd.
- BMJ Publishing Group Ltd.
- Charlesworth Publishing Services Ltd.
- Crimson Interactive Pvt. Ltd.
- EBSCO Information Services
- Hearst Communications Inc.
- Informa PLC
- John Wiley and Sons Inc.
- Massachusetts Medical Society
- McGraw Hill LLC
- OMICS International Pvt. Ltd.
- RELX Plc
- Springer Publishing Co.
- Thieme Medical Publishers Inc.
第16章 付録
Exhibits:
- Exhibits1: Executive Summary - Chart on Market Overview
- Exhibits2: Executive Summary - Data Table on Market Overview
- Exhibits3: Executive Summary - Chart on Global Market Characteristics
- Exhibits4: Executive Summary - Chart on Market By Geographical Landscape
- Exhibits5: Executive Summary - Chart on Market Segmentation by Type
- Exhibits6: Executive Summary - Chart on Market Segmentation by Product
- Exhibits7: Executive Summary - Chart on Market Segmentation by Platform
- Exhibits8: Executive Summary - Chart on Incremental Growth
- Exhibits9: Executive Summary - Data Table on Incremental Growth
- Exhibits10: Executive Summary - Chart on Company Market Positioning
- Exhibits11: Analysis of price sensitivity, lifecycle, customer purchase basket, adoption rates, and purchase criteria
- Exhibits12: Overview on criticality of inputs and factors of differentiation
- Exhibits13: Overview on factors of disruption
- Exhibits14: Impact of drivers and challenges in 2024 and 2029
- Exhibits15: Parent Market
- Exhibits16: Data Table on - Parent Market
- Exhibits17: Market characteristics analysis
- Exhibits18: Value chain analysis
- Exhibits19: Offerings of companies included in the market definition
- Exhibits20: Market segments
- Exhibits21: Chart on Global - Market size and forecast 2024-2029 ($ million)
- Exhibits22: Data Table on Global - Market size and forecast 2024-2029 ($ million)
- Exhibits23: Chart on Global Market: Year-over-year growth 2024-2029 (%)
- Exhibits24: Data Table on Global Market: Year-over-year growth 2024-2029 (%)
- Exhibits25: Historic Market Size - Data Table on Global Medical Publishing Market 2019 - 2023 ($ million)
- Exhibits26: Historic Market Size - Type Segment 2019 - 2023 ($ million)
- Exhibits27: Historic Market Size - Product Segment 2019 - 2023 ($ million)
- Exhibits28: Historic Market Size - Platform Segment 2019 - 2023 ($ million)
- Exhibits29: Historic Market Size - Geography Segment 2019 - 2023 ($ million)
- Exhibits30: Historic Market Size - Country Segment 2019 - 2023 ($ million)
- Exhibits31: Five forces analysis - Comparison between 2024 and 2029
- Exhibits32: Bargaining power of buyers - Impact of key factors 2024 and 2029
- Exhibits33: Bargaining power of suppliers - Impact of key factors in 2024 and 2029
- Exhibits34: Threat of new entrants - Impact of key factors in 2024 and 2029
- Exhibits35: Threat of substitutes - Impact of key factors in 2024 and 2029
- Exhibits36: Threat of rivalry - Impact of key factors in 2024 and 2029
- Exhibits37: Chart on Market condition - Five forces 2024 and 2029
- Exhibits38: Chart on Type - Market share 2024-2029 (%)
- Exhibits39: Data Table on Type - Market share 2024-2029 (%)
- Exhibits40: Chart on Comparison by Type
- Exhibits41: Data Table on Comparison by Type
- Exhibits42: Chart on Open access model - Market size and forecast 2024-2029 ($ million)
- Exhibits43: Data Table on Open access model - Market size and forecast 2024-2029 ($ million)
- Exhibits44: Chart on Open access model - Year-over-year growth 2024-2029 (%)
- Exhibits45: Data Table on Open access model - Year-over-year growth 2024-2029 (%)
- Exhibits46: Chart on Subscription-based model - Market size and forecast 2024-2029 ($ million)
- Exhibits47: Data Table on Subscription-based model - Market size and forecast 2024-2029 ($ million)
- Exhibits48: Chart on Subscription-based model - Year-over-year growth 2024-2029 (%)
- Exhibits49: Data Table on Subscription-based model - Year-over-year growth 2024-2029 (%)
- Exhibits50: Market opportunity by Type ($ million)
- Exhibits51: Data Table on Market opportunity by Type ($ million)
- Exhibits52: Chart on Product - Market share 2024-2029 (%)
- Exhibits53: Data Table on Product - Market share 2024-2029 (%)
- Exhibits54: Chart on Comparison by Product
- Exhibits55: Data Table on Comparison by Product
- Exhibits56: Chart on Journals - Market size and forecast 2024-2029 ($ million)
- Exhibits57: Data Table on Journals - Market size and forecast 2024-2029 ($ million)
- Exhibits58: Chart on Journals - Year-over-year growth 2024-2029 (%)
- Exhibits59: Data Table on Journals - Year-over-year growth 2024-2029 (%)
- Exhibits60: Chart on E-books - Market size and forecast 2024-2029 ($ million)
- Exhibits61: Data Table on E-books - Market size and forecast 2024-2029 ($ million)
- Exhibits62: Chart on E-books - Year-over-year growth 2024-2029 (%)
- Exhibits63: Data Table on E-books - Year-over-year growth 2024-2029 (%)
- Exhibits64: Chart on Print books - Market size and forecast 2024-2029 ($ million)
- Exhibits65: Data Table on Print books - Market size and forecast 2024-2029 ($ million)
- Exhibits66: Chart on Print books - Year-over-year growth 2024-2029 (%)
- Exhibits67: Data Table on Print books - Year-over-year growth 2024-2029 (%)
- Exhibits68: Market opportunity by Product ($ million)
- Exhibits69: Data Table on Market opportunity by Product ($ million)
- Exhibits70: Chart on Platform - Market share 2024-2029 (%)
- Exhibits71: Data Table on Platform - Market share 2024-2029 (%)
- Exhibits72: Chart on Comparison by Platform
- Exhibits73: Data Table on Comparison by Platform
- Exhibits74: Chart on Digital - Market size and forecast 2024-2029 ($ million)
- Exhibits75: Data Table on Digital - Market size and forecast 2024-2029 ($ million)
- Exhibits76: Chart on Digital - Year-over-year growth 2024-2029 (%)
- Exhibits77: Data Table on Digital - Year-over-year growth 2024-2029 (%)
- Exhibits78: Chart on Print - Market size and forecast 2024-2029 ($ million)
- Exhibits79: Data Table on Print - Market size and forecast 2024-2029 ($ million)
- Exhibits80: Chart on Print - Year-over-year growth 2024-2029 (%)
- Exhibits81: Data Table on Print - Year-over-year growth 2024-2029 (%)
- Exhibits82: Market opportunity by Platform ($ million)
- Exhibits83: Data Table on Market opportunity by Platform ($ million)
- Exhibits84: Analysis of price sensitivity, lifecycle, customer purchase basket, adoption rates, and purchase criteria
- Exhibits85: Chart on Market share By Geographical Landscape 2024-2029 (%)
- Exhibits86: Data Table on Market share By Geographical Landscape 2024-2029 (%)
- Exhibits87: Chart on Geographic comparison
- Exhibits88: Data Table on Geographic comparison
- Exhibits89: Chart on North America - Market size and forecast 2024-2029 ($ million)
- Exhibits90: Data Table on North America - Market size and forecast 2024-2029 ($ million)
- Exhibits91: Chart on North America - Year-over-year growth 2024-2029 (%)
- Exhibits92: Data Table on North America - Year-over-year growth 2024-2029 (%)
- Exhibits93: Chart on Europe - Market size and forecast 2024-2029 ($ million)
- Exhibits94: Data Table on Europe - Market size and forecast 2024-2029 ($ million)
- Exhibits95: Chart on Europe - Year-over-year growth 2024-2029 (%)
- Exhibits96: Data Table on Europe - Year-over-year growth 2024-2029 (%)
- Exhibits97: Chart on APAC - Market size and forecast 2024-2029 ($ million)
- Exhibits98: Data Table on APAC - Market size and forecast 2024-2029 ($ million)
- Exhibits99: Chart on APAC - Year-over-year growth 2024-2029 (%)
- Exhibits100: Data Table on APAC - Year-over-year growth 2024-2029 (%)
- Exhibits101: Chart on South America - Market size and forecast 2024-2029 ($ million)
- Exhibits102: Data Table on South America - Market size and forecast 2024-2029 ($ million)
- Exhibits103: Chart on South America - Year-over-year growth 2024-2029 (%)
- Exhibits104: Data Table on South America - Year-over-year growth 2024-2029 (%)
- Exhibits105: Chart on Middle East and Africa - Market size and forecast 2024-2029 ($ million)
- Exhibits106: Data Table on Middle East and Africa - Market size and forecast 2024-2029 ($ million)
- Exhibits107: Chart on Middle East and Africa - Year-over-year growth 2024-2029 (%)
- Exhibits108: Data Table on Middle East and Africa - Year-over-year growth 2024-2029 (%)
- Exhibits109: Chart on US - Market size and forecast 2024-2029 ($ million)
- Exhibits110: Data Table on US - Market size and forecast 2024-2029 ($ million)
- Exhibits111: Chart on US - Year-over-year growth 2024-2029 (%)
- Exhibits112: Data Table on US - Year-over-year growth 2024-2029 (%)
- Exhibits113: Chart on China - Market size and forecast 2024-2029 ($ million)
- Exhibits114: Data Table on China - Market size and forecast 2024-2029 ($ million)
- Exhibits115: Chart on China - Year-over-year growth 2024-2029 (%)
- Exhibits116: Data Table on China - Year-over-year growth 2024-2029 (%)
- Exhibits117: Chart on Canada - Market size and forecast 2024-2029 ($ million)
- Exhibits118: Data Table on Canada - Market size and forecast 2024-2029 ($ million)
- Exhibits119: Chart on Canada - Year-over-year growth 2024-2029 (%)
- Exhibits120: Data Table on Canada - Year-over-year growth 2024-2029 (%)
- Exhibits121: Chart on Germany - Market size and forecast 2024-2029 ($ million)
- Exhibits122: Data Table on Germany - Market size and forecast 2024-2029 ($ million)
- Exhibits123: Chart on Germany - Year-over-year growth 2024-2029 (%)
- Exhibits124: Data Table on Germany - Year-over-year growth 2024-2029 (%)
- Exhibits125: Chart on UK - Market size and forecast 2024-2029 ($ million)
- Exhibits126: Data Table on UK - Market size and forecast 2024-2029 ($ million)
- Exhibits127: Chart on UK - Year-over-year growth 2024-2029 (%)
- Exhibits128: Data Table on UK - Year-over-year growth 2024-2029 (%)
- Exhibits129: Chart on France - Market size and forecast 2024-2029 ($ million)
- Exhibits130: Data Table on France - Market size and forecast 2024-2029 ($ million)
- Exhibits131: Chart on France - Year-over-year growth 2024-2029 (%)
- Exhibits132: Data Table on France - Year-over-year growth 2024-2029 (%)
- Exhibits133: Chart on Japan - Market size and forecast 2024-2029 ($ million)
- Exhibits134: Data Table on Japan - Market size and forecast 2024-2029 ($ million)
- Exhibits135: Chart on Japan - Year-over-year growth 2024-2029 (%)
- Exhibits136: Data Table on Japan - Year-over-year growth 2024-2029 (%)
- Exhibits137: Chart on Italy - Market size and forecast 2024-2029 ($ million)
- Exhibits138: Data Table on Italy - Market size and forecast 2024-2029 ($ million)
- Exhibits139: Chart on Italy - Year-over-year growth 2024-2029 (%)
- Exhibits140: Data Table on Italy - Year-over-year growth 2024-2029 (%)
- Exhibits141: Chart on Spain - Market size and forecast 2024-2029 ($ million)
- Exhibits142: Data Table on Spain - Market size and forecast 2024-2029 ($ million)
- Exhibits143: Chart on Spain - Year-over-year growth 2024-2029 (%)
- Exhibits144: Data Table on Spain - Year-over-year growth 2024-2029 (%)
- Exhibits145: Chart on Brazil - Market size and forecast 2024-2029 ($ million)
- Exhibits146: Data Table on Brazil - Market size and forecast 2024-2029 ($ million)
- Exhibits147: Chart on Brazil - Year-over-year growth 2024-2029 (%)
- Exhibits148: Data Table on Brazil - Year-over-year growth 2024-2029 (%)
- Exhibits149: Market opportunity By Geographical Landscape ($ million)
- Exhibits150: Data Tables on Market opportunity By Geographical Landscape ($ million)
- Exhibits151: Impact of drivers and challenges in 2024 and 2029
- Exhibits152: Overview on criticality of inputs and factors of differentiation
- Exhibits153: Overview on factors of disruption
- Exhibits154: Impact of key risks on business
- Exhibits155: Companies covered
- Exhibits156: Company ranking index
- Exhibits157: Matrix on companies position and classification
- Exhibits158: American Medical Association - Overview
- Exhibits159: American Medical Association - Product / Service
- Exhibits160: American Medical Association - Key offerings
- Exhibits161: SWOT
- Exhibits162: Australian Medical Association Ltd. - Overview
- Exhibits163: Australian Medical Association Ltd. - Product / Service
- Exhibits164: Australian Medical Association Ltd. - Key offerings
- Exhibits165: SWOT
- Exhibits166: BMJ Publishing Group Ltd. - Overview
- Exhibits167: BMJ Publishing Group Ltd. - Product / Service
- Exhibits168: BMJ Publishing Group Ltd. - Key offerings
- Exhibits169: SWOT
- Exhibits170: Charlesworth Publishing Services Ltd. - Overview
- Exhibits171: Charlesworth Publishing Services Ltd. - Product / Service
- Exhibits172: Charlesworth Publishing Services Ltd. - Key offerings
- Exhibits173: SWOT
- Exhibits174: Crimson Interactive Pvt. Ltd. - Overview
- Exhibits175: Crimson Interactive Pvt. Ltd. - Product / Service
- Exhibits176: Crimson Interactive Pvt. Ltd. - Key offerings
- Exhibits177: SWOT
- Exhibits178: EBSCO Information Services - Overview
- Exhibits179: EBSCO Information Services - Product / Service
- Exhibits180: EBSCO Information Services - Key offerings
- Exhibits181: SWOT
- Exhibits182: Hearst Communications Inc. - Overview
- Exhibits183: Hearst Communications Inc. - Product / Service
- Exhibits184: Hearst Communications Inc. - Key news
- Exhibits185: Hearst Communications Inc. - Key offerings
- Exhibits186: SWOT
- Exhibits187: Informa PLC - Overview
- Exhibits188: Informa PLC - Product / Service
- Exhibits189: Informa PLC - Key offerings
- Exhibits190: SWOT
- Exhibits191: John Wiley and Sons Inc. - Overview
- Exhibits192: John Wiley and Sons Inc. - Business segments
- Exhibits193: John Wiley and Sons Inc. - Key offerings
- Exhibits194: John Wiley and Sons Inc. - Segment focus
- Exhibits195: SWOT
- Exhibits196: Massachusetts Medical Society - Overview
- Exhibits197: Massachusetts Medical Society - Product / Service
- Exhibits198: Massachusetts Medical Society - Key offerings
- Exhibits199: SWOT
- Exhibits200: McGraw Hill LLC - Overview
- Exhibits201: McGraw Hill LLC - Product / Service
- Exhibits202: McGraw Hill LLC - Key news
- Exhibits203: McGraw Hill LLC - Key offerings
- Exhibits204: SWOT
- Exhibits205: OMICS International Pvt. Ltd. - Overview
- Exhibits206: OMICS International Pvt. Ltd. - Product / Service
- Exhibits207: OMICS International Pvt. Ltd. - Key offerings
- Exhibits208: SWOT
- Exhibits209: RELX Plc - Overview
- Exhibits210: RELX Plc - Business segments
- Exhibits211: RELX Plc - Key offerings
- Exhibits212: RELX Plc - Segment focus
- Exhibits213: SWOT
- Exhibits214: Springer Publishing Co. - Overview
- Exhibits215: Springer Publishing Co. - Product / Service
- Exhibits216: Springer Publishing Co. - Key offerings
- Exhibits217: SWOT
- Exhibits218: Thieme Medical Publishers Inc. - Overview
- Exhibits219: Thieme Medical Publishers Inc. - Product / Service
- Exhibits220: Thieme Medical Publishers Inc. - Key offerings
- Exhibits221: SWOT
- Exhibits222: Inclusions checklist
- Exhibits223: Exclusions checklist
- Exhibits224: Currency conversion rates for US$
- Exhibits225: Research methodology
- Exhibits226: Information sources
- Exhibits227: Data validation
- Exhibits228: Validation techniques employed for market sizing
- Exhibits229: Data synthesis
- Exhibits230: 360 degree market analysis
- Exhibits231: List of abbreviations
The medical publishing market is forecasted to grow by USD 1,805.3 mn during 2024-2029, accelerating at a CAGR of 2.8% during the forecast period. The report on the medical publishing market provides a holistic analysis, market size and forecast, trends, growth drivers, and challenges, as well as vendor analysis covering around 25 vendors.
The report offers an up-to-date analysis regarding the current market scenario, the latest trends and drivers, and the overall market environment. The market is driven by rise in digital publishing, growing popularity of social media, and increase in number of clinical trials.
| Market Scope | |
|---|---|
| Base Year | 2025 |
| End Year | 2029 |
| Series Year | 2025-2029 |
| Growth Momentum | Accelerate |
| YOY 2025 | 2.6% |
| CAGR | 2.8% |
| Incremental Value | $1,805.3 mn |
The study was conducted using an objective combination of primary and secondary information including inputs from key participants in the industry. The report contains a comprehensive market size data, segment with regional analysis and vendor landscape in addition to an analysis of the key companies. Reports have historic and forecast data.
Technavio's medical publishing market is segmented as below:
By Type
- Open access model
- Subscription-based model
By Product
- Journals
- E-books
- Print books
By Platform
- Digital
By Geographical Landscape
- North America
- Europe
- APAC
- South America
- Middle East and Africa
This study identifies the transition toward oa publication model as one of the prime reasons driving the medical publishing market growth during the next few years. Also, increasing use of general-purpose search engines and growing impact of medical e-books will lead to sizable demand in the market.
The report on the medical publishing market covers the following areas:
- Medical Publishing Market sizing
- Medical Publishing Market forecast
- Medical Publishing Market industry analysis
The robust vendor analysis is designed to help clients improve their market position, and in line with this, this report provides a detailed analysis of several leading medical publishing market vendors that include American Medical Association, Australian Medical Association Ltd., BMJ Publishing Group Ltd., Charlesworth Publishing Services Ltd., Crimson Interactive Pvt. Ltd., EBSCO Information Services, Hearst Communications Inc., Informa PLC, John Wiley and Sons Inc., Massachusetts Medical Society, McGraw Hill LLC, MDPI, OMICS International Pvt. Ltd., RELX PLC, Springer Publishing Co., Thieme Medical Publishers Inc., and Wolters Kluwer NV. Also, the medical publishing market analysis report includes information on upcoming trends and challenges that will influence market growth. This is to help companies strategize and leverage all forthcoming growth opportunities.
The publisher presents a detailed picture of the market by the way of study, synthesis, and summation of data from multiple sources by an analysis of key parameters such as profit, pricing, competition, and promotions. It presents various market facets by identifying the key industry influencers. The data presented is comprehensive, reliable, and a result of extensive primary and secondary research. The market research reports provide a complete competitive landscape and an in-depth vendor selection methodology and analysis using qualitative and quantitative research to forecast accurate market growth.
Table of Contents
1 Executive Summary
- 1.1 Market overview
- Executive Summary - Chart on Market Overview
- Executive Summary - Data Table on Market Overview
- Executive Summary - Chart on Global Market Characteristics
- Executive Summary - Chart on Market By Geographical Landscape
- Executive Summary - Chart on Market Segmentation by Type
- Executive Summary - Chart on Market Segmentation by Product
- Executive Summary - Chart on Market Segmentation by Platform
- Executive Summary - Chart on Incremental Growth
- Executive Summary - Data Table on Incremental Growth
- Executive Summary - Chart on Company Market Positioning
2 Technavio Analysis
- 2.1 Analysis of price sensitivity, lifecycle, customer purchase basket, adoption rates, and purchase criteria
- Analysis of price sensitivity, lifecycle, customer purchase basket, adoption rates, and purchase criteria
- 2.2 Criticality of inputs and Factors of differentiation
- Overview on criticality of inputs and factors of differentiation
- 2.3 Factors of disruption
- Overview on factors of disruption
- 2.4 Impact of drivers and challenges
- Impact of drivers and challenges in 2024 and 2029
3 Market Landscape
- 3.1 Market ecosystem
- Parent Market
- Data Table on - Parent Market
- 3.2 Market characteristics
- Market characteristics analysis
- 3.3 Value chain analysis
- Value chain analysis
4 Market Sizing
- 4.1 Market definition
- Offerings of companies included in the market definition
- 4.2 Market segment analysis
- Market segments
- 4.3 Market size 2024
- 4.4 Market outlook: Forecast for 2024-2029
- Chart on Global - Market size and forecast 2024-2029 ($ million)
- Data Table on Global - Market size and forecast 2024-2029 ($ million)
- Chart on Global Market: Year-over-year growth 2024-2029 (%)
- Data Table on Global Market: Year-over-year growth 2024-2029 (%)
5 Historic Market Size
- 5.1 Global Medical Publishing Market 2019 - 2023
- Historic Market Size - Data Table on Global Medical Publishing Market 2019 - 2023 ($ million)
- 5.2 Type segment analysis 2019 - 2023
- Historic Market Size - Type Segment 2019 - 2023 ($ million)
- 5.3 Product segment analysis 2019 - 2023
- Historic Market Size - Product Segment 2019 - 2023 ($ million)
- 5.4 Platform segment analysis 2019 - 2023
- Historic Market Size - Platform Segment 2019 - 2023 ($ million)
- 5.5 Geography segment analysis 2019 - 2023
- Historic Market Size - Geography Segment 2019 - 2023 ($ million)
- 5.6 Country segment analysis 2019 - 2023
- Historic Market Size - Country Segment 2019 - 2023 ($ million)
6 Qualitative Analysis
- 6.1 Impact of AI in the global medical publishing market
7 Five Forces Analysis
- 7.1 Five forces summary
- Five forces analysis - Comparison between 2024 and 2029
- 7.2 Bargaining power of buyers
- Bargaining power of buyers - Impact of key factors 2024 and 2029
- 7.3 Bargaining power of suppliers
- Bargaining power of suppliers - Impact of key factors in 2024 and 2029
- 7.4 Threat of new entrants
- Threat of new entrants - Impact of key factors in 2024 and 2029
- 7.5 Threat of substitutes
- Threat of substitutes - Impact of key factors in 2024 and 2029
- 7.6 Threat of rivalry
- Threat of rivalry - Impact of key factors in 2024 and 2029
- 7.7 Market condition
- Chart on Market condition - Five forces 2024 and 2029
8 Market Segmentation by Type
- 8.1 Market segments
- Chart on Type - Market share 2024-2029 (%)
- Data Table on Type - Market share 2024-2029 (%)
- 8.2 Comparison by Type
- Chart on Comparison by Type
- Data Table on Comparison by Type
- 8.3 Open access model - Market size and forecast 2024-2029
- Chart on Open access model - Market size and forecast 2024-2029 ($ million)
- Data Table on Open access model - Market size and forecast 2024-2029 ($ million)
- Chart on Open access model - Year-over-year growth 2024-2029 (%)
- Data Table on Open access model - Year-over-year growth 2024-2029 (%)
- 8.4 Subscription-based model - Market size and forecast 2024-2029
- Chart on Subscription-based model - Market size and forecast 2024-2029 ($ million)
- Data Table on Subscription-based model - Market size and forecast 2024-2029 ($ million)
- Chart on Subscription-based model - Year-over-year growth 2024-2029 (%)
- Data Table on Subscription-based model - Year-over-year growth 2024-2029 (%)
- 8.5 Market opportunity by Type
- Market opportunity by Type ($ million)
- Data Table on Market opportunity by Type ($ million)
9 Market Segmentation by Product
- 9.1 Market segments
- Chart on Product - Market share 2024-2029 (%)
- Data Table on Product - Market share 2024-2029 (%)
- 9.2 Comparison by Product
- Chart on Comparison by Product
- Data Table on Comparison by Product
- 9.3 Journals - Market size and forecast 2024-2029
- Chart on Journals - Market size and forecast 2024-2029 ($ million)
- Data Table on Journals - Market size and forecast 2024-2029 ($ million)
- Chart on Journals - Year-over-year growth 2024-2029 (%)
- Data Table on Journals - Year-over-year growth 2024-2029 (%)
- 9.4 E-books - Market size and forecast 2024-2029
- Chart on E-books - Market size and forecast 2024-2029 ($ million)
- Data Table on E-books - Market size and forecast 2024-2029 ($ million)
- Chart on E-books - Year-over-year growth 2024-2029 (%)
- Data Table on E-books - Year-over-year growth 2024-2029 (%)
- 9.5 Print books - Market size and forecast 2024-2029
- Chart on Print books - Market size and forecast 2024-2029 ($ million)
- Data Table on Print books - Market size and forecast 2024-2029 ($ million)
- Chart on Print books - Year-over-year growth 2024-2029 (%)
- Data Table on Print books - Year-over-year growth 2024-2029 (%)
- 9.6 Market opportunity by Product
- Market opportunity by Product ($ million)
- Data Table on Market opportunity by Product ($ million)
10 Market Segmentation by Platform
- 10.1 Market segments
- Chart on Platform - Market share 2024-2029 (%)
- Data Table on Platform - Market share 2024-2029 (%)
- 10.2 Comparison by Platform
- Chart on Comparison by Platform
- Data Table on Comparison by Platform
- 10.3 Digital - Market size and forecast 2024-2029
- Chart on Digital - Market size and forecast 2024-2029 ($ million)
- Data Table on Digital - Market size and forecast 2024-2029 ($ million)
- Chart on Digital - Year-over-year growth 2024-2029 (%)
- Data Table on Digital - Year-over-year growth 2024-2029 (%)
- 10.4 Print - Market size and forecast 2024-2029
- Chart on Print - Market size and forecast 2024-2029 ($ million)
- Data Table on Print - Market size and forecast 2024-2029 ($ million)
- Chart on Print - Year-over-year growth 2024-2029 (%)
- Data Table on Print - Year-over-year growth 2024-2029 (%)
- 10.5 Market opportunity by Platform
- Market opportunity by Platform ($ million)
- Data Table on Market opportunity by Platform ($ million)
11 Customer Landscape
- 11.1 Customer landscape overview
- Analysis of price sensitivity, lifecycle, customer purchase basket, adoption rates, and purchase criteria
12 Geographic Landscape
- 12.1 Geographic segmentation
- Chart on Market share By Geographical Landscape 2024-2029 (%)
- Data Table on Market share By Geographical Landscape 2024-2029 (%)
- 12.2 Geographic comparison
- Chart on Geographic comparison
- Data Table on Geographic comparison
- 12.3 North America - Market size and forecast 2024-2029
- Chart on North America - Market size and forecast 2024-2029 ($ million)
- Data Table on North America - Market size and forecast 2024-2029 ($ million)
- Chart on North America - Year-over-year growth 2024-2029 (%)
- Data Table on North America - Year-over-year growth 2024-2029 (%)
- 12.4 Europe - Market size and forecast 2024-2029
- Chart on Europe - Market size and forecast 2024-2029 ($ million)
- Data Table on Europe - Market size and forecast 2024-2029 ($ million)
- Chart on Europe - Year-over-year growth 2024-2029 (%)
- Data Table on Europe - Year-over-year growth 2024-2029 (%)
- 12.5 APAC - Market size and forecast 2024-2029
- Chart on APAC - Market size and forecast 2024-2029 ($ million)
- Data Table on APAC - Market size and forecast 2024-2029 ($ million)
- Chart on APAC - Year-over-year growth 2024-2029 (%)
- Data Table on APAC - Year-over-year growth 2024-2029 (%)
- 12.6 South America - Market size and forecast 2024-2029
- Chart on South America - Market size and forecast 2024-2029 ($ million)
- Data Table on South America - Market size and forecast 2024-2029 ($ million)
- Chart on South America - Year-over-year growth 2024-2029 (%)
- Data Table on South America - Year-over-year growth 2024-2029 (%)
- 12.7 Middle East and Africa - Market size and forecast 2024-2029
- Chart on Middle East and Africa - Market size and forecast 2024-2029 ($ million)
- Data Table on Middle East and Africa - Market size and forecast 2024-2029 ($ million)
- Chart on Middle East and Africa - Year-over-year growth 2024-2029 (%)
- Data Table on Middle East and Africa - Year-over-year growth 2024-2029 (%)
- 12.8 US - Market size and forecast 2024-2029
- Chart on US - Market size and forecast 2024-2029 ($ million)
- Data Table on US - Market size and forecast 2024-2029 ($ million)
- Chart on US - Year-over-year growth 2024-2029 (%)
- Data Table on US - Year-over-year growth 2024-2029 (%)
- 12.9 China - Market size and forecast 2024-2029
- Chart on China - Market size and forecast 2024-2029 ($ million)
- Data Table on China - Market size and forecast 2024-2029 ($ million)
- Chart on China - Year-over-year growth 2024-2029 (%)
- Data Table on China - Year-over-year growth 2024-2029 (%)
- 12.10 Canada - Market size and forecast 2024-2029
- Chart on Canada - Market size and forecast 2024-2029 ($ million)
- Data Table on Canada - Market size and forecast 2024-2029 ($ million)
- Chart on Canada - Year-over-year growth 2024-2029 (%)
- Data Table on Canada - Year-over-year growth 2024-2029 (%)
- 12.11 Germany - Market size and forecast 2024-2029
- Chart on Germany - Market size and forecast 2024-2029 ($ million)
- Data Table on Germany - Market size and forecast 2024-2029 ($ million)
- Chart on Germany - Year-over-year growth 2024-2029 (%)
- Data Table on Germany - Year-over-year growth 2024-2029 (%)
- 12.12 UK - Market size and forecast 2024-2029
- Chart on UK - Market size and forecast 2024-2029 ($ million)
- Data Table on UK - Market size and forecast 2024-2029 ($ million)
- Chart on UK - Year-over-year growth 2024-2029 (%)
- Data Table on UK - Year-over-year growth 2024-2029 (%)
- 12.13 France - Market size and forecast 2024-2029
- Chart on France - Market size and forecast 2024-2029 ($ million)
- Data Table on France - Market size and forecast 2024-2029 ($ million)
- Chart on France - Year-over-year growth 2024-2029 (%)
- Data Table on France - Year-over-year growth 2024-2029 (%)
- 12.14 Japan - Market size and forecast 2024-2029
- Chart on Japan - Market size and forecast 2024-2029 ($ million)
- Data Table on Japan - Market size and forecast 2024-2029 ($ million)
- Chart on Japan - Year-over-year growth 2024-2029 (%)
- Data Table on Japan - Year-over-year growth 2024-2029 (%)
- 12.15 Italy - Market size and forecast 2024-2029
- Chart on Italy - Market size and forecast 2024-2029 ($ million)
- Data Table on Italy - Market size and forecast 2024-2029 ($ million)
- Chart on Italy - Year-over-year growth 2024-2029 (%)
- Data Table on Italy - Year-over-year growth 2024-2029 (%)
- 12.16 Spain - Market size and forecast 2024-2029
- Chart on Spain - Market size and forecast 2024-2029 ($ million)
- Data Table on Spain - Market size and forecast 2024-2029 ($ million)
- Chart on Spain - Year-over-year growth 2024-2029 (%)
- Data Table on Spain - Year-over-year growth 2024-2029 (%)
- 12.17 Brazil - Market size and forecast 2024-2029
- Chart on Brazil - Market size and forecast 2024-2029 ($ million)
- Data Table on Brazil - Market size and forecast 2024-2029 ($ million)
- Chart on Brazil - Year-over-year growth 2024-2029 (%)
- Data Table on Brazil - Year-over-year growth 2024-2029 (%)
- 12.18 Market opportunity By Geographical Landscape
- Market opportunity By Geographical Landscape ($ million)
- Data Tables on Market opportunity By Geographical Landscape ($ million)
13 Drivers, Challenges, and Opportunity/Restraints
- 13.1 Market drivers
- 13.2 Market challenges
- 13.3 Impact of drivers and challenges
- Impact of drivers and challenges in 2024 and 2029
- 13.4 Market opportunities/restraints
14 Competitive Landscape
- 14.1 Overview
- 14.2 Competitive Landscape
- Overview on criticality of inputs and factors of differentiation
- 14.3 Landscape disruption
- Overview on factors of disruption
- 14.4 Industry risks
- Impact of key risks on business
15 Competitive Analysis
- 15.1 Companies profiled
- Companies covered
- 15.2 Company ranking index
- Company ranking index
- 15.3 Market positioning of companies
- Matrix on companies position and classification
- 15.4 American Medical Association
- American Medical Association - Overview
- American Medical Association - Product / Service
- American Medical Association - Key offerings
- SWOT
- 15.5 Australian Medical Association Ltd.
- Australian Medical Association Ltd. - Overview
- Australian Medical Association Ltd. - Product / Service
- Australian Medical Association Ltd. - Key offerings
- SWOT
- 15.6 BMJ Publishing Group Ltd.
- BMJ Publishing Group Ltd. - Overview
- BMJ Publishing Group Ltd. - Product / Service
- BMJ Publishing Group Ltd. - Key offerings
- SWOT
- 15.7 Charlesworth Publishing Services Ltd.
- Charlesworth Publishing Services Ltd. - Overview
- Charlesworth Publishing Services Ltd. - Product / Service
- Charlesworth Publishing Services Ltd. - Key offerings
- SWOT
- 15.8 Crimson Interactive Pvt. Ltd.
- Crimson Interactive Pvt. Ltd. - Overview
- Crimson Interactive Pvt. Ltd. - Product / Service
- Crimson Interactive Pvt. Ltd. - Key offerings
- SWOT
- 15.9 EBSCO Information Services
- EBSCO Information Services - Overview
- EBSCO Information Services - Product / Service
- EBSCO Information Services - Key offerings
- SWOT
- 15.10 Hearst Communications Inc.
- Hearst Communications Inc. - Overview
- Hearst Communications Inc. - Product / Service
- Hearst Communications Inc. - Key news
- Hearst Communications Inc. - Key offerings
- SWOT
- 15.11 Informa PLC
- Informa PLC - Overview
- Informa PLC - Product / Service
- Informa PLC - Key offerings
- SWOT
- 15.12 John Wiley and Sons Inc.
- John Wiley and Sons Inc. - Overview
- John Wiley and Sons Inc. - Business segments
- John Wiley and Sons Inc. - Key offerings
- John Wiley and Sons Inc. - Segment focus
- SWOT
- 15.13 Massachusetts Medical Society
- Massachusetts Medical Society - Overview
- Massachusetts Medical Society - Product / Service
- Massachusetts Medical Society - Key offerings
- SWOT
- 15.14 McGraw Hill LLC
- McGraw Hill LLC - Overview
- McGraw Hill LLC - Product / Service
- McGraw Hill LLC - Key news
- McGraw Hill LLC - Key offerings
- SWOT
- 15.15 OMICS International Pvt. Ltd.
- OMICS International Pvt. Ltd. - Overview
- OMICS International Pvt. Ltd. - Product / Service
- OMICS International Pvt. Ltd. - Key offerings
- SWOT
- 15.16 RELX Plc
- RELX Plc - Overview
- RELX Plc - Business segments
- RELX Plc - Key offerings
- RELX Plc - Segment focus
- SWOT
- 15.17 Springer Publishing Co.
- Springer Publishing Co. - Overview
- Springer Publishing Co. - Product / Service
- Springer Publishing Co. - Key offerings
- SWOT
- 15.18 Thieme Medical Publishers Inc.
- Thieme Medical Publishers Inc. - Overview
- Thieme Medical Publishers Inc. - Product / Service
- Thieme Medical Publishers Inc. - Key offerings
- SWOT
16 Appendix
- 16.1 Scope of the report
- 16.2 Inclusions and exclusions checklist
- Inclusions checklist
- Exclusions checklist
- 16.3 Currency conversion rates for US$
- Currency conversion rates for US$
- 16.4 Research methodology
- Research methodology
- 16.5 Data procurement
- Information sources
- 16.6 Data validation
- Data validation
- 16.7 Validation techniques employed for market sizing
- Validation techniques employed for market sizing
- 16.8 Data synthesis
- Data synthesis
- 16.9 360 degree market analysis
- 360 degree market analysis
- 16.10 List of abbreviations
- List of abbreviations

