|
|
市場調査レポート
商品コード
1693054
空気圧アクチュエータの世界市場 2025~2029年Global Pneumatic Actuator Market 2025-2029 |
||||||

|
|||||||
カスタマイズ可能
|
|||||||


| 空気圧アクチュエータの世界市場 2025~2029年 |
|
出版日: 2025年03月21日
発行: TechNavio
ページ情報: 英文 245 Pages
納期: 即納可能
|

全表示
- 概要
- 図表
- 目次
空気圧アクチュエータ市場は2024-2029年に12億3,160万米ドル、予測期間中のCAGRは5.8%で成長すると予測されます。
当レポートでは、空気圧アクチュエータ市場の全体的な分析、市場規模・予測、動向、成長促進要因、課題、約25のベンダーを網羅したベンダー分析などを掲載しています。
現在の市場シナリオ、最新動向と促進要因、市場環境全体に関する最新分析を提供しています。市場は、飲食品産業における空気圧アクチュエータの使用の増加、石油・ガス産業における空気圧アクチュエータ需要の増加、産業施設における自動化の機運の高まりによって牽引されています。
| 市場範囲 | |
|---|---|
| 基準年 | 2025 |
| 終了年 | 2029 |
| 予測期間 | 2025-2029 |
| 成長モメンタム | 加速 |
| 前年比2025年 | 5.2% |
| CAGR | 5.8% |
| 増分額 | 12億3,160万米ドル |
本調査は、業界の主要参加者からのインプットを含め、一次情報と二次情報を客観的に組み合わせて実施しました。レポートには、主要企業の分析に加え、包括的な市場規模データ、地域別分析によるセグメント、ベンダー情勢が含まれています。レポートには履歴データと予測データがあります。
本調査では、予知保全のためのIOT対応アクチュエータの採用が、今後数年間の空気圧アクチュエータ市場の成長を促進する主要な理由の1つであると特定しています。また、位置制御のための電空式アクチュエータの使用や、ロボット産業におけるソフト空気圧アクチュエータの技術進歩は、市場の大きな需要につながります。
目次
第1章 エグゼクティブサマリー
- 市場概要
第2章 Technavio分析
- 価格・ライフサイクル・顧客購入バスケット・採用率・購入基準の分析
- インプットの重要性と差別化の要因
- 混乱の要因
- 促進要因と課題の影響
第3章 市場情勢
- 市場エコシステム
- 市場の特徴
- バリューチェーン分析
第4章 市場規模
- 市場の定義
- 市場セグメント分析
- 市場規模 2024
- 市場の見通し 2024-2029
第5章 市場規模実績
- 空気圧アクチュエータの世界市場 2019-2023
- 製品タイプ別セグメント分析 2019-2023
- エンドユーザー別セグメント分析 2019-2023
- タイプ別セグメント分析 2019-2023
- 容量別セグメント分析 2019-2023
- 地域別セグメント分析 2019-2023
- 国別セグメント分析 2019-2023
第6章 定性分析
- AIの影響:空気圧アクチュエータの世界市場
第7章 ファイブフォース分析
- ファイブフォースの要約
- 買い手の交渉力
- 供給企業の交渉力
- 新規参入業者の脅威
- 代替品の脅威
- 競争の脅威
- 市況
第8章 市場セグメンテーション:製品タイプ別
- 市場セグメント
- 比較:製品タイプ別
- 1/4回転:市場規模と予測 2024-2029
- マルチターン:市場規模と予測 2024-2029
- リニア:市場規模と予測 2024-2029
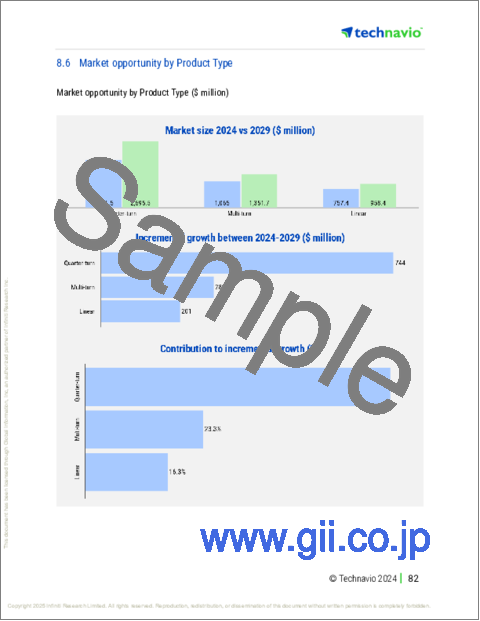
- 市場機会:製品タイプ別
第9章 市場セグメンテーション:エンドユーザー別
- 市場セグメント
- 比較:エンドユーザー別
- 化学および石油化学:市場規模と予測 2024-2029
- 石油・ガス:市場規模と予測 2024-2029
- 発電:市場規模と予測 2024-2029
- 鉱業:市場規模と予測 2024-2029
- その他:市場規模と予測 2024-2029
- 市場機会:エンドユーザー別
第10章 市場セグメンテーション:タイプ別
- 市場セグメント
- 比較:タイプ別
- リニアアクチュエータ:市場規模と予測 2024-2029
- ロータリーアクチュエータ:市場規模と予測 2024-2029
- 市場機会:タイプ別
第11章 市場セグメンテーション:容量別
- 市場セグメント
- 比較:容量別
- 軽作業用空気圧アクチュエータ:市場規模と予測 2024-2029
- 重荷重用空気圧アクチュエータ:市場規模と予測 2024-2029
- 市場機会:容量別
第12章 顧客情勢
- 顧客情勢の概要
第13章 地域別情勢
- 地域別セグメンテーション
- 地域別比較
- 北米:市場規模と予測 2024-2029
- 欧州:市場規模と予測 2024-2029
- アジア太平洋:市場規模と予測 2024-2029
- 南米:市場規模と予測 2024-2029
- 中東・アフリカ:市場規模と予測 2024-2029
- 米国:市場規模と予測 2024-2029
- カナダ:市場規模と予測 2024-2029
- 中国:市場規模と予測 2024-2029
- ドイツ:市場規模と予測 2024-2029
- 日本:市場規模と予測 2024-2029
- 英国:市場規模と予測 2024-2029
- インド:市場規模と予測 2024-2029
- フランス:市場規模と予測 2024-2029
- ブラジル:市場規模と予測 2024-2029
- イタリア:市場規模と予測 2024-2029
- 市場機会:地域情勢別
第14章 促進要因・課題・機会・抑制要因
- 市場促進要因
- 市場の課題
- 促進要因と課題の影響
- 市場の機会・抑制要因
第15章 競合情勢
- 概要
- 競合情勢
- 混乱の状況
- 業界のリスク
第16章 競合分析
- 企業プロファイル
- 企業ランキング指数
- 企業の市場ポジショニング
- ABB Ltd.
- AIRTECH PRODUCTS Inc.
- Crane Holdings Co.
- Eaton Corp. plc
- Emerson Electric Co.
- Flowserve Corp.
- Honeywell International Inc.
- Moog Inc.
- Parker Hannifin Corp.
- Pentair Plc
- ROTEX Controls Inc.
- Rotork Plc
- Schlumberger Ltd.
- Siemens AG
- SMC Corp.
第17章 付録
Exhibits:
- Exhibits1: Executive Summary - Chart on Market Overview
- Exhibits2: Executive Summary - Data Table on Market Overview
- Exhibits3: Executive Summary - Chart on Global Market Characteristics
- Exhibits4: Executive Summary - Chart on Market By Geographical Landscape
- Exhibits5: Executive Summary - Chart on Market Segmentation by Product Type
- Exhibits6: Executive Summary - Chart on Market Segmentation by End-user
- Exhibits7: Executive Summary - Chart on Market Segmentation by Type
- Exhibits8: Executive Summary - Chart on Market Segmentation by Capacity
- Exhibits9: Executive Summary - Chart on Incremental Growth
- Exhibits10: Executive Summary - Data Table on Incremental Growth
- Exhibits11: Executive Summary - Chart on Company Market Positioning
- Exhibits12: Analysis of price sensitivity, lifecycle, customer purchase basket, adoption rates, and purchase criteria
- Exhibits13: Overview on criticality of inputs and factors of differentiation
- Exhibits14: Overview on factors of disruption
- Exhibits15: Impact of drivers and challenges in 2024 and 2029
- Exhibits16: Parent Market
- Exhibits17: Data Table on - Parent Market
- Exhibits18: Market characteristics analysis
- Exhibits19: Value chain analysis
- Exhibits20: Offerings of companies included in the market definition
- Exhibits21: Market segments
- Exhibits22: Chart on Global - Market size and forecast 2024-2029 ($ million)
- Exhibits23: Data Table on Global - Market size and forecast 2024-2029 ($ million)
- Exhibits24: Chart on Global Market: Year-over-year growth 2024-2029 (%)
- Exhibits25: Data Table on Global Market: Year-over-year growth 2024-2029 (%)
- Exhibits26: Historic Market Size - Data Table on Global Pneumatic Actuator Market 2019 - 2023 ($ million)
- Exhibits27: Historic Market Size - Product Type Segment 2019 - 2023 ($ million)
- Exhibits28: Historic Market Size - End-user Segment 2019 - 2023 ($ million)
- Exhibits29: Historic Market Size - Type Segment 2019 - 2023 ($ million)
- Exhibits30: Historic Market Size - Capacity Segment 2019 - 2023 ($ million)
- Exhibits31: Historic Market Size - Geography Segment 2019 - 2023 ($ million)
- Exhibits32: Historic Market Size - Country Segment 2019 - 2023 ($ million)
- Exhibits33: Five forces analysis - Comparison between 2024 and 2029
- Exhibits34: Bargaining power of buyers - Impact of key factors 2024 and 2029
- Exhibits35: Bargaining power of suppliers - Impact of key factors in 2024 and 2029
- Exhibits36: Threat of new entrants - Impact of key factors in 2024 and 2029
- Exhibits37: Threat of substitutes - Impact of key factors in 2024 and 2029
- Exhibits38: Threat of rivalry - Impact of key factors in 2024 and 2029
- Exhibits39: Chart on Market condition - Five forces 2024 and 2029
- Exhibits40: Chart on Product Type - Market share 2024-2029 (%)
- Exhibits41: Data Table on Product Type - Market share 2024-2029 (%)
- Exhibits42: Chart on Comparison by Product Type
- Exhibits43: Data Table on Comparison by Product Type
- Exhibits44: Chart on Quarter-turn - Market size and forecast 2024-2029 ($ million)
- Exhibits45: Data Table on Quarter-turn - Market size and forecast 2024-2029 ($ million)
- Exhibits46: Chart on Quarter-turn - Year-over-year growth 2024-2029 (%)
- Exhibits47: Data Table on Quarter-turn - Year-over-year growth 2024-2029 (%)
- Exhibits48: Chart on Multi-turn - Market size and forecast 2024-2029 ($ million)
- Exhibits49: Data Table on Multi-turn - Market size and forecast 2024-2029 ($ million)
- Exhibits50: Chart on Multi-turn - Year-over-year growth 2024-2029 (%)
- Exhibits51: Data Table on Multi-turn - Year-over-year growth 2024-2029 (%)
- Exhibits52: Chart on Linear - Market size and forecast 2024-2029 ($ million)
- Exhibits53: Data Table on Linear - Market size and forecast 2024-2029 ($ million)
- Exhibits54: Chart on Linear - Year-over-year growth 2024-2029 (%)
- Exhibits55: Data Table on Linear - Year-over-year growth 2024-2029 (%)
- Exhibits56: Market opportunity by Product Type ($ million)
- Exhibits57: Data Table on Market opportunity by Product Type ($ million)
- Exhibits58: Chart on End-user - Market share 2024-2029 (%)
- Exhibits59: Data Table on End-user - Market share 2024-2029 (%)
- Exhibits60: Chart on Comparison by End-user
- Exhibits61: Data Table on Comparison by End-user
- Exhibits62: Chart on Chemical and petrochemical - Market size and forecast 2024-2029 ($ million)
- Exhibits63: Data Table on Chemical and petrochemical - Market size and forecast 2024-2029 ($ million)
- Exhibits64: Chart on Chemical and petrochemical - Year-over-year growth 2024-2029 (%)
- Exhibits65: Data Table on Chemical and petrochemical - Year-over-year growth 2024-2029 (%)
- Exhibits66: Chart on Oil and gas - Market size and forecast 2024-2029 ($ million)
- Exhibits67: Data Table on Oil and gas - Market size and forecast 2024-2029 ($ million)
- Exhibits68: Chart on Oil and gas - Year-over-year growth 2024-2029 (%)
- Exhibits69: Data Table on Oil and gas - Year-over-year growth 2024-2029 (%)
- Exhibits70: Chart on Power generation - Market size and forecast 2024-2029 ($ million)
- Exhibits71: Data Table on Power generation - Market size and forecast 2024-2029 ($ million)
- Exhibits72: Chart on Power generation - Year-over-year growth 2024-2029 (%)
- Exhibits73: Data Table on Power generation - Year-over-year growth 2024-2029 (%)
- Exhibits74: Chart on Mining - Market size and forecast 2024-2029 ($ million)
- Exhibits75: Data Table on Mining - Market size and forecast 2024-2029 ($ million)
- Exhibits76: Chart on Mining - Year-over-year growth 2024-2029 (%)
- Exhibits77: Data Table on Mining - Year-over-year growth 2024-2029 (%)
- Exhibits78: Chart on Others - Market size and forecast 2024-2029 ($ million)
- Exhibits79: Data Table on Others - Market size and forecast 2024-2029 ($ million)
- Exhibits80: Chart on Others - Year-over-year growth 2024-2029 (%)
- Exhibits81: Data Table on Others - Year-over-year growth 2024-2029 (%)
- Exhibits82: Market opportunity by End-user ($ million)
- Exhibits83: Data Table on Market opportunity by End-user ($ million)
- Exhibits84: Chart on Type - Market share 2024-2029 (%)
- Exhibits85: Data Table on Type - Market share 2024-2029 (%)
- Exhibits86: Chart on Comparison by Type
- Exhibits87: Data Table on Comparison by Type
- Exhibits88: Chart on Linear actuators - Market size and forecast 2024-2029 ($ million)
- Exhibits89: Data Table on Linear actuators - Market size and forecast 2024-2029 ($ million)
- Exhibits90: Chart on Linear actuators - Year-over-year growth 2024-2029 (%)
- Exhibits91: Data Table on Linear actuators - Year-over-year growth 2024-2029 (%)
- Exhibits92: Chart on Rotary actuators - Market size and forecast 2024-2029 ($ million)
- Exhibits93: Data Table on Rotary actuators - Market size and forecast 2024-2029 ($ million)
- Exhibits94: Chart on Rotary actuators - Year-over-year growth 2024-2029 (%)
- Exhibits95: Data Table on Rotary actuators - Year-over-year growth 2024-2029 (%)
- Exhibits96: Market opportunity by Type ($ million)
- Exhibits97: Data Table on Market opportunity by Type ($ million)
- Exhibits98: Chart on Capacity - Market share 2024-2029 (%)
- Exhibits99: Data Table on Capacity - Market share 2024-2029 (%)
- Exhibits100: Chart on Comparison by Capacity
- Exhibits101: Data Table on Comparison by Capacity
- Exhibits102: Chart on Light duty pneumatic actuator - Market size and forecast 2024-2029 ($ million)
- Exhibits103: Data Table on Light duty pneumatic actuator - Market size and forecast 2024-2029 ($ million)
- Exhibits104: Chart on Light duty pneumatic actuator - Year-over-year growth 2024-2029 (%)
- Exhibits105: Data Table on Light duty pneumatic actuator - Year-over-year growth 2024-2029 (%)
- Exhibits106: Chart on Heavy duty pneumatic actuator - Market size and forecast 2024-2029 ($ million)
- Exhibits107: Data Table on Heavy duty pneumatic actuator - Market size and forecast 2024-2029 ($ million)
- Exhibits108: Chart on Heavy duty pneumatic actuator - Year-over-year growth 2024-2029 (%)
- Exhibits109: Data Table on Heavy duty pneumatic actuator - Year-over-year growth 2024-2029 (%)
- Exhibits110: Market opportunity by Capacity ($ million)
- Exhibits111: Data Table on Market opportunity by Capacity ($ million)
- Exhibits112: Analysis of price sensitivity, lifecycle, customer purchase basket, adoption rates, and purchase criteria
- Exhibits113: Chart on Market share By Geographical Landscape 2024-2029 (%)
- Exhibits114: Data Table on Market share By Geographical Landscape 2024-2029 (%)
- Exhibits115: Chart on Geographic comparison
- Exhibits116: Data Table on Geographic comparison
- Exhibits117: Chart on North America - Market size and forecast 2024-2029 ($ million)
- Exhibits118: Data Table on North America - Market size and forecast 2024-2029 ($ million)
- Exhibits119: Chart on North America - Year-over-year growth 2024-2029 (%)
- Exhibits120: Data Table on North America - Year-over-year growth 2024-2029 (%)
- Exhibits121: Chart on Europe - Market size and forecast 2024-2029 ($ million)
- Exhibits122: Data Table on Europe - Market size and forecast 2024-2029 ($ million)
- Exhibits123: Chart on Europe - Year-over-year growth 2024-2029 (%)
- Exhibits124: Data Table on Europe - Year-over-year growth 2024-2029 (%)
- Exhibits125: Chart on APAC - Market size and forecast 2024-2029 ($ million)
- Exhibits126: Data Table on APAC - Market size and forecast 2024-2029 ($ million)
- Exhibits127: Chart on APAC - Year-over-year growth 2024-2029 (%)
- Exhibits128: Data Table on APAC - Year-over-year growth 2024-2029 (%)
- Exhibits129: Chart on South America - Market size and forecast 2024-2029 ($ million)
- Exhibits130: Data Table on South America - Market size and forecast 2024-2029 ($ million)
- Exhibits131: Chart on South America - Year-over-year growth 2024-2029 (%)
- Exhibits132: Data Table on South America - Year-over-year growth 2024-2029 (%)
- Exhibits133: Chart on Middle East and Africa - Market size and forecast 2024-2029 ($ million)
- Exhibits134: Data Table on Middle East and Africa - Market size and forecast 2024-2029 ($ million)
- Exhibits135: Chart on Middle East and Africa - Year-over-year growth 2024-2029 (%)
- Exhibits136: Data Table on Middle East and Africa - Year-over-year growth 2024-2029 (%)
- Exhibits137: Chart on US - Market size and forecast 2024-2029 ($ million)
- Exhibits138: Data Table on US - Market size and forecast 2024-2029 ($ million)
- Exhibits139: Chart on US - Year-over-year growth 2024-2029 (%)
- Exhibits140: Data Table on US - Year-over-year growth 2024-2029 (%)
- Exhibits141: Chart on Canada - Market size and forecast 2024-2029 ($ million)
- Exhibits142: Data Table on Canada - Market size and forecast 2024-2029 ($ million)
- Exhibits143: Chart on Canada - Year-over-year growth 2024-2029 (%)
- Exhibits144: Data Table on Canada - Year-over-year growth 2024-2029 (%)
- Exhibits145: Chart on China - Market size and forecast 2024-2029 ($ million)
- Exhibits146: Data Table on China - Market size and forecast 2024-2029 ($ million)
- Exhibits147: Chart on China - Year-over-year growth 2024-2029 (%)
- Exhibits148: Data Table on China - Year-over-year growth 2024-2029 (%)
- Exhibits149: Chart on Germany - Market size and forecast 2024-2029 ($ million)
- Exhibits150: Data Table on Germany - Market size and forecast 2024-2029 ($ million)
- Exhibits151: Chart on Germany - Year-over-year growth 2024-2029 (%)
- Exhibits152: Data Table on Germany - Year-over-year growth 2024-2029 (%)
- Exhibits153: Chart on Japan - Market size and forecast 2024-2029 ($ million)
- Exhibits154: Data Table on Japan - Market size and forecast 2024-2029 ($ million)
- Exhibits155: Chart on Japan - Year-over-year growth 2024-2029 (%)
- Exhibits156: Data Table on Japan - Year-over-year growth 2024-2029 (%)
- Exhibits157: Chart on UK - Market size and forecast 2024-2029 ($ million)
- Exhibits158: Data Table on UK - Market size and forecast 2024-2029 ($ million)
- Exhibits159: Chart on UK - Year-over-year growth 2024-2029 (%)
- Exhibits160: Data Table on UK - Year-over-year growth 2024-2029 (%)
- Exhibits161: Chart on India - Market size and forecast 2024-2029 ($ million)
- Exhibits162: Data Table on India - Market size and forecast 2024-2029 ($ million)
- Exhibits163: Chart on India - Year-over-year growth 2024-2029 (%)
- Exhibits164: Data Table on India - Year-over-year growth 2024-2029 (%)
- Exhibits165: Chart on France - Market size and forecast 2024-2029 ($ million)
- Exhibits166: Data Table on France - Market size and forecast 2024-2029 ($ million)
- Exhibits167: Chart on France - Year-over-year growth 2024-2029 (%)
- Exhibits168: Data Table on France - Year-over-year growth 2024-2029 (%)
- Exhibits169: Chart on Brazil - Market size and forecast 2024-2029 ($ million)
- Exhibits170: Data Table on Brazil - Market size and forecast 2024-2029 ($ million)
- Exhibits171: Chart on Brazil - Year-over-year growth 2024-2029 (%)
- Exhibits172: Data Table on Brazil - Year-over-year growth 2024-2029 (%)
- Exhibits173: Chart on Italy - Market size and forecast 2024-2029 ($ million)
- Exhibits174: Data Table on Italy - Market size and forecast 2024-2029 ($ million)
- Exhibits175: Chart on Italy - Year-over-year growth 2024-2029 (%)
- Exhibits176: Data Table on Italy - Year-over-year growth 2024-2029 (%)
- Exhibits177: Market opportunity By Geographical Landscape ($ million)
- Exhibits178: Data Tables on Market opportunity By Geographical Landscape ($ million)
- Exhibits179: Impact of drivers and challenges in 2024 and 2029
- Exhibits180: Overview on criticality of inputs and factors of differentiation
- Exhibits181: Overview on factors of disruption
- Exhibits182: Impact of key risks on business
- Exhibits183: Companies covered
- Exhibits184: Company ranking index
- Exhibits185: Matrix on companies position and classification
- Exhibits186: ABB Ltd. - Overview
- Exhibits187: ABB Ltd. - Business segments
- Exhibits188: ABB Ltd. - Key news
- Exhibits189: ABB Ltd. - Key offerings
- Exhibits190: ABB Ltd. - Segment focus
- Exhibits191: SWOT
- Exhibits192: AIRTECH PRODUCTS Inc. - Overview
- Exhibits193: AIRTECH PRODUCTS Inc. - Product / Service
- Exhibits194: AIRTECH PRODUCTS Inc. - Key offerings
- Exhibits195: SWOT
- Exhibits196: Crane Holdings Co. - Overview
- Exhibits197: Crane Holdings Co. - Business segments
- Exhibits198: Crane Holdings Co. - Key news
- Exhibits199: Crane Holdings Co. - Key offerings
- Exhibits200: Crane Holdings Co. - Segment focus
- Exhibits201: SWOT
- Exhibits202: Eaton Corp. plc - Overview
- Exhibits203: Eaton Corp. plc - Business segments
- Exhibits204: Eaton Corp. plc - Key news
- Exhibits205: Eaton Corp. plc - Key offerings
- Exhibits206: Eaton Corp. plc - Segment focus
- Exhibits207: SWOT
- Exhibits208: Emerson Electric Co. - Overview
- Exhibits209: Emerson Electric Co. - Business segments
- Exhibits210: Emerson Electric Co. - Key news
- Exhibits211: Emerson Electric Co. - Key offerings
- Exhibits212: Emerson Electric Co. - Segment focus
- Exhibits213: SWOT
- Exhibits214: Flowserve Corp. - Overview
- Exhibits215: Flowserve Corp. - Business segments
- Exhibits216: Flowserve Corp. - Key offerings
- Exhibits217: Flowserve Corp. - Segment focus
- Exhibits218: SWOT
- Exhibits219: Honeywell International Inc. - Overview
- Exhibits220: Honeywell International Inc. - Business segments
- Exhibits221: Honeywell International Inc. - Key news
- Exhibits222: Honeywell International Inc. - Key offerings
- Exhibits223: Honeywell International Inc. - Segment focus
- Exhibits224: SWOT
- Exhibits225: Moog Inc. - Overview
- Exhibits226: Moog Inc. - Business segments
- Exhibits227: Moog Inc. - Key offerings
- Exhibits228: Moog Inc. - Segment focus
- Exhibits229: SWOT
- Exhibits230: Parker Hannifin Corp. - Overview
- Exhibits231: Parker Hannifin Corp. - Business segments
- Exhibits232: Parker Hannifin Corp. - Key news
- Exhibits233: Parker Hannifin Corp. - Key offerings
- Exhibits234: Parker Hannifin Corp. - Segment focus
- Exhibits235: SWOT
- Exhibits236: Pentair Plc - Overview
- Exhibits237: Pentair Plc - Business segments
- Exhibits238: Pentair Plc - Key news
- Exhibits239: Pentair Plc - Key offerings
- Exhibits240: Pentair Plc - Segment focus
- Exhibits241: SWOT
- Exhibits242: ROTEX Controls Inc. - Overview
- Exhibits243: ROTEX Controls Inc. - Product / Service
- Exhibits244: ROTEX Controls Inc. - Key offerings
- Exhibits245: SWOT
- Exhibits246: Rotork Plc - Overview
- Exhibits247: Rotork Plc - Business segments
- Exhibits248: Rotork Plc - Key news
- Exhibits249: Rotork Plc - Key offerings
- Exhibits250: Rotork Plc - Segment focus
- Exhibits251: SWOT
- Exhibits252: Schlumberger Ltd. - Overview
- Exhibits253: Schlumberger Ltd. - Business segments
- Exhibits254: Schlumberger Ltd. - Key news
- Exhibits255: Schlumberger Ltd. - Key offerings
- Exhibits256: Schlumberger Ltd. - Segment focus
- Exhibits257: SWOT
- Exhibits258: Siemens AG - Overview
- Exhibits259: Siemens AG - Business segments
- Exhibits260: Siemens AG - Key news
- Exhibits261: Siemens AG - Key offerings
- Exhibits262: Siemens AG - Segment focus
- Exhibits263: SWOT
- Exhibits264: SMC Corp. - Overview
- Exhibits265: SMC Corp. - Product / Service
- Exhibits266: SMC Corp. - Key offerings
- Exhibits267: SWOT
- Exhibits268: Inclusions checklist
- Exhibits269: Exclusions checklist
- Exhibits270: Currency conversion rates for US$
- Exhibits271: Research methodology
- Exhibits272: Information sources
- Exhibits273: Data validation
- Exhibits274: Validation techniques employed for market sizing
- Exhibits275: Data synthesis
- Exhibits276: 360 degree market analysis
- Exhibits277: List of abbreviations
The pneumatic actuator market is forecasted to grow by USD 1231.6 million during 2024-2029, accelerating at a CAGR of 5.8% during the forecast period. The report on the pneumatic actuator market provides a holistic analysis, market size and forecast, trends, growth drivers, and challenges, as well as vendor analysis covering around 25 vendors.
The report offers an up-to-date analysis regarding the current market scenario, the latest trends and drivers, and the overall market environment. The market is driven by increasing use of pneumatic actuators in food and beverage industry, increasing demand for pneumatic actuators from oil and gas industry, and increasing momentum of automation in industrial facilities.
| Market Scope | |
|---|---|
| Base Year | 2025 |
| End Year | 2029 |
| Series Year | 2025-2029 |
| Growth Momentum | Accelerate |
| YOY 2025 | 5.2% |
| CAGR | 5.8% |
| Incremental Value | $1231.6 mn |
The study was conducted using an objective combination of primary and secondary information including inputs from key participants in the industry. The report contains a comprehensive market size data, segment with regional analysis and vendor landscape in addition to an analysis of the key companies. Reports have historic and forecast data.
Technavio's pneumatic actuator market is segmented as below:
By Product Type
- Quarter-turn
- Multi-turn
- Linear
By End-user
- Chemical and petrochemical
- Oil and gas
- Power generation
- Mining
- Others
By Type
- Linear actuators
- Rotary actuators
By Capacity
- Light duty pneumatic actuator
- Heavy duty pneumatic actuator
By Geographical Landscape
- North America
- Europe
- APAC
- South America
- Middle East and Africa
This study identifies the adoption of IOT-enabled actuators for predictive maintenance as one of the prime reasons driving the pneumatic actuator market growth during the next few years. Also, use of electro-pneumatic actuators for position control and technological advances in soft pneumatic actuators in the robotic industry will lead to sizable demand in the market.
The report on the pneumatic actuator market covers the following areas:
- Pneumatic Actuator Market sizing
- Pneumatic Actuator Market forecast
- Pneumatic Actuator Market industry analysis
The robust vendor analysis is designed to help clients improve their market position, and in line with this, this report provides a detailed analysis of several leading pneumatic actuator market vendors that include ABB Ltd., AIRTECH PRODUCTS Inc., Crane Holdings Co., Eaton Corp. PLC, Emerson Electric Co., Festo SE and Co. KG, Flowserve Corp., Flowtorq Engineering Pvt. Ltd., HKS Dreh Antriebe GmbH, Honeywell International Inc., Marsh Automation Pvt. Ltd., Moog Inc., Parker Hannifin Corp., Pentair PLC, ROTEX Controls Inc., Rotork PLC, Schlumberger Ltd., Siemens AG, SMC Corp., and Tolomatic Inc.. Also, the pneumatic actuator market analysis report includes information on upcoming trends and challenges that will influence market growth. This is to help companies strategize and leverage all forthcoming growth opportunities.
The publisher presents a detailed picture of the market by the way of study, synthesis, and summation of data from multiple sources by an analysis of key parameters such as profit, pricing, competition, and promotions. It presents various market facets by identifying the key industry influencers. The data presented is comprehensive, reliable, and a result of extensive primary and secondary research. The market research reports provide a complete competitive landscape and an in-depth vendor selection methodology and analysis using qualitative and quantitative research to forecast accurate market growth.
Table of Contents
1 Executive Summary
- 1.1 Market overview
- Executive Summary - Chart on Market Overview
- Executive Summary - Data Table on Market Overview
- Executive Summary - Chart on Global Market Characteristics
- Executive Summary - Chart on Market By Geographical Landscape
- Executive Summary - Chart on Market Segmentation by Product Type
- Executive Summary - Chart on Market Segmentation by End-user
- Executive Summary - Chart on Market Segmentation by Type
- Executive Summary - Chart on Market Segmentation by Capacity
- Executive Summary - Chart on Incremental Growth
- Executive Summary - Data Table on Incremental Growth
- Executive Summary - Chart on Company Market Positioning
2 Technavio Analysis
- 2.1 Analysis of price sensitivity, lifecycle, customer purchase basket, adoption rates, and purchase criteria
- Analysis of price sensitivity, lifecycle, customer purchase basket, adoption rates, and purchase criteria
- 2.2 Criticality of inputs and Factors of differentiation
- Overview on criticality of inputs and factors of differentiation
- 2.3 Factors of disruption
- Overview on factors of disruption
- 2.4 Impact of drivers and challenges
- Impact of drivers and challenges in 2024 and 2029
3 Market Landscape
- 3.1 Market ecosystem
- Parent Market
- Data Table on - Parent Market
- 3.2 Market characteristics
- Market characteristics analysis
- 3.3 Value chain analysis
- Value chain analysis
4 Market Sizing
- 4.1 Market definition
- Offerings of companies included in the market definition
- 4.2 Market segment analysis
- Market segments
- 4.3 Market size 2024
- 4.4 Market outlook: Forecast for 2024-2029
- Chart on Global - Market size and forecast 2024-2029 ($ million)
- Data Table on Global - Market size and forecast 2024-2029 ($ million)
- Chart on Global Market: Year-over-year growth 2024-2029 (%)
- Data Table on Global Market: Year-over-year growth 2024-2029 (%)
5 Historic Market Size
- 5.1 Global Pneumatic Actuator Market 2019 - 2023
- Historic Market Size - Data Table on Global Pneumatic Actuator Market 2019 - 2023 ($ million)
- 5.2 Product Type segment analysis 2019 - 2023
- Historic Market Size - Product Type Segment 2019 - 2023 ($ million)
- 5.3 End-user segment analysis 2019 - 2023
- Historic Market Size - End-user Segment 2019 - 2023 ($ million)
- 5.4 Type segment analysis 2019 - 2023
- Historic Market Size - Type Segment 2019 - 2023 ($ million)
- 5.5 Capacity segment analysis 2019 - 2023
- Historic Market Size - Capacity Segment 2019 - 2023 ($ million)
- 5.6 Geography segment analysis 2019 - 2023
- Historic Market Size - Geography Segment 2019 - 2023 ($ million)
- 5.7 Country segment analysis 2019 - 2023
- Historic Market Size - Country Segment 2019 - 2023 ($ million)
6 Qualitative Analysis
- 6.1 Impact of AI on global pneumatic actuator market
7 Five Forces Analysis
- 7.1 Five forces summary
- Five forces analysis - Comparison between 2024 and 2029
- 7.2 Bargaining power of buyers
- Bargaining power of buyers - Impact of key factors 2024 and 2029
- 7.3 Bargaining power of suppliers
- Bargaining power of suppliers - Impact of key factors in 2024 and 2029
- 7.4 Threat of new entrants
- Threat of new entrants - Impact of key factors in 2024 and 2029
- 7.5 Threat of substitutes
- Threat of substitutes - Impact of key factors in 2024 and 2029
- 7.6 Threat of rivalry
- Threat of rivalry - Impact of key factors in 2024 and 2029
- 7.7 Market condition
- Chart on Market condition - Five forces 2024 and 2029
8 Market Segmentation by Product Type
- 8.1 Market segments
- Chart on Product Type - Market share 2024-2029 (%)
- Data Table on Product Type - Market share 2024-2029 (%)
- 8.2 Comparison by Product Type
- Chart on Comparison by Product Type
- Data Table on Comparison by Product Type
- 8.3 Quarter-turn - Market size and forecast 2024-2029
- Chart on Quarter-turn - Market size and forecast 2024-2029 ($ million)
- Data Table on Quarter-turn - Market size and forecast 2024-2029 ($ million)
- Chart on Quarter-turn - Year-over-year growth 2024-2029 (%)
- Data Table on Quarter-turn - Year-over-year growth 2024-2029 (%)
- 8.4 Multi-turn - Market size and forecast 2024-2029
- Chart on Multi-turn - Market size and forecast 2024-2029 ($ million)
- Data Table on Multi-turn - Market size and forecast 2024-2029 ($ million)
- Chart on Multi-turn - Year-over-year growth 2024-2029 (%)
- Data Table on Multi-turn - Year-over-year growth 2024-2029 (%)
- 8.5 Linear - Market size and forecast 2024-2029
- Chart on Linear - Market size and forecast 2024-2029 ($ million)
- Data Table on Linear - Market size and forecast 2024-2029 ($ million)
- Chart on Linear - Year-over-year growth 2024-2029 (%)
- Data Table on Linear - Year-over-year growth 2024-2029 (%)
- 8.6 Market opportunity by Product Type
- Market opportunity by Product Type ($ million)
- Data Table on Market opportunity by Product Type ($ million)
9 Market Segmentation by End-user
- 9.1 Market segments
- Chart on End-user - Market share 2024-2029 (%)
- Data Table on End-user - Market share 2024-2029 (%)
- 9.2 Comparison by End-user
- Chart on Comparison by End-user
- Data Table on Comparison by End-user
- 9.3 Chemical and petrochemical - Market size and forecast 2024-2029
- Chart on Chemical and petrochemical - Market size and forecast 2024-2029 ($ million)
- Data Table on Chemical and petrochemical - Market size and forecast 2024-2029 ($ million)
- Chart on Chemical and petrochemical - Year-over-year growth 2024-2029 (%)
- Data Table on Chemical and petrochemical - Year-over-year growth 2024-2029 (%)
- 9.4 Oil and gas - Market size and forecast 2024-2029
- Chart on Oil and gas - Market size and forecast 2024-2029 ($ million)
- Data Table on Oil and gas - Market size and forecast 2024-2029 ($ million)
- Chart on Oil and gas - Year-over-year growth 2024-2029 (%)
- Data Table on Oil and gas - Year-over-year growth 2024-2029 (%)
- 9.5 Power generation - Market size and forecast 2024-2029
- Chart on Power generation - Market size and forecast 2024-2029 ($ million)
- Data Table on Power generation - Market size and forecast 2024-2029 ($ million)
- Chart on Power generation - Year-over-year growth 2024-2029 (%)
- Data Table on Power generation - Year-over-year growth 2024-2029 (%)
- 9.6 Mining - Market size and forecast 2024-2029
- Chart on Mining - Market size and forecast 2024-2029 ($ million)
- Data Table on Mining - Market size and forecast 2024-2029 ($ million)
- Chart on Mining - Year-over-year growth 2024-2029 (%)
- Data Table on Mining - Year-over-year growth 2024-2029 (%)
- 9.7 Others - Market size and forecast 2024-2029
- Chart on Others - Market size and forecast 2024-2029 ($ million)
- Data Table on Others - Market size and forecast 2024-2029 ($ million)
- Chart on Others - Year-over-year growth 2024-2029 (%)
- Data Table on Others - Year-over-year growth 2024-2029 (%)
- 9.8 Market opportunity by End-user
- Market opportunity by End-user ($ million)
- Data Table on Market opportunity by End-user ($ million)
10 Market Segmentation by Type
- 10.1 Market segments
- Chart on Type - Market share 2024-2029 (%)
- Data Table on Type - Market share 2024-2029 (%)
- 10.2 Comparison by Type
- Chart on Comparison by Type
- Data Table on Comparison by Type
- 10.3 Linear actuators - Market size and forecast 2024-2029
- Chart on Linear actuators - Market size and forecast 2024-2029 ($ million)
- Data Table on Linear actuators - Market size and forecast 2024-2029 ($ million)
- Chart on Linear actuators - Year-over-year growth 2024-2029 (%)
- Data Table on Linear actuators - Year-over-year growth 2024-2029 (%)
- 10.4 Rotary actuators - Market size and forecast 2024-2029
- Chart on Rotary actuators - Market size and forecast 2024-2029 ($ million)
- Data Table on Rotary actuators - Market size and forecast 2024-2029 ($ million)
- Chart on Rotary actuators - Year-over-year growth 2024-2029 (%)
- Data Table on Rotary actuators - Year-over-year growth 2024-2029 (%)
- 10.5 Market opportunity by Type
- Market opportunity by Type ($ million)
- Data Table on Market opportunity by Type ($ million)
11 Market Segmentation by Capacity
- 11.1 Market segments
- Chart on Capacity - Market share 2024-2029 (%)
- Data Table on Capacity - Market share 2024-2029 (%)
- 11.2 Comparison by Capacity
- Chart on Comparison by Capacity
- Data Table on Comparison by Capacity
- 11.3 Light duty pneumatic actuator - Market size and forecast 2024-2029
- Chart on Light duty pneumatic actuator - Market size and forecast 2024-2029 ($ million)
- Data Table on Light duty pneumatic actuator - Market size and forecast 2024-2029 ($ million)
- Chart on Light duty pneumatic actuator - Year-over-year growth 2024-2029 (%)
- Data Table on Light duty pneumatic actuator - Year-over-year growth 2024-2029 (%)
- 11.4 Heavy duty pneumatic actuator - Market size and forecast 2024-2029
- Chart on Heavy duty pneumatic actuator - Market size and forecast 2024-2029 ($ million)
- Data Table on Heavy duty pneumatic actuator - Market size and forecast 2024-2029 ($ million)
- Chart on Heavy duty pneumatic actuator - Year-over-year growth 2024-2029 (%)
- Data Table on Heavy duty pneumatic actuator - Year-over-year growth 2024-2029 (%)
- 11.5 Market opportunity by Capacity
- Market opportunity by Capacity ($ million)
- Data Table on Market opportunity by Capacity ($ million)
12 Customer Landscape
- 12.1 Customer landscape overview
- Analysis of price sensitivity, lifecycle, customer purchase basket, adoption rates, and purchase criteria
13 Geographic Landscape
- 13.1 Geographic segmentation
- Chart on Market share By Geographical Landscape 2024-2029 (%)
- Data Table on Market share By Geographical Landscape 2024-2029 (%)
- 13.2 Geographic comparison
- Chart on Geographic comparison
- Data Table on Geographic comparison
- 13.3 North America - Market size and forecast 2024-2029
- Chart on North America - Market size and forecast 2024-2029 ($ million)
- Data Table on North America - Market size and forecast 2024-2029 ($ million)
- Chart on North America - Year-over-year growth 2024-2029 (%)
- Data Table on North America - Year-over-year growth 2024-2029 (%)
- 13.4 Europe - Market size and forecast 2024-2029
- Chart on Europe - Market size and forecast 2024-2029 ($ million)
- Data Table on Europe - Market size and forecast 2024-2029 ($ million)
- Chart on Europe - Year-over-year growth 2024-2029 (%)
- Data Table on Europe - Year-over-year growth 2024-2029 (%)
- 13.5 APAC - Market size and forecast 2024-2029
- Chart on APAC - Market size and forecast 2024-2029 ($ million)
- Data Table on APAC - Market size and forecast 2024-2029 ($ million)
- Chart on APAC - Year-over-year growth 2024-2029 (%)
- Data Table on APAC - Year-over-year growth 2024-2029 (%)
- 13.6 South America - Market size and forecast 2024-2029
- Chart on South America - Market size and forecast 2024-2029 ($ million)
- Data Table on South America - Market size and forecast 2024-2029 ($ million)
- Chart on South America - Year-over-year growth 2024-2029 (%)
- Data Table on South America - Year-over-year growth 2024-2029 (%)
- 13.7 Middle East and Africa - Market size and forecast 2024-2029
- Chart on Middle East and Africa - Market size and forecast 2024-2029 ($ million)
- Data Table on Middle East and Africa - Market size and forecast 2024-2029 ($ million)
- Chart on Middle East and Africa - Year-over-year growth 2024-2029 (%)
- Data Table on Middle East and Africa - Year-over-year growth 2024-2029 (%)
- 13.8 US - Market size and forecast 2024-2029
- Chart on US - Market size and forecast 2024-2029 ($ million)
- Data Table on US - Market size and forecast 2024-2029 ($ million)
- Chart on US - Year-over-year growth 2024-2029 (%)
- Data Table on US - Year-over-year growth 2024-2029 (%)
- 13.9 Canada - Market size and forecast 2024-2029
- Chart on Canada - Market size and forecast 2024-2029 ($ million)
- Data Table on Canada - Market size and forecast 2024-2029 ($ million)
- Chart on Canada - Year-over-year growth 2024-2029 (%)
- Data Table on Canada - Year-over-year growth 2024-2029 (%)
- 13.10 China - Market size and forecast 2024-2029
- Chart on China - Market size and forecast 2024-2029 ($ million)
- Data Table on China - Market size and forecast 2024-2029 ($ million)
- Chart on China - Year-over-year growth 2024-2029 (%)
- Data Table on China - Year-over-year growth 2024-2029 (%)
- 13.11 Germany - Market size and forecast 2024-2029
- Chart on Germany - Market size and forecast 2024-2029 ($ million)
- Data Table on Germany - Market size and forecast 2024-2029 ($ million)
- Chart on Germany - Year-over-year growth 2024-2029 (%)
- Data Table on Germany - Year-over-year growth 2024-2029 (%)
- 13.12 Japan - Market size and forecast 2024-2029
- Chart on Japan - Market size and forecast 2024-2029 ($ million)
- Data Table on Japan - Market size and forecast 2024-2029 ($ million)
- Chart on Japan - Year-over-year growth 2024-2029 (%)
- Data Table on Japan - Year-over-year growth 2024-2029 (%)
- 13.13 UK - Market size and forecast 2024-2029
- Chart on UK - Market size and forecast 2024-2029 ($ million)
- Data Table on UK - Market size and forecast 2024-2029 ($ million)
- Chart on UK - Year-over-year growth 2024-2029 (%)
- Data Table on UK - Year-over-year growth 2024-2029 (%)
- 13.14 India - Market size and forecast 2024-2029
- Chart on India - Market size and forecast 2024-2029 ($ million)
- Data Table on India - Market size and forecast 2024-2029 ($ million)
- Chart on India - Year-over-year growth 2024-2029 (%)
- Data Table on India - Year-over-year growth 2024-2029 (%)
- 13.15 France - Market size and forecast 2024-2029
- Chart on France - Market size and forecast 2024-2029 ($ million)
- Data Table on France - Market size and forecast 2024-2029 ($ million)
- Chart on France - Year-over-year growth 2024-2029 (%)
- Data Table on France - Year-over-year growth 2024-2029 (%)
- 13.16 Brazil - Market size and forecast 2024-2029
- Chart on Brazil - Market size and forecast 2024-2029 ($ million)
- Data Table on Brazil - Market size and forecast 2024-2029 ($ million)
- Chart on Brazil - Year-over-year growth 2024-2029 (%)
- Data Table on Brazil - Year-over-year growth 2024-2029 (%)
- 13.17 Italy - Market size and forecast 2024-2029
- Chart on Italy - Market size and forecast 2024-2029 ($ million)
- Data Table on Italy - Market size and forecast 2024-2029 ($ million)
- Chart on Italy - Year-over-year growth 2024-2029 (%)
- Data Table on Italy - Year-over-year growth 2024-2029 (%)
- 13.18 Market opportunity By Geographical Landscape
- Market opportunity By Geographical Landscape ($ million)
- Data Tables on Market opportunity By Geographical Landscape ($ million)
14 Drivers, Challenges, and Opportunity/Restraints
- 14.1 Market drivers
- 14.2 Market challenges
- 14.3 Impact of drivers and challenges
- Impact of drivers and challenges in 2024 and 2029
- 14.4 Market opportunities/restraints
15 Competitive Landscape
- 15.1 Overview
- 15.2 Competitive Landscape
- Overview on criticality of inputs and factors of differentiation
- 15.3 Landscape disruption
- Overview on factors of disruption
- 15.4 Industry risks
- Impact of key risks on business
16 Competitive Analysis
- 16.1 Companies profiled
- Companies covered
- 16.2 Company ranking index
- Company ranking index
- 16.3 Market positioning of companies
- Matrix on companies position and classification
- 16.4 ABB Ltd.
- ABB Ltd. - Overview
- ABB Ltd. - Business segments
- ABB Ltd. - Key news
- ABB Ltd. - Key offerings
- ABB Ltd. - Segment focus
- SWOT
- 16.5 AIRTECH PRODUCTS Inc.
- AIRTECH PRODUCTS Inc. - Overview
- AIRTECH PRODUCTS Inc. - Product / Service
- AIRTECH PRODUCTS Inc. - Key offerings
- SWOT
- 16.6 Crane Holdings Co.
- Crane Holdings Co. - Overview
- Crane Holdings Co. - Business segments
- Crane Holdings Co. - Key news
- Crane Holdings Co. - Key offerings
- Crane Holdings Co. - Segment focus
- SWOT
- 16.7 Eaton Corp. plc
- Eaton Corp. plc - Overview
- Eaton Corp. plc - Business segments
- Eaton Corp. plc - Key news
- Eaton Corp. plc - Key offerings
- Eaton Corp. plc - Segment focus
- SWOT
- 16.8 Emerson Electric Co.
- Emerson Electric Co. - Overview
- Emerson Electric Co. - Business segments
- Emerson Electric Co. - Key news
- Emerson Electric Co. - Key offerings
- Emerson Electric Co. - Segment focus
- SWOT
- 16.9 Flowserve Corp.
- Flowserve Corp. - Overview
- Flowserve Corp. - Business segments
- Flowserve Corp. - Key offerings
- Flowserve Corp. - Segment focus
- SWOT
- 16.10 Honeywell International Inc.
- Honeywell International Inc. - Overview
- Honeywell International Inc. - Business segments
- Honeywell International Inc. - Key news
- Honeywell International Inc. - Key offerings
- Honeywell International Inc. - Segment focus
- SWOT
- 16.11 Moog Inc.
- Moog Inc. - Overview
- Moog Inc. - Business segments
- Moog Inc. - Key offerings
- Moog Inc. - Segment focus
- SWOT
- 16.12 Parker Hannifin Corp.
- Parker Hannifin Corp. - Overview
- Parker Hannifin Corp. - Business segments
- Parker Hannifin Corp. - Key news
- Parker Hannifin Corp. - Key offerings
- Parker Hannifin Corp. - Segment focus
- SWOT
- 16.13 Pentair Plc
- Pentair Plc - Overview
- Pentair Plc - Business segments
- Pentair Plc - Key news
- Pentair Plc - Key offerings
- Pentair Plc - Segment focus
- SWOT
- 16.14 ROTEX Controls Inc.
- ROTEX Controls Inc. - Overview
- ROTEX Controls Inc. - Product / Service
- ROTEX Controls Inc. - Key offerings
- SWOT
- 16.15 Rotork Plc
- Rotork Plc - Overview
- Rotork Plc - Business segments
- Rotork Plc - Key news
- Rotork Plc - Key offerings
- Rotork Plc - Segment focus
- SWOT
- 16.16 Schlumberger Ltd.
- Schlumberger Ltd. - Overview
- Schlumberger Ltd. - Business segments
- Schlumberger Ltd. - Key news
- Schlumberger Ltd. - Key offerings
- Schlumberger Ltd. - Segment focus
- SWOT
- 16.17 Siemens AG
- Siemens AG - Overview
- Siemens AG - Business segments
- Siemens AG - Key news
- Siemens AG - Key offerings
- Siemens AG - Segment focus
- SWOT
- 16.18 SMC Corp.
- SMC Corp. - Overview
- SMC Corp. - Product / Service
- SMC Corp. - Key offerings
- SWOT
17 Appendix
- 17.1 Scope of the report
- 17.2 Inclusions and exclusions checklist
- Inclusions checklist
- Exclusions checklist
- 17.3 Currency conversion rates for US$
- Currency conversion rates for US$
- 17.4 Research methodology
- Research methodology
- 17.5 Data procurement
- Information sources
- 17.6 Data validation
- Data validation
- 17.7 Validation techniques employed for market sizing
- Validation techniques employed for market sizing
- 17.8 Data synthesis
- Data synthesis
- 17.9 360 degree market analysis
- 360 degree market analysis
- 17.10 List of abbreviations
- List of abbreviations

