|
|
市場調査レポート
商品コード
1557649
バイオポリマーとバイオプラスチックの世界市場 2024-2028Global Biopolymers and Bioplastic Market 2024-2028 |
||||||

|
|||||||
カスタマイズ可能
|
|||||||

| バイオポリマーとバイオプラスチックの世界市場 2024-2028 |
|
出版日: 2024年08月01日
発行: TechNavio
ページ情報: 英文 181 Pages
納期: 即納可能
|

全表示
- 概要
- 図表
- 目次
バイオポリマーとバイオプラスチック市場は2023-2028年に1,200億米ドル、予測期間中のCAGRは18.54%で成長すると予測されます。
当レポートでは、バイオポリマーとバイオプラスチック市場の全体的な分析、市場規模・予測、動向、成長促進要因、課題、約25のベンダーを網羅したベンダー分析などを掲載しています。
現在の市場シナリオ、最新動向と促進要因、市場環境全体に関する最新分析を提供しています。バイオベースや再生可能な原材料の出現、バイオプラスチックやバイオポリマーの注目度の高まり、バイオポリマーの使用や効率的なプラスチック廃棄物管理に対する政府の重点化などが市場を牽引しています。
| 市場範囲 | |
|---|---|
| 基準年 | 2024 |
| 終了年 | 2028 |
| 予測期間 | 2024-2028 |
| 成長モメンタム | 加速 |
| 前年比2024年 | 15.2% |
| CAGR | 18.54% |
| 増分額 | 1,200億米ドル |
本調査では、持続可能な生産への注目が、今後数年間のバイオポリマーとバイオプラスチック市場の成長を促進する主な理由の1つであるとしています。また、費用対効果の高いバイオベースの原材料の入手可能性や、環境に優しいパッケージングに対する消費者の嗜好の変化も、市場の大きな需要につながると思われます。
目次
第1章 エグゼクティブサマリー
- 市場概要
第2章 市場情勢
- 市場エコシステム
- 市場の特徴
- バリューチェーン分析
第3章 市場規模の評価
- 市場の定義
- 市場セグメント分析
- 市場規模 2023
- 市場の見通し 2023-2028
第4章 市場規模実績
- バイオポリマーとバイオプラスチックの世界市場 2018-2022
- エンドユーザー別セグメント分析 2018-2022
- タイプ別セグメント分析 2018-2022
- 地域別セグメント分析 2018-2022
- 国別セグメント分析 2018-2022
第5章 ファイブフォース分析
- ファイブフォースの要約
- 買い手の交渉力
- 供給企業の交渉力
- 新規参入業者の脅威
- 代替品の脅威
- 競争の脅威
- 市況
第6章 市場セグメンテーション:エンドユーザー別
- 市場セグメンテーション
- 比較:エンドユーザー別
- 包装:市場規模と予測 2023-2028
- 消費財:市場規模と予測 2023-2028
- その他:市場規模と予測 2023-2028
- 市場機会:エンドユーザー別
第7章 市場セグメンテーション:タイプ別
- 市場セグメンテーション
- 比較:タイプ別
- バイオPE:市場規模と予測 2023-2028
- バイオPET:市場規模と予測 2023-2028
- PLA(ポリ乳酸):市場規模と予測 2023-2028
- 生分解性デンプン混合物:市場規模と予測 2023-2028
- その他:市場規模と予測 2023-2028
- 市場機会:タイプ別
第8章 顧客情勢
- 顧客情勢の概要
第9章 地域別情勢
- 地域別セグメンテーション
- 地域別比較
- 欧州:市場規模と予測 2023-2028
- アジア太平洋:市場規模と予測 2023-2028
- 北米:市場規模と予測 2023-2028
- 南米:市場規模と予測 2023-2028
- 中東・アフリカ:市場規模と予測 2023-2028
- ドイツ:市場規模と予測 2023-2028
- 米国:市場規模と予測 2023-2028
- 中国:市場規模と予測 2023-2028
- 英国:市場規模と予測 2023-2028
- 日本:市場規模と予測 2023-2028
- 市場機会:地域別
第10章 促進要因・課題・機会・抑制要因
- 市場促進要因
- 市場の課題
- 促進要因と課題の影響
- 市場の機会・抑制要因
第11章 競合情勢
- 概要
- 競合情勢
- 混乱の状況
- 業界のリスク
第12章 競合分析
- 企業プロファイル
- 企業の市場ポジショニング
- AGRANA Beteiligungs AG
- AKRO PLASTIC GmbH
- Arkema SA
- BASF SE
- Biome Bioplastics Ltd.
- Biotec GmbH Co. and KG
- Braskem SA
- Carbiolice
- Cardia Bioplastics
- Cargill Inc.
- Fkur Kunststoff GmbH
- Futerro SA
- Green Dot Bioplastics Inc.
- Ingevity Corp.
- Mitsubishi Chemical Group Corp.
第13章 付録
Exhibits:
- Exhibits1: Executive Summary - Chart on Market Overview
- Exhibits2: Executive Summary - Data Table on Market Overview
- Exhibits3: Executive Summary - Chart on Global Market Characteristics
- Exhibits4: Executive Summary - Chart on Market by Geography
- Exhibits5: Executive Summary - Chart on Market Segmentation by End-user
- Exhibits6: Executive Summary - Chart on Market Segmentation by Type
- Exhibits7: Executive Summary - Chart on Incremental Growth
- Exhibits8: Executive Summary - Data Table on Incremental Growth
- Exhibits9: Executive Summary - Chart on Company Market Positioning
- Exhibits10: Parent Market
- Exhibits11: Data Table on - Parent Market
- Exhibits12: Market characteristics analysis
- Exhibits13: Value Chain Analysis
- Exhibits14: Offerings of companies included in the market definition
- Exhibits15: Market segments
- Exhibits16: Chart on Global - Market size and forecast 2023-2028 ($ billion)
- Exhibits17: Data Table on Global - Market size and forecast 2023-2028 ($ billion)
- Exhibits18: Chart on Global Market: Year-over-year growth 2023-2028 (%)
- Exhibits19: Data Table on Global Market: Year-over-year growth 2023-2028 (%)
- Exhibits20: Historic Market Size - Data Table on Global Biopolymers And Bioplastic Market 2018 - 2022 ($ billion)
- Exhibits21: Historic Market Size - End-user Segment 2018 - 2022 ($ billion)
- Exhibits22: Historic Market Size - Type Segment 2018 - 2022 ($ billion)
- Exhibits23: Historic Market Size - Geography Segment 2018 - 2022 ($ billion)
- Exhibits24: Historic Market Size - Country Segment 2018 - 2022 ($ billion)
- Exhibits25: Five forces analysis - Comparison between 2023 and 2028
- Exhibits26: Bargaining power of buyers - Impact of key factors 2023 and 2028
- Exhibits27: Bargaining power of suppliers - Impact of key factors in 2023 and 2028
- Exhibits28: Threat of new entrants - Impact of key factors in 2023 and 2028
- Exhibits29: Threat of substitutes - Impact of key factors in 2023 and 2028
- Exhibits30: Threat of rivalry - Impact of key factors in 2023 and 2028
- Exhibits31: Chart on Market condition - Five forces 2023 and 2028
- Exhibits32: Chart on End-user - Market share 2023-2028 (%)
- Exhibits33: Data Table on End-user - Market share 2023-2028 (%)
- Exhibits34: Chart on Comparison by End-user
- Exhibits35: Data Table on Comparison by End-user
- Exhibits36: Chart on Packaging - Market size and forecast 2023-2028 ($ billion)
- Exhibits37: Data Table on Packaging - Market size and forecast 2023-2028 ($ billion)
- Exhibits38: Chart on Packaging - Year-over-year growth 2023-2028 (%)
- Exhibits39: Data Table on Packaging - Year-over-year growth 2023-2028 (%)
- Exhibits40: Chart on Consumer goods - Market size and forecast 2023-2028 ($ billion)
- Exhibits41: Data Table on Consumer goods - Market size and forecast 2023-2028 ($ billion)
- Exhibits42: Chart on Consumer goods - Year-over-year growth 2023-2028 (%)
- Exhibits43: Data Table on Consumer goods - Year-over-year growth 2023-2028 (%)
- Exhibits44: Chart on Others - Market size and forecast 2023-2028 ($ billion)
- Exhibits45: Data Table on Others - Market size and forecast 2023-2028 ($ billion)
- Exhibits46: Chart on Others - Year-over-year growth 2023-2028 (%)
- Exhibits47: Data Table on Others - Year-over-year growth 2023-2028 (%)
- Exhibits48: Market opportunity by End-user ($ billion)
- Exhibits49: Data Table on Market opportunity by End-user ($ billion)
- Exhibits50: Chart on Type - Market share 2023-2028 (%)
- Exhibits51: Data Table on Type - Market share 2023-2028 (%)
- Exhibits52: Chart on Comparison by Type
- Exhibits53: Data Table on Comparison by Type
- Exhibits54: Chart on Bio-PE - Market size and forecast 2023-2028 ($ billion)
- Exhibits55: Data Table on Bio-PE - Market size and forecast 2023-2028 ($ billion)
- Exhibits56: Chart on Bio-PE - Year-over-year growth 2023-2028 (%)
- Exhibits57: Data Table on Bio-PE - Year-over-year growth 2023-2028 (%)
- Exhibits58: Chart on Bio-PET - Market size and forecast 2023-2028 ($ billion)
- Exhibits59: Data Table on Bio-PET - Market size and forecast 2023-2028 ($ billion)
- Exhibits60: Chart on Bio-PET - Year-over-year growth 2023-2028 (%)
- Exhibits61: Data Table on Bio-PET - Year-over-year growth 2023-2028 (%)
- Exhibits62: Chart on PLA - Market size and forecast 2023-2028 ($ billion)
- Exhibits63: Data Table on PLA - Market size and forecast 2023-2028 ($ billion)
- Exhibits64: Chart on PLA - Year-over-year growth 2023-2028 (%)
- Exhibits65: Data Table on PLA - Year-over-year growth 2023-2028 (%)
- Exhibits66: Chart on Biodegradable starch blends - Market size and forecast 2023-2028 ($ billion)
- Exhibits67: Data Table on Biodegradable starch blends - Market size and forecast 2023-2028 ($ billion)
- Exhibits68: Chart on Biodegradable starch blends - Year-over-year growth 2023-2028 (%)
- Exhibits69: Data Table on Biodegradable starch blends - Year-over-year growth 2023-2028 (%)
- Exhibits70: Chart on Others - Market size and forecast 2023-2028 ($ billion)
- Exhibits71: Data Table on Others - Market size and forecast 2023-2028 ($ billion)
- Exhibits72: Chart on Others - Year-over-year growth 2023-2028 (%)
- Exhibits73: Data Table on Others - Year-over-year growth 2023-2028 (%)
- Exhibits74: Market opportunity by Type ($ billion)
- Exhibits75: Data Table on Market opportunity by Type ($ billion)
- Exhibits76: Analysis of price sensitivity, lifecycle, customer purchase basket, adoption rates, and purchase criteria
- Exhibits77: Chart on Market share by geography 2023-2028 (%)
- Exhibits78: Data Table on Market share by geography 2023-2028 (%)
- Exhibits79: Chart on Geographic comparison
- Exhibits80: Data Table on Geographic comparison
- Exhibits81: Chart on Europe - Market size and forecast 2023-2028 ($ billion)
- Exhibits82: Data Table on Europe - Market size and forecast 2023-2028 ($ billion)
- Exhibits83: Chart on Europe - Year-over-year growth 2023-2028 (%)
- Exhibits84: Data Table on Europe - Year-over-year growth 2023-2028 (%)
- Exhibits85: Chart on APAC - Market size and forecast 2023-2028 ($ billion)
- Exhibits86: Data Table on APAC - Market size and forecast 2023-2028 ($ billion)
- Exhibits87: Chart on APAC - Year-over-year growth 2023-2028 (%)
- Exhibits88: Data Table on APAC - Year-over-year growth 2023-2028 (%)
- Exhibits89: Chart on North America - Market size and forecast 2023-2028 ($ billion)
- Exhibits90: Data Table on North America - Market size and forecast 2023-2028 ($ billion)
- Exhibits91: Chart on North America - Year-over-year growth 2023-2028 (%)
- Exhibits92: Data Table on North America - Year-over-year growth 2023-2028 (%)
- Exhibits93: Chart on South America - Market size and forecast 2023-2028 ($ billion)
- Exhibits94: Data Table on South America - Market size and forecast 2023-2028 ($ billion)
- Exhibits95: Chart on South America - Year-over-year growth 2023-2028 (%)
- Exhibits96: Data Table on South America - Year-over-year growth 2023-2028 (%)
- Exhibits97: Chart on Middle East and Africa - Market size and forecast 2023-2028 ($ billion)
- Exhibits98: Data Table on Middle East and Africa - Market size and forecast 2023-2028 ($ billion)
- Exhibits99: Chart on Middle East and Africa - Year-over-year growth 2023-2028 (%)
- Exhibits100: Data Table on Middle East and Africa - Year-over-year growth 2023-2028 (%)
- Exhibits101: Chart on Germany - Market size and forecast 2023-2028 ($ billion)
- Exhibits102: Data Table on Germany - Market size and forecast 2023-2028 ($ billion)
- Exhibits103: Chart on Germany - Year-over-year growth 2023-2028 (%)
- Exhibits104: Data Table on Germany - Year-over-year growth 2023-2028 (%)
- Exhibits105: Chart on US - Market size and forecast 2023-2028 ($ billion)
- Exhibits106: Data Table on US - Market size and forecast 2023-2028 ($ billion)
- Exhibits107: Chart on US - Year-over-year growth 2023-2028 (%)
- Exhibits108: Data Table on US - Year-over-year growth 2023-2028 (%)
- Exhibits109: Chart on China - Market size and forecast 2023-2028 ($ billion)
- Exhibits110: Data Table on China - Market size and forecast 2023-2028 ($ billion)
- Exhibits111: Chart on China - Year-over-year growth 2023-2028 (%)
- Exhibits112: Data Table on China - Year-over-year growth 2023-2028 (%)
- Exhibits113: Chart on UK - Market size and forecast 2023-2028 ($ billion)
- Exhibits114: Data Table on UK - Market size and forecast 2023-2028 ($ billion)
- Exhibits115: Chart on UK - Year-over-year growth 2023-2028 (%)
- Exhibits116: Data Table on UK - Year-over-year growth 2023-2028 (%)
- Exhibits117: Chart on Japan - Market size and forecast 2023-2028 ($ billion)
- Exhibits118: Data Table on Japan - Market size and forecast 2023-2028 ($ billion)
- Exhibits119: Chart on Japan - Year-over-year growth 2023-2028 (%)
- Exhibits120: Data Table on Japan - Year-over-year growth 2023-2028 (%)
- Exhibits121: Market opportunity by geography ($ billion)
- Exhibits122: Data Tables on Market opportunity by geography ($ billion)
- Exhibits123: Impact of drivers and challenges in 2023 and 2028
- Exhibits124: Overview on criticality of inputs and factors of differentiation
- Exhibits125: Overview on factors of disruption
- Exhibits126: Impact of key risks on business
- Exhibits127: Companies covered
- Exhibits128: Matrix on companies position and classification
- Exhibits129: AGRANA Beteiligungs AG - Overview
- Exhibits130: AGRANA Beteiligungs AG - Business segments
- Exhibits131: AGRANA Beteiligungs AG - Key news
- Exhibits132: AGRANA Beteiligungs AG - Key offerings
- Exhibits133: AGRANA Beteiligungs AG - Segment focus
- Exhibits134: AKRO PLASTIC GmbH - Overview
- Exhibits135: AKRO PLASTIC GmbH - Product / Service
- Exhibits136: AKRO PLASTIC GmbH - Key offerings
- Exhibits137: Arkema SA - Overview
- Exhibits138: Arkema SA - Business segments
- Exhibits139: Arkema SA - Key news
- Exhibits140: Arkema SA - Key offerings
- Exhibits141: Arkema SA - Segment focus
- Exhibits142: BASF SE - Overview
- Exhibits143: BASF SE - Business segments
- Exhibits144: BASF SE - Key news
- Exhibits145: BASF SE - Key offerings
- Exhibits146: BASF SE - Segment focus
- Exhibits147: Biome Bioplastics Ltd. - Overview
- Exhibits148: Biome Bioplastics Ltd. - Product / Service
- Exhibits149: Biome Bioplastics Ltd. - Key offerings
- Exhibits150: Biotec GmbH Co. and KG - Overview
- Exhibits151: Biotec GmbH Co. and KG - Product / Service
- Exhibits152: Biotec GmbH Co. and KG - Key offerings
- Exhibits153: Braskem SA - Overview
- Exhibits154: Braskem SA - Business segments
- Exhibits155: Braskem SA - Key news
- Exhibits156: Braskem SA - Key offerings
- Exhibits157: Braskem SA - Segment focus
- Exhibits158: Carbiolice - Overview
- Exhibits159: Carbiolice - Product / Service
- Exhibits160: Carbiolice - Key offerings
- Exhibits161: Cardia Bioplastics - Overview
- Exhibits162: Cardia Bioplastics - Product / Service
- Exhibits163: Cardia Bioplastics - Key offerings
- Exhibits164: Cargill Inc. - Overview
- Exhibits165: Cargill Inc. - Product / Service
- Exhibits166: Cargill Inc. - Key news
- Exhibits167: Cargill Inc. - Key offerings
- Exhibits168: Fkur Kunststoff GmbH - Overview
- Exhibits169: Fkur Kunststoff GmbH - Product / Service
- Exhibits170: Fkur Kunststoff GmbH - Key offerings
- Exhibits171: Futerro SA - Overview
- Exhibits172: Futerro SA - Product / Service
- Exhibits173: Futerro SA - Key offerings
- Exhibits174: Green Dot Bioplastics Inc. - Overview
- Exhibits175: Green Dot Bioplastics Inc. - Product / Service
- Exhibits176: Green Dot Bioplastics Inc. - Key offerings
- Exhibits177: Ingevity Corp. - Overview
- Exhibits178: Ingevity Corp. - Business segments
- Exhibits179: Ingevity Corp. - Key offerings
- Exhibits180: Ingevity Corp. - Segment focus
- Exhibits181: Mitsubishi Chemical Group Corp. - Overview
- Exhibits182: Mitsubishi Chemical Group Corp. - Business segments
- Exhibits183: Mitsubishi Chemical Group Corp. - Key news
- Exhibits184: Mitsubishi Chemical Group Corp. - Key offerings
- Exhibits185: Mitsubishi Chemical Group Corp. - Segment focus
- Exhibits186: Inclusions checklist
- Exhibits187: Exclusions checklist
- Exhibits188: Currency conversion rates for US$
- Exhibits189: Research methodology
- Exhibits190: Information sources
- Exhibits191: Data validation
- Exhibits192: Validation techniques employed for market sizing
- Exhibits193: Data synthesis
- Exhibits194: 360 degree market analysis
- Exhibits195: List of abbreviations
The biopolymers and bioplastic market is forecasted to grow by USD 120 billion during 2023-2028, accelerating at a CAGR of 18.54% during the forecast period. The report on the biopolymers and bioplastic market provides a holistic analysis, market size and forecast, trends, growth drivers, and challenges, as well as vendor analysis covering around 25 vendors.
The report offers an up-to-date analysis regarding the current market scenario, the latest trends and drivers, and the overall market environment. The market is driven by emergence of bio-based and renewable raw materials, growing prominence of bioplastics and biopolymers, and government emphasis on use of biopolymers and efficient plastic waste management.
Technavio's biopolymers and bioplastic market is segmented as below:
| Market Scope | |
|---|---|
| Base Year | 2024 |
| End Year | 2028 |
| Series Year | 2024-2028 |
| Growth Momentum | Accelerate |
| YOY 2024 | 15.2% |
| CAGR | 18.54% |
| Incremental Value | $120bn |
By End-user
- Packaging
- Consumer goods
- Others
By Type
- Bio-PE
- Bio-PET
- PLA
- Biodegradable starch blends
- Others
By Geography
- Europe
- APAC
- North America
- South America
- Middle East and Africa
This study identifies the focus on sustainable production as one of the prime reasons driving the biopolymers and bioplastic market growth during the next few years. Also, availability of cost-effective bio-based raw materials and changing consumer preference toward eco-friendly packaging will lead to sizable demand in the market.
The report on the biopolymers and bioplastic market covers the following areas:
- Biopolymers and bioplastic market sizing
- Biopolymers and bioplastic market forecast
- Biopolymers and bioplastic market industry analysis
The robust vendor analysis is designed to help clients improve their market position, and in line with this, this report provides a detailed analysis of several leading biopolymers and bioplastic market vendors that include AGRANA Beteiligungs AG, AKRO PLASTIC GmbH, Arkema SA, BASF SE, Biome Bioplastics Ltd., Biotec GmbH Co. and KG, Braskem SA, Carbiolice, Cardia Bioplastics, Cargill Inc., Fkur Kunststoff GmbH, Futerro SA, Green Dot Bioplastics Inc., Ingevity Corp., Mitsubishi Chemical Group Corp., Novamont S.p.A., Plantic Technologies Ltd., TianAn Biologic Materials Co. Ltd., Toray Industries Inc., and TotalEnergies SE. Also, the biopolymers and bioplastic market analysis report includes information on upcoming trends and challenges that will influence market growth. This is to help companies strategize and leverage all forthcoming growth opportunities.
The study was conducted using an objective combination of primary and secondary information including inputs from key participants in the industry. The report contains a comprehensive market and vendor landscape in addition to an analysis of the key vendors.
The publisher presents a detailed picture of the market by the way of study, synthesis, and summation of data from multiple sources by an analysis of key parameters such as profit, pricing, competition, and promotions. It presents various market facets by identifying the key industry influencers. The data presented is comprehensive, reliable, and a result of extensive research - both primary and secondary. The market research reports provide a complete competitive landscape and an in-depth vendor selection methodology and analysis using qualitative and quantitative research to forecast the accurate market growth.
Table of Contents
1 Executive Summary
- 1.1 Market overview
- Executive Summary - Chart on Market Overview
- Executive Summary - Data Table on Market Overview
- Executive Summary - Chart on Global Market Characteristics
- Executive Summary - Chart on Market by Geography
- Executive Summary - Chart on Market Segmentation by End-user
- Executive Summary - Chart on Market Segmentation by Type
- Executive Summary - Chart on Incremental Growth
- Executive Summary - Data Table on Incremental Growth
- Executive Summary - Chart on Company Market Positioning
2 Market Landscape
- 2.1 Market ecosystem
- Parent Market
- Data Table on - Parent Market
- 2.2 Market characteristics
- Market characteristics analysis
- 2.3 Value chain analysis
- Value Chain Analysis
3 Market Sizing
- 3.1 Market definition
- Offerings of companies included in the market definition
- 3.2 Market segment analysis
- Market segments
- 3.3 Market size 2023
- 3.4 Market outlook: Forecast for 2023-2028
- Chart on Global - Market size and forecast 2023-2028 ($ billion)
- Data Table on Global - Market size and forecast 2023-2028 ($ billion)
- Chart on Global Market: Year-over-year growth 2023-2028 (%)
- Data Table on Global Market: Year-over-year growth 2023-2028 (%)
4 Historic Market Size
- 4.1 Global Biopolymers And Bioplastic Market 2018 - 2022
- Historic Market Size - Data Table on Global Biopolymers And Bioplastic Market 2018 - 2022 ($ billion)
- 4.2 End-user segment analysis 2018 - 2022
- Historic Market Size - End-user Segment 2018 - 2022 ($ billion)
- 4.3 Type segment analysis 2018 - 2022
- Historic Market Size - Type Segment 2018 - 2022 ($ billion)
- 4.4 Geography segment analysis 2018 - 2022
- Historic Market Size - Geography Segment 2018 - 2022 ($ billion)
- 4.5 Country segment analysis 2018 - 2022
- Historic Market Size - Country Segment 2018 - 2022 ($ billion)
5 Five Forces Analysis
- 5.1 Five forces summary
- Five forces analysis - Comparison between 2023 and 2028
- 5.2 Bargaining power of buyers
- Bargaining power of buyers - Impact of key factors 2023 and 2028
- 5.3 Bargaining power of suppliers
- Bargaining power of suppliers - Impact of key factors in 2023 and 2028
- 5.4 Threat of new entrants
- Threat of new entrants - Impact of key factors in 2023 and 2028
- 5.5 Threat of substitutes
- Threat of substitutes - Impact of key factors in 2023 and 2028
- 5.6 Threat of rivalry
- Threat of rivalry - Impact of key factors in 2023 and 2028
- 5.7 Market condition
- Chart on Market condition - Five forces 2023 and 2028
6 Market Segmentation by End-user
- 6.1 Market segments
- Chart on End-user - Market share 2023-2028 (%)
- Data Table on End-user - Market share 2023-2028 (%)
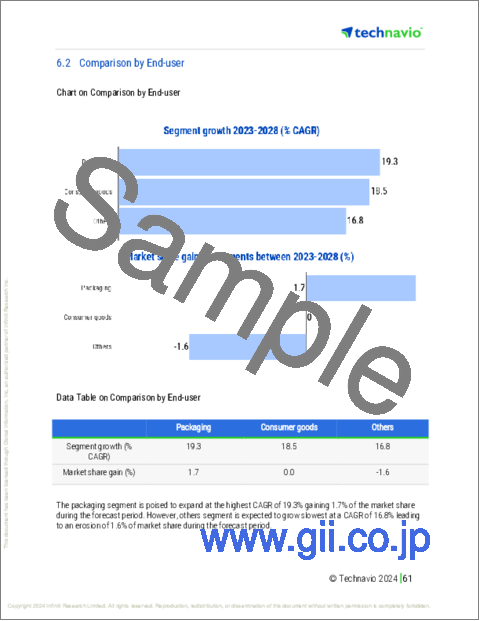
- 6.2 Comparison by End-user
- Chart on Comparison by End-user
- Data Table on Comparison by End-user
- 6.3 Packaging - Market size and forecast 2023-2028
- Chart on Packaging - Market size and forecast 2023-2028 ($ billion)
- Data Table on Packaging - Market size and forecast 2023-2028 ($ billion)
- Chart on Packaging - Year-over-year growth 2023-2028 (%)
- Data Table on Packaging - Year-over-year growth 2023-2028 (%)
- 6.4 Consumer goods - Market size and forecast 2023-2028
- Chart on Consumer goods - Market size and forecast 2023-2028 ($ billion)
- Data Table on Consumer goods - Market size and forecast 2023-2028 ($ billion)
- Chart on Consumer goods - Year-over-year growth 2023-2028 (%)
- Data Table on Consumer goods - Year-over-year growth 2023-2028 (%)
- 6.5 Others - Market size and forecast 2023-2028
- Chart on Others - Market size and forecast 2023-2028 ($ billion)
- Data Table on Others - Market size and forecast 2023-2028 ($ billion)
- Chart on Others - Year-over-year growth 2023-2028 (%)
- Data Table on Others - Year-over-year growth 2023-2028 (%)
- 6.6 Market opportunity by End-user
- Market opportunity by End-user ($ billion)
- Data Table on Market opportunity by End-user ($ billion)
7 Market Segmentation by Type
- 7.1 Market segments
- Chart on Type - Market share 2023-2028 (%)
- Data Table on Type - Market share 2023-2028 (%)
- 7.2 Comparison by Type
- Chart on Comparison by Type
- Data Table on Comparison by Type
- 7.3 Bio-PE - Market size and forecast 2023-2028
- Chart on Bio-PE - Market size and forecast 2023-2028 ($ billion)
- Data Table on Bio-PE - Market size and forecast 2023-2028 ($ billion)
- Chart on Bio-PE - Year-over-year growth 2023-2028 (%)
- Data Table on Bio-PE - Year-over-year growth 2023-2028 (%)
- 7.4 Bio-PET - Market size and forecast 2023-2028
- Chart on Bio-PET - Market size and forecast 2023-2028 ($ billion)
- Data Table on Bio-PET - Market size and forecast 2023-2028 ($ billion)
- Chart on Bio-PET - Year-over-year growth 2023-2028 (%)
- Data Table on Bio-PET - Year-over-year growth 2023-2028 (%)
- 7.5 PLA - Market size and forecast 2023-2028
- Chart on PLA - Market size and forecast 2023-2028 ($ billion)
- Data Table on PLA - Market size and forecast 2023-2028 ($ billion)
- Chart on PLA - Year-over-year growth 2023-2028 (%)
- Data Table on PLA - Year-over-year growth 2023-2028 (%)
- 7.6 Biodegradable starch blends - Market size and forecast 2023-2028
- Chart on Biodegradable starch blends - Market size and forecast 2023-2028 ($ billion)
- Data Table on Biodegradable starch blends - Market size and forecast 2023-2028 ($ billion)
- Chart on Biodegradable starch blends - Year-over-year growth 2023-2028 (%)
- Data Table on Biodegradable starch blends - Year-over-year growth 2023-2028 (%)
- 7.7 Others - Market size and forecast 2023-2028
- Chart on Others - Market size and forecast 2023-2028 ($ billion)
- Data Table on Others - Market size and forecast 2023-2028 ($ billion)
- Chart on Others - Year-over-year growth 2023-2028 (%)
- Data Table on Others - Year-over-year growth 2023-2028 (%)
- 7.8 Market opportunity by Type
- Market opportunity by Type ($ billion)
- Data Table on Market opportunity by Type ($ billion)
8 Customer Landscape
- 8.1 Customer landscape overview
- Analysis of price sensitivity, lifecycle, customer purchase basket, adoption rates, and purchase criteria
9 Geographic Landscape
- 9.1 Geographic segmentation
- Chart on Market share by geography 2023-2028 (%)
- Data Table on Market share by geography 2023-2028 (%)
- 9.2 Geographic comparison
- Chart on Geographic comparison
- Data Table on Geographic comparison
- 9.3 Europe - Market size and forecast 2023-2028
- Chart on Europe - Market size and forecast 2023-2028 ($ billion)
- Data Table on Europe - Market size and forecast 2023-2028 ($ billion)
- Chart on Europe - Year-over-year growth 2023-2028 (%)
- Data Table on Europe - Year-over-year growth 2023-2028 (%)
- 9.4 APAC - Market size and forecast 2023-2028
- Chart on APAC - Market size and forecast 2023-2028 ($ billion)
- Data Table on APAC - Market size and forecast 2023-2028 ($ billion)
- Chart on APAC - Year-over-year growth 2023-2028 (%)
- Data Table on APAC - Year-over-year growth 2023-2028 (%)
- 9.5 North America - Market size and forecast 2023-2028
- Chart on North America - Market size and forecast 2023-2028 ($ billion)
- Data Table on North America - Market size and forecast 2023-2028 ($ billion)
- Chart on North America - Year-over-year growth 2023-2028 (%)
- Data Table on North America - Year-over-year growth 2023-2028 (%)
- 9.6 South America - Market size and forecast 2023-2028
- Chart on South America - Market size and forecast 2023-2028 ($ billion)
- Data Table on South America - Market size and forecast 2023-2028 ($ billion)
- Chart on South America - Year-over-year growth 2023-2028 (%)
- Data Table on South America - Year-over-year growth 2023-2028 (%)
- 9.7 Middle East and Africa - Market size and forecast 2023-2028
- Chart on Middle East and Africa - Market size and forecast 2023-2028 ($ billion)
- Data Table on Middle East and Africa - Market size and forecast 2023-2028 ($ billion)
- Chart on Middle East and Africa - Year-over-year growth 2023-2028 (%)
- Data Table on Middle East and Africa - Year-over-year growth 2023-2028 (%)
- 9.8 Germany - Market size and forecast 2023-2028
- Chart on Germany - Market size and forecast 2023-2028 ($ billion)
- Data Table on Germany - Market size and forecast 2023-2028 ($ billion)
- Chart on Germany - Year-over-year growth 2023-2028 (%)
- Data Table on Germany - Year-over-year growth 2023-2028 (%)
- 9.9 US - Market size and forecast 2023-2028
- Chart on US - Market size and forecast 2023-2028 ($ billion)
- Data Table on US - Market size and forecast 2023-2028 ($ billion)
- Chart on US - Year-over-year growth 2023-2028 (%)
- Data Table on US - Year-over-year growth 2023-2028 (%)
- 9.10 China - Market size and forecast 2023-2028
- Chart on China - Market size and forecast 2023-2028 ($ billion)
- Data Table on China - Market size and forecast 2023-2028 ($ billion)
- Chart on China - Year-over-year growth 2023-2028 (%)
- Data Table on China - Year-over-year growth 2023-2028 (%)
- 9.11 UK - Market size and forecast 2023-2028
- Chart on UK - Market size and forecast 2023-2028 ($ billion)
- Data Table on UK - Market size and forecast 2023-2028 ($ billion)
- Chart on UK - Year-over-year growth 2023-2028 (%)
- Data Table on UK - Year-over-year growth 2023-2028 (%)
- 9.12 Japan - Market size and forecast 2023-2028
- Chart on Japan - Market size and forecast 2023-2028 ($ billion)
- Data Table on Japan - Market size and forecast 2023-2028 ($ billion)
- Chart on Japan - Year-over-year growth 2023-2028 (%)
- Data Table on Japan - Year-over-year growth 2023-2028 (%)
- 9.13 Market opportunity by geography
- Market opportunity by geography ($ billion)
- Data Tables on Market opportunity by geography ($ billion)
10 Drivers, Challenges, and Opportunity/Restraints
- 10.1 Market drivers
- 10.2 Market challenges
- 10.3 Impact of drivers and challenges
- Impact of drivers and challenges in 2023 and 2028
- 10.4 Market opportunities/restraints
11 Competitive Landscape
- 11.1 Overview
- 11.2 Competitive Landscape
- Overview on criticality of inputs and factors of differentiation
- 11.3 Landscape disruption
- Overview on factors of disruption
- 11.4 Industry risks
- Impact of key risks on business
12 Competitive Analysis
- 12.1 Companies profiled
- Companies covered
- 12.2 Market positioning of companies
- Matrix on companies position and classification
- 12.3 AGRANA Beteiligungs AG
- AGRANA Beteiligungs AG - Overview
- AGRANA Beteiligungs AG - Business segments
- AGRANA Beteiligungs AG - Key news
- AGRANA Beteiligungs AG - Key offerings
- AGRANA Beteiligungs AG - Segment focus
- 12.4 AKRO PLASTIC GmbH
- AKRO PLASTIC GmbH - Overview
- AKRO PLASTIC GmbH - Product / Service
- AKRO PLASTIC GmbH - Key offerings
- 12.5 Arkema SA
- Arkema SA - Overview
- Arkema SA - Business segments
- Arkema SA - Key news
- Arkema SA - Key offerings
- Arkema SA - Segment focus
- 12.6 BASF SE
- BASF SE - Overview
- BASF SE - Business segments
- BASF SE - Key news
- BASF SE - Key offerings
- BASF SE - Segment focus
- 12.7 Biome Bioplastics Ltd.
- Biome Bioplastics Ltd. - Overview
- Biome Bioplastics Ltd. - Product / Service
- Biome Bioplastics Ltd. - Key offerings
- 12.8 Biotec GmbH Co. and KG
- Biotec GmbH Co. and KG - Overview
- Biotec GmbH Co. and KG - Product / Service
- Biotec GmbH Co. and KG - Key offerings
- 12.9 Braskem SA
- Braskem SA - Overview
- Braskem SA - Business segments
- Braskem SA - Key news
- Braskem SA - Key offerings
- Braskem SA - Segment focus
- 12.10 Carbiolice
- Carbiolice - Overview
- Carbiolice - Product / Service
- Carbiolice - Key offerings
- 12.11 Cardia Bioplastics
- Cardia Bioplastics - Overview
- Cardia Bioplastics - Product / Service
- Cardia Bioplastics - Key offerings
- 12.12 Cargill Inc.
- Cargill Inc. - Overview
- Cargill Inc. - Product / Service
- Cargill Inc. - Key news
- Cargill Inc. - Key offerings
- 12.13 Fkur Kunststoff GmbH
- Fkur Kunststoff GmbH - Overview
- Fkur Kunststoff GmbH - Product / Service
- Fkur Kunststoff GmbH - Key offerings
- 12.14 Futerro SA
- Futerro SA - Overview
- Futerro SA - Product / Service
- Futerro SA - Key offerings
- 12.15 Green Dot Bioplastics Inc.
- Green Dot Bioplastics Inc. - Overview
- Green Dot Bioplastics Inc. - Product / Service
- Green Dot Bioplastics Inc. - Key offerings
- 12.16 Ingevity Corp.
- Ingevity Corp. - Overview
- Ingevity Corp. - Business segments
- Ingevity Corp. - Key offerings
- Ingevity Corp. - Segment focus
- 12.17 Mitsubishi Chemical Group Corp.
- Mitsubishi Chemical Group Corp. - Overview
- Mitsubishi Chemical Group Corp. - Business segments
- Mitsubishi Chemical Group Corp. - Key news
- Mitsubishi Chemical Group Corp. - Key offerings
- Mitsubishi Chemical Group Corp. - Segment focus
13 Appendix
- 13.1 Scope of the report
- 13.2 Inclusions and exclusions checklist
- Inclusions checklist
- Exclusions checklist
- 13.3 Currency conversion rates for US$
- Currency conversion rates for US$
- 13.4 Research methodology
- Research methodology
- 13.5 Data procurement
- Information sources
- 13.6 Data validation
- Data validation
- 13.7 Validation techniques employed for market sizing
- Validation techniques employed for market sizing
- 13.8 Data synthesis
- Data synthesis
- 360 degree market analysis
- 360 degree market analysis
- 13.10 List of abbreviations
- List of abbreviations

