|
|
市場調査レポート
商品コード
1626435
バイオガスの世界市場(2025年~2029年)Global Biogas Market 2025-2029 |
||||||

|
|||||||
カスタマイズ可能
|
|||||||


| バイオガスの世界市場(2025年~2029年) |
|
出版日: 2024年12月17日
発行: TechNavio
ページ情報: 英文 210 Pages
納期: 即納可能
|

全表示
- 概要
- 図表
- 目次
バイオガス市場(2025年~2029年)
世界のバイオガスの市場規模は、2024年~2029年に197億3,430万米ドル、予測期間中のCAGRは5.8%で成長すると予測されます。当レポートでは、バイオガス市場の全体的な分析、市場規模・予測、動向、成長促進要因、課題、約25のベンダーを網羅したベンダー分析などを掲載しています。
本レポートは、現在の市場シナリオ、最新動向と促進要因、市場環境全体に関する最新分析を提供しています。市場は、都市固形廃棄物の発生量の増加、GHG排出削減に関する厳しい規制、燃料としてのバイオガス開発のための政府支援の増加によって牽引されています。
| 市場範囲 | |
|---|---|
| 基準年 | 2025年 |
| 終了年 | 2029年 |
| 予測期間 | 2025年~2029年 |
| 成長モメンタム | 加速 |
| 前年比2025年 | 5.5% |
| CAGR | 5.8% |
| 増分額 | 197億3,430万米ドル |
本調査では、今後数年間のバイオガス市場成長を促進する主な要因の一つとして、パイプガスとしてのバイオガス使用の増加を挙げています。また、統合廃棄物管理システムと石炭ベースの発電の減少は、市場の大規模な需要につながります。
目次
第1章 エグゼクティブサマリー
- 市場概要
第2章 Technavioの分析
- 価格感度・ライフサイクル・顧客購入バスケット・採用率・購入基準の分析
- インプットの重要性と差別化の要因
- ディスラプションの要因
- 促進要因と課題の影響
第3章 市場情勢
- 市場エコシステム
- 市場の特徴
- バリューチェーン分析
第4章 市場規模
- 市場の定義
- 市場セグメント分析
- 市場規模(2024年)
- 市場の見通し(2024年~2029年)
第5章 市場規模実績
- バイオガスの世界市場(2019年~2023年)
- 用途セグメント分析(2019年~2023年)
- 供給源セグメント分析(2019年~2023年)
- 地域セグメント分析(2019年~2023年)
- 国セグメント分析(2019年~2023年)
第6章 定性分析
- AIの影響:バイオガスの世界市場
第7章 ファイブフォース分析
- ファイブフォースの要約
- 買い手の交渉力
- 供給企業の交渉力
- 新規参入業者の脅威
- 代替品の脅威
- 競争の脅威
- 市況
第8章 市場セグメンテーション:用途別
- 市場セグメント
- 比較:用途別
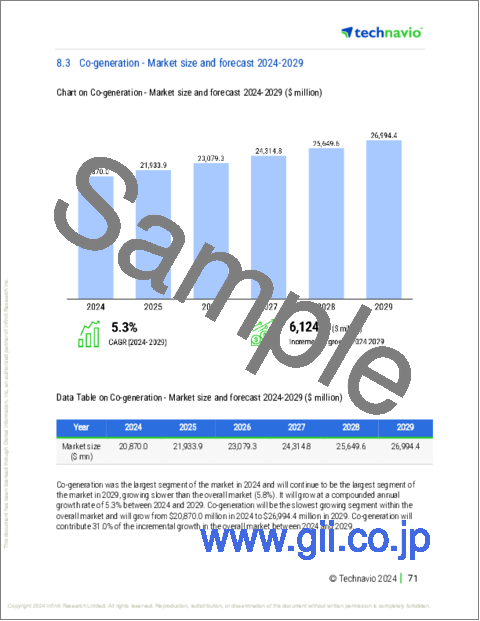
- コージェネレーション:市場規模と予測(2024年~2029年)
- 発電:市場規模と予測(2024年~2029年)
- 建物内の暖房:市場規模と予測(2024年~2029年)
- バイオメタンへのアップグレード:市場規模と予測(2024年~2029年)
- 市場機会:用途別
第9章 市場セグメンテーション:供給源別
- 市場セグメント
- 比較:供給源別
- 農業廃棄物:市場規模と予測(2024年~2029年)
- 埋め立て地:市場規模と予測(2024年~2029年)
- その他:市場規模と予測(2024年~2029年)
- 市場機会:供給源別
第10章 顧客情勢
- 顧客情勢の概要
第11章 地域別情勢
- 地域別セグメンテーション
- 地域別比較
- 北米:市場規模と予測(2024年~2029年)
- アジア太平洋:市場規模と予測(2024年~2029年)
- 欧州:市場規模と予測(2024年~2029年)
- 中東・アフリカ:市場規模と予測(2024年~2029年)
- 南米:市場規模と予測(2024年~2029年)
- 米国:市場規模と予測(2024年~2029年)
- 中国:市場規模と予測(2024年~2029年)
- インド:市場規模と予測(2024年~2029年)
- ドイツ:市場規模と予測(2024年~2029年)
- 英国:市場規模と予測(2024年~2029年)
- カナダ:市場規模と予測(2024年~2029年)
- 日本:市場規模と予測(2024年~2029年)
- オーストラリア:市場規模と予測(2024年~2029年)
- フランス:市場規模と予測(2024年~2029年)
- イタリア:市場規模と予測(2024年~2029年)
- 市場機会:地域情勢別
第12章 促進要因・課題・機会・抑制要因
- 市場促進要因
- 市場の課題
- 促進要因と課題の影響
- 市場の機会・抑制要因
第13章 競合情勢
- 概要
- 競合情勢
- ディスラプションの状況
- 業界のリスク
第14章 競合分析
- 企業プロファイル
- 企業ランキング指数
- 企業の市場ポジショニング
- AB Holding Spa
- AEV Energy GmbH
- Agrinz Technologies GmbH
- Air Liquide
- Ameresco Inc.
- BDI BioEnergy International GmbH
- EnviTec Biogas AG
- Future Biogas Ltd.
- Hitachi Zosen Corp.
- PlanET Biogastechnik GmbH
- Renergon International AG
- Stormfisher Ltd.
- TotalEnergies SE
- Wartsila Corp.
- WELTEC BIOPOWER GmbH
第15章 付録
Exhibits:
- Exhibits1: Executive Summary - Chart on Market Overview
- Exhibits2: Executive Summary - Data Table on Market Overview
- Exhibits3: Executive Summary - Chart on Global Market Characteristics
- Exhibits4: Executive Summary - Chart on Market By Geographical Landscape
- Exhibits5: Executive Summary - Chart on Market Segmentation by Application
- Exhibits6: Executive Summary - Chart on Market Segmentation by Source
- Exhibits7: Executive Summary - Chart on Incremental Growth
- Exhibits8: Executive Summary - Data Table on Incremental Growth
- Exhibits9: Executive Summary - Chart on Company Market Positioning
- Exhibits10: Analysis of price sensitivity, lifecycle, customer purchase basket, adoption rates, and purchase criteria
- Exhibits11: Overview on criticality of inputs and factors of differentiation
- Exhibits12: Overview on factors of disruption
- Exhibits13: Impact of drivers and challenges in 2024 and 2029
- Exhibits14: Parent Market
- Exhibits15: Data Table on - Parent Market
- Exhibits16: Market characteristics analysis
- Exhibits17: Value chain analysis
- Exhibits18: Offerings of companies included in the market definition
- Exhibits19: Market segments
- Exhibits20: Chart on Global - Market size and forecast 2024-2029 ($ million)
- Exhibits21: Data Table on Global - Market size and forecast 2024-2029 ($ million)
- Exhibits22: Chart on Global Market: Year-over-year growth 2024-2029 (%)
- Exhibits23: Data Table on Global Market: Year-over-year growth 2024-2029 (%)
- Exhibits24: Historic Market Size - Data Table on Global Biogas Market 2019 - 2023 ($ million)
- Exhibits25: Historic Market Size - Application Segment 2019 - 2023 ($ million)
- Exhibits26: Historic Market Size - Source Segment 2019 - 2023 ($ million)
- Exhibits27: Historic Market Size - Geography Segment 2019 - 2023 ($ million)
- Exhibits28: Historic Market Size - Country Segment 2019 - 2023 ($ million)
- Exhibits29: Five forces analysis - Comparison between 2024 and 2029
- Exhibits30: Bargaining power of buyers - Impact of key factors 2024 and 2029
- Exhibits31: Bargaining power of suppliers - Impact of key factors in 2024 and 2029
- Exhibits32: Threat of new entrants - Impact of key factors in 2024 and 2029
- Exhibits33: Threat of substitutes - Impact of key factors in 2024 and 2029
- Exhibits34: Threat of rivalry - Impact of key factors in 2024 and 2029
- Exhibits35: Chart on Market condition - Five forces 2024 and 2029
- Exhibits36: Chart on Application - Market share 2024-2029 (%)
- Exhibits37: Data Table on Application - Market share 2024-2029 (%)
- Exhibits38: Chart on Comparison by Application
- Exhibits39: Data Table on Comparison by Application
- Exhibits40: Chart on Co-generation - Market size and forecast 2024-2029 ($ million)
- Exhibits41: Data Table on Co-generation - Market size and forecast 2024-2029 ($ million)
- Exhibits42: Chart on Co-generation - Year-over-year growth 2024-2029 (%)
- Exhibits43: Data Table on Co-generation - Year-over-year growth 2024-2029 (%)
- Exhibits44: Chart on Power generation - Market size and forecast 2024-2029 ($ million)
- Exhibits45: Data Table on Power generation - Market size and forecast 2024-2029 ($ million)
- Exhibits46: Chart on Power generation - Year-over-year growth 2024-2029 (%)
- Exhibits47: Data Table on Power generation - Year-over-year growth 2024-2029 (%)
- Exhibits48: Chart on Heat in buildings - Market size and forecast 2024-2029 ($ million)
- Exhibits49: Data Table on Heat in buildings - Market size and forecast 2024-2029 ($ million)
- Exhibits50: Chart on Heat in buildings - Year-over-year growth 2024-2029 (%)
- Exhibits51: Data Table on Heat in buildings - Year-over-year growth 2024-2029 (%)
- Exhibits52: Chart on Upgraded to biomethane - Market size and forecast 2024-2029 ($ million)
- Exhibits53: Data Table on Upgraded to biomethane - Market size and forecast 2024-2029 ($ million)
- Exhibits54: Chart on Upgraded to biomethane - Year-over-year growth 2024-2029 (%)
- Exhibits55: Data Table on Upgraded to biomethane - Year-over-year growth 2024-2029 (%)
- Exhibits56: Market opportunity by Application ($ million)
- Exhibits57: Data Table on Market opportunity by Application ($ million)
- Exhibits58: Chart on Source - Market share 2024-2029 (%)
- Exhibits59: Data Table on Source - Market share 2024-2029 (%)
- Exhibits60: Chart on Comparison by Source
- Exhibits61: Data Table on Comparison by Source
- Exhibits62: Chart on Agricultural waste - Market size and forecast 2024-2029 ($ million)
- Exhibits63: Data Table on Agricultural waste - Market size and forecast 2024-2029 ($ million)
- Exhibits64: Chart on Agricultural waste - Year-over-year growth 2024-2029 (%)
- Exhibits65: Data Table on Agricultural waste - Year-over-year growth 2024-2029 (%)
- Exhibits66: Chart on Landfill - Market size and forecast 2024-2029 ($ million)
- Exhibits67: Data Table on Landfill - Market size and forecast 2024-2029 ($ million)
- Exhibits68: Chart on Landfill - Year-over-year growth 2024-2029 (%)
- Exhibits69: Data Table on Landfill - Year-over-year growth 2024-2029 (%)
- Exhibits70: Chart on Others - Market size and forecast 2024-2029 ($ million)
- Exhibits71: Data Table on Others - Market size and forecast 2024-2029 ($ million)
- Exhibits72: Chart on Others - Year-over-year growth 2024-2029 (%)
- Exhibits73: Data Table on Others - Year-over-year growth 2024-2029 (%)
- Exhibits74: Market opportunity by Source ($ million)
- Exhibits75: Data Table on Market opportunity by Source ($ million)
- Exhibits76: Analysis of price sensitivity, lifecycle, customer purchase basket, adoption rates, and purchase criteria
- Exhibits77: Chart on Market share By Geographical Landscape 2024-2029 (%)
- Exhibits78: Data Table on Market share By Geographical Landscape 2024-2029 (%)
- Exhibits79: Chart on Geographic comparison
- Exhibits80: Data Table on Geographic comparison
- Exhibits81: Chart on North America - Market size and forecast 2024-2029 ($ million)
- Exhibits82: Data Table on North America - Market size and forecast 2024-2029 ($ million)
- Exhibits83: Chart on North America - Year-over-year growth 2024-2029 (%)
- Exhibits84: Data Table on North America - Year-over-year growth 2024-2029 (%)
- Exhibits85: Chart on APAC - Market size and forecast 2024-2029 ($ million)
- Exhibits86: Data Table on APAC - Market size and forecast 2024-2029 ($ million)
- Exhibits87: Chart on APAC - Year-over-year growth 2024-2029 (%)
- Exhibits88: Data Table on APAC - Year-over-year growth 2024-2029 (%)
- Exhibits89: Chart on Europe - Market size and forecast 2024-2029 ($ million)
- Exhibits90: Data Table on Europe - Market size and forecast 2024-2029 ($ million)
- Exhibits91: Chart on Europe - Year-over-year growth 2024-2029 (%)
- Exhibits92: Data Table on Europe - Year-over-year growth 2024-2029 (%)
- Exhibits93: Chart on Middle East and Africa - Market size and forecast 2024-2029 ($ million)
- Exhibits94: Data Table on Middle East and Africa - Market size and forecast 2024-2029 ($ million)
- Exhibits95: Chart on Middle East and Africa - Year-over-year growth 2024-2029 (%)
- Exhibits96: Data Table on Middle East and Africa - Year-over-year growth 2024-2029 (%)
- Exhibits97: Chart on South America - Market size and forecast 2024-2029 ($ million)
- Exhibits98: Data Table on South America - Market size and forecast 2024-2029 ($ million)
- Exhibits99: Chart on South America - Year-over-year growth 2024-2029 (%)
- Exhibits100: Data Table on South America - Year-over-year growth 2024-2029 (%)
- Exhibits101: Chart on US - Market size and forecast 2024-2029 ($ million)
- Exhibits102: Data Table on US - Market size and forecast 2024-2029 ($ million)
- Exhibits103: Chart on US - Year-over-year growth 2024-2029 (%)
- Exhibits104: Data Table on US - Year-over-year growth 2024-2029 (%)
- Exhibits105: Chart on China - Market size and forecast 2024-2029 ($ million)
- Exhibits106: Data Table on China - Market size and forecast 2024-2029 ($ million)
- Exhibits107: Chart on China - Year-over-year growth 2024-2029 (%)
- Exhibits108: Data Table on China - Year-over-year growth 2024-2029 (%)
- Exhibits109: Chart on India - Market size and forecast 2024-2029 ($ million)
- Exhibits110: Data Table on India - Market size and forecast 2024-2029 ($ million)
- Exhibits111: Chart on India - Year-over-year growth 2024-2029 (%)
- Exhibits112: Data Table on India - Year-over-year growth 2024-2029 (%)
- Exhibits113: Chart on Germany - Market size and forecast 2024-2029 ($ million)
- Exhibits114: Data Table on Germany - Market size and forecast 2024-2029 ($ million)
- Exhibits115: Chart on Germany - Year-over-year growth 2024-2029 (%)
- Exhibits116: Data Table on Germany - Year-over-year growth 2024-2029 (%)
- Exhibits117: Chart on UK - Market size and forecast 2024-2029 ($ million)
- Exhibits118: Data Table on UK - Market size and forecast 2024-2029 ($ million)
- Exhibits119: Chart on UK - Year-over-year growth 2024-2029 (%)
- Exhibits120: Data Table on UK - Year-over-year growth 2024-2029 (%)
- Exhibits121: Chart on Canada - Market size and forecast 2024-2029 ($ million)
- Exhibits122: Data Table on Canada - Market size and forecast 2024-2029 ($ million)
- Exhibits123: Chart on Canada - Year-over-year growth 2024-2029 (%)
- Exhibits124: Data Table on Canada - Year-over-year growth 2024-2029 (%)
- Exhibits125: Chart on Japan - Market size and forecast 2024-2029 ($ million)
- Exhibits126: Data Table on Japan - Market size and forecast 2024-2029 ($ million)
- Exhibits127: Chart on Japan - Year-over-year growth 2024-2029 (%)
- Exhibits128: Data Table on Japan - Year-over-year growth 2024-2029 (%)
- Exhibits129: Chart on Australia - Market size and forecast 2024-2029 ($ million)
- Exhibits130: Data Table on Australia - Market size and forecast 2024-2029 ($ million)
- Exhibits131: Chart on Australia - Year-over-year growth 2024-2029 (%)
- Exhibits132: Data Table on Australia - Year-over-year growth 2024-2029 (%)
- Exhibits133: Chart on France - Market size and forecast 2024-2029 ($ million)
- Exhibits134: Data Table on France - Market size and forecast 2024-2029 ($ million)
- Exhibits135: Chart on France - Year-over-year growth 2024-2029 (%)
- Exhibits136: Data Table on France - Year-over-year growth 2024-2029 (%)
- Exhibits137: Chart on Italy - Market size and forecast 2024-2029 ($ million)
- Exhibits138: Data Table on Italy - Market size and forecast 2024-2029 ($ million)
- Exhibits139: Chart on Italy - Year-over-year growth 2024-2029 (%)
- Exhibits140: Data Table on Italy - Year-over-year growth 2024-2029 (%)
- Exhibits141: Market opportunity By Geographical Landscape ($ million)
- Exhibits142: Data Tables on Market opportunity By Geographical Landscape ($ million)
- Exhibits143: Impact of drivers and challenges in 2024 and 2029
- Exhibits144: Overview on criticality of inputs and factors of differentiation
- Exhibits145: Overview on factors of disruption
- Exhibits146: Impact of key risks on business
- Exhibits147: Companies covered
- Exhibits148: Company ranking index
- Exhibits149: Matrix on companies position and classification
- Exhibits150: AB Holding Spa - Overview
- Exhibits151: AB Holding Spa - Product / Service
- Exhibits152: AB Holding Spa - Key offerings
- Exhibits153: SWOT
- Exhibits154: AEV Energy GmbH - Overview
- Exhibits155: AEV Energy GmbH - Product / Service
- Exhibits156: AEV Energy GmbH - Key offerings
- Exhibits157: SWOT
- Exhibits158: Agrinz Technologies GmbH - Overview
- Exhibits159: Agrinz Technologies GmbH - Product / Service
- Exhibits160: Agrinz Technologies GmbH - Key offerings
- Exhibits161: SWOT
- Exhibits162: Air Liquide - Overview
- Exhibits163: Air Liquide - Product / Service
- Exhibits164: Air Liquide - Key news
- Exhibits165: Air Liquide - Key offerings
- Exhibits166: SWOT
- Exhibits167: Ameresco Inc. - Overview
- Exhibits168: Ameresco Inc. - Business segments
- Exhibits169: Ameresco Inc. - Key news
- Exhibits170: Ameresco Inc. - Key offerings
- Exhibits171: Ameresco Inc. - Segment focus
- Exhibits172: SWOT
- Exhibits173: BDI BioEnergy International GmbH - Overview
- Exhibits174: BDI BioEnergy International GmbH - Product / Service
- Exhibits175: BDI BioEnergy International GmbH - Key offerings
- Exhibits176: SWOT
- Exhibits177: EnviTec Biogas AG - Overview
- Exhibits178: EnviTec Biogas AG - Product / Service
- Exhibits179: EnviTec Biogas AG - Key offerings
- Exhibits180: SWOT
- Exhibits181: Future Biogas Ltd. - Overview
- Exhibits182: Future Biogas Ltd. - Product / Service
- Exhibits183: Future Biogas Ltd. - Key offerings
- Exhibits184: SWOT
- Exhibits185: Hitachi Zosen Corp. - Overview
- Exhibits186: Hitachi Zosen Corp. - Business segments
- Exhibits187: Hitachi Zosen Corp. - Key news
- Exhibits188: Hitachi Zosen Corp. - Key offerings
- Exhibits189: Hitachi Zosen Corp. - Segment focus
- Exhibits190: SWOT
- Exhibits191: PlanET Biogastechnik GmbH - Overview
- Exhibits192: PlanET Biogastechnik GmbH - Product / Service
- Exhibits193: PlanET Biogastechnik GmbH - Key offerings
- Exhibits194: SWOT
- Exhibits195: Renergon International AG - Overview
- Exhibits196: Renergon International AG - Product / Service
- Exhibits197: Renergon International AG - Key offerings
- Exhibits198: SWOT
- Exhibits199: Stormfisher Ltd. - Overview
- Exhibits200: Stormfisher Ltd. - Product / Service
- Exhibits201: Stormfisher Ltd. - Key offerings
- Exhibits202: SWOT
- Exhibits203: TotalEnergies SE - Overview
- Exhibits204: TotalEnergies SE - Business segments
- Exhibits205: TotalEnergies SE - Key news
- Exhibits206: TotalEnergies SE - Key offerings
- Exhibits207: TotalEnergies SE - Segment focus
- Exhibits208: SWOT
- Exhibits209: Wartsila Corp. - Overview
- Exhibits210: Wartsila Corp. - Business segments
- Exhibits211: Wartsila Corp. - Key news
- Exhibits212: Wartsila Corp. - Key offerings
- Exhibits213: Wartsila Corp. - Segment focus
- Exhibits214: SWOT
- Exhibits215: WELTEC BIOPOWER GmbH - Overview
- Exhibits216: WELTEC BIOPOWER GmbH - Product / Service
- Exhibits217: WELTEC BIOPOWER GmbH - Key offerings
- Exhibits218: SWOT
- Exhibits219: Inclusions checklist
- Exhibits220: Exclusions checklist
- Exhibits221: Currency conversion rates for US$
- Exhibits222: Research methodology
- Exhibits223: Information sources
- Exhibits224: Data validation
- Exhibits225: Validation techniques employed for market sizing
- Exhibits226: Data synthesis
- Exhibits227: 360 degree market analysis
- Exhibits228: List of abbreviations
Biogas Market 2025-2029
The biogas market is forecasted to grow by USD 19734.3 mn during 2024-2029, accelerating at a CAGR of 5.8% during the forecast period. The report on the biogas market provides a holistic analysis, market size and forecast, trends, growth drivers, and challenges, as well as vendor analysis covering around 25 vendors.
The report offers an up-to-date analysis regarding the current market scenario, the latest trends and drivers, and the overall market environment. The market is driven by increased generation of municipal solid waste, stringent regulations pertaining to reduction of ghg emissions, and increasing government support to develop biogas as fuel.
| Market Scope | |
|---|---|
| Base Year | 2025 |
| End Year | 2029 |
| Series Year | 2025-2029 |
| Growth Momentum | Accelerate |
| YOY 2025 | 5.5% |
| CAGR | 5.8% |
| Incremental Value | $19734.3 mn |
Technavio's biogas market is segmented as below:
By Application
- Co-generation
- Power generation
- Heat in buildings
- Upgraded to biomethane
By Source
- Agricultural waste
- Landfill
- Others
By Geographical Landscape
- North America
- APAC
- Europe
- Middle East and Africa
- South America
This study identifies the increased use of biogas as piped gas as one of the prime reasons driving the biogas market growth during the next few years. Also, integrated waste management system and decline in coal-based power generation will lead to sizable demand in the market.
The report on the biogas market covers the following areas:
- Biogas Market sizing
- Biogas Market forecast
- Biogas Market industry analysis
The robust vendor analysis is designed to help clients improve their market position, and in line with this, this report provides a detailed analysis of several leading biogas market vendors that include AB Holding Spa, AEV Energy GmbH, Agrinz Technologies GmbH, Air Liquide, Ameresco Inc., BDI BioEnergy International GmbH, Biofrigas Sweden AB, ENGIE SA, EnviTec Biogas AG, Future Biogas Ltd., Hitachi Zosen Corp., MT Energy Service GmbH, PlanET Biogastechnik GmbH, Pressure Technologies Plc, Renergon International AG, Stormfisher Ltd., TotalEnergies SE, Wartsila Corp., WELTEC BIOPOWER GmbH, and Xebec Adsorption Inc.. Also, the biogas market analysis report includes information on upcoming trends and challenges that will influence market growth. This is to help companies strategize and leverage all forthcoming growth opportunities.
The study was conducted using an objective combination of primary and secondary information including inputs from key participants in the industry. The report contains a comprehensive market and vendor landscape in addition to an analysis of the key vendors.
The publisher presents a detailed picture of the market by the way of study, synthesis, and summation of data from multiple sources by an analysis of key parameters such as profit, pricing, competition, and promotions. It presents various market facets by identifying the key industry influencers. The data presented is comprehensive, reliable, and a result of extensive primary and secondary research. The market research reports provide a complete competitive landscape and an in-depth vendor selection methodology and analysis using qualitative and quantitative research to forecast accurate market growth.
Table of Contents
1 Executive Summary
- 1.1 Market overview
- Executive Summary - Chart on Market Overview
- Executive Summary - Data Table on Market Overview
- Executive Summary - Chart on Global Market Characteristics
- Executive Summary - Chart on Market By Geographical Landscape
- Executive Summary - Chart on Market Segmentation by Application
- Executive Summary - Chart on Market Segmentation by Source
- Executive Summary - Chart on Incremental Growth
- Executive Summary - Data Table on Incremental Growth
- Executive Summary - Chart on Company Market Positioning
2 Technavio Analysis
- 2.1 Analysis of price sensitivity, lifecycle, customer purchase basket, adoption rates, and purchase criteria
- Analysis of price sensitivity, lifecycle, customer purchase basket, adoption rates, and purchase criteria
- 2.2 Criticality of inputs and Factors of differentiation
- Overview on criticality of inputs and factors of differentiation
- 2.3 Factors of disruption
- Overview on factors of disruption
- 2.4 Impact of drivers and challenges
- Impact of drivers and challenges in 2024 and 2029
3 Market Landscape
- 3.1 Market ecosystem
- Parent Market
- Data Table on - Parent Market
- 3.2 Market characteristics
- Market characteristics analysis
- 3.3 Value chain analysis
- Value chain analysis
4 Market Sizing
- 4.1 Market definition
- Offerings of companies included in the market definition
- 4.2 Market segment analysis
- Market segments
- 4.3 Market size 2024
- 4.4 Market outlook: Forecast for 2024-2029
- Chart on Global - Market size and forecast 2024-2029 ($ million)
- Data Table on Global - Market size and forecast 2024-2029 ($ million)
- Chart on Global Market: Year-over-year growth 2024-2029 (%)
- Data Table on Global Market: Year-over-year growth 2024-2029 (%)
5 Historic Market Size
- 5.1 Global Biogas Market 2019 - 2023
- Historic Market Size - Data Table on Global Biogas Market 2019 - 2023 ($ million)
- 5.2 Application segment analysis 2019 - 2023
- Historic Market Size - Application Segment 2019 - 2023 ($ million)
- 5.3 Source segment analysis 2019 - 2023
- Historic Market Size - Source Segment 2019 - 2023 ($ million)
- 5.4 Geography segment analysis 2019 - 2023
- Historic Market Size - Geography Segment 2019 - 2023 ($ million)
- 5.5 Country segment analysis 2019 - 2023
- Historic Market Size - Country Segment 2019 - 2023 ($ million)
6 Qualitative Analysis
- 6.1 Impact of AI on global biogas market
7 Five Forces Analysis
- 7.1 Five forces summary
- Five forces analysis - Comparison between 2024 and 2029
- 7.2 Bargaining power of buyers
- Bargaining power of buyers - Impact of key factors 2024 and 2029
- 7.3 Bargaining power of suppliers
- Bargaining power of suppliers - Impact of key factors in 2024 and 2029
- 7.4 Threat of new entrants
- Threat of new entrants - Impact of key factors in 2024 and 2029
- 7.5 Threat of substitutes
- Threat of substitutes - Impact of key factors in 2024 and 2029
- 7.6 Threat of rivalry
- Threat of rivalry - Impact of key factors in 2024 and 2029
- 7.7 Market condition
- Chart on Market condition - Five forces 2024 and 2029
8 Market Segmentation by Application
- 8.1 Market segments
- Chart on Application - Market share 2024-2029 (%)
- Data Table on Application - Market share 2024-2029 (%)
- 8.2 Comparison by Application
- Chart on Comparison by Application
- Data Table on Comparison by Application
- 8.3 Co-generation - Market size and forecast 2024-2029
- Chart on Co-generation - Market size and forecast 2024-2029 ($ million)
- Data Table on Co-generation - Market size and forecast 2024-2029 ($ million)
- Chart on Co-generation - Year-over-year growth 2024-2029 (%)
- Data Table on Co-generation - Year-over-year growth 2024-2029 (%)
- 8.4 Power generation - Market size and forecast 2024-2029
- Chart on Power generation - Market size and forecast 2024-2029 ($ million)
- Data Table on Power generation - Market size and forecast 2024-2029 ($ million)
- Chart on Power generation - Year-over-year growth 2024-2029 (%)
- Data Table on Power generation - Year-over-year growth 2024-2029 (%)
- 8.5 Heat in buildings - Market size and forecast 2024-2029
- Chart on Heat in buildings - Market size and forecast 2024-2029 ($ million)
- Data Table on Heat in buildings - Market size and forecast 2024-2029 ($ million)
- Chart on Heat in buildings - Year-over-year growth 2024-2029 (%)
- Data Table on Heat in buildings - Year-over-year growth 2024-2029 (%)
- 8.6 Upgraded to biomethane - Market size and forecast 2024-2029
- Chart on Upgraded to biomethane - Market size and forecast 2024-2029 ($ million)
- Data Table on Upgraded to biomethane - Market size and forecast 2024-2029 ($ million)
- Chart on Upgraded to biomethane - Year-over-year growth 2024-2029 (%)
- Data Table on Upgraded to biomethane - Year-over-year growth 2024-2029 (%)
- 8.7 Market opportunity by Application
- Market opportunity by Application ($ million)
- Data Table on Market opportunity by Application ($ million)
9 Market Segmentation by Source
- 9.1 Market segments
- Chart on Source - Market share 2024-2029 (%)
- Data Table on Source - Market share 2024-2029 (%)
- 9.2 Comparison by Source
- Chart on Comparison by Source
- Data Table on Comparison by Source
- 9.3 Agricultural waste - Market size and forecast 2024-2029
- Chart on Agricultural waste - Market size and forecast 2024-2029 ($ million)
- Data Table on Agricultural waste - Market size and forecast 2024-2029 ($ million)
- Chart on Agricultural waste - Year-over-year growth 2024-2029 (%)
- Data Table on Agricultural waste - Year-over-year growth 2024-2029 (%)
- 9.4 Landfill - Market size and forecast 2024-2029
- Chart on Landfill - Market size and forecast 2024-2029 ($ million)
- Data Table on Landfill - Market size and forecast 2024-2029 ($ million)
- Chart on Landfill - Year-over-year growth 2024-2029 (%)
- Data Table on Landfill - Year-over-year growth 2024-2029 (%)
- 9.5 Others - Market size and forecast 2024-2029
- Chart on Others - Market size and forecast 2024-2029 ($ million)
- Data Table on Others - Market size and forecast 2024-2029 ($ million)
- Chart on Others - Year-over-year growth 2024-2029 (%)
- Data Table on Others - Year-over-year growth 2024-2029 (%)
- 9.6 Market opportunity by Source
- Market opportunity by Source ($ million)
- Data Table on Market opportunity by Source ($ million)
10 Customer Landscape
- 10.1 Customer landscape overview
- Analysis of price sensitivity, lifecycle, customer purchase basket, adoption rates, and purchase criteria
11 Geographic Landscape
- 11.1 Geographic segmentation
- Chart on Market share By Geographical Landscape 2024-2029 (%)
- Data Table on Market share By Geographical Landscape 2024-2029 (%)
- 11.2 Geographic comparison
- Chart on Geographic comparison
- Data Table on Geographic comparison
- 11.3 North America - Market size and forecast 2024-2029
- Chart on North America - Market size and forecast 2024-2029 ($ million)
- Data Table on North America - Market size and forecast 2024-2029 ($ million)
- Chart on North America - Year-over-year growth 2024-2029 (%)
- Data Table on North America - Year-over-year growth 2024-2029 (%)
- 11.4 APAC - Market size and forecast 2024-2029
- Chart on APAC - Market size and forecast 2024-2029 ($ million)
- Data Table on APAC - Market size and forecast 2024-2029 ($ million)
- Chart on APAC - Year-over-year growth 2024-2029 (%)
- Data Table on APAC - Year-over-year growth 2024-2029 (%)
- 11.5 Europe - Market size and forecast 2024-2029
- Chart on Europe - Market size and forecast 2024-2029 ($ million)
- Data Table on Europe - Market size and forecast 2024-2029 ($ million)
- Chart on Europe - Year-over-year growth 2024-2029 (%)
- Data Table on Europe - Year-over-year growth 2024-2029 (%)
- 11.6 Middle East and Africa - Market size and forecast 2024-2029
- Chart on Middle East and Africa - Market size and forecast 2024-2029 ($ million)
- Data Table on Middle East and Africa - Market size and forecast 2024-2029 ($ million)
- Chart on Middle East and Africa - Year-over-year growth 2024-2029 (%)
- Data Table on Middle East and Africa - Year-over-year growth 2024-2029 (%)
- 11.7 South America - Market size and forecast 2024-2029
- Chart on South America - Market size and forecast 2024-2029 ($ million)
- Data Table on South America - Market size and forecast 2024-2029 ($ million)
- Chart on South America - Year-over-year growth 2024-2029 (%)
- Data Table on South America - Year-over-year growth 2024-2029 (%)
- 11.8 US - Market size and forecast 2024-2029
- Chart on US - Market size and forecast 2024-2029 ($ million)
- Data Table on US - Market size and forecast 2024-2029 ($ million)
- Chart on US - Year-over-year growth 2024-2029 (%)
- Data Table on US - Year-over-year growth 2024-2029 (%)
- 11.9 China - Market size and forecast 2024-2029
- Chart on China - Market size and forecast 2024-2029 ($ million)
- Data Table on China - Market size and forecast 2024-2029 ($ million)
- Chart on China - Year-over-year growth 2024-2029 (%)
- Data Table on China - Year-over-year growth 2024-2029 (%)
- 11.10 India - Market size and forecast 2024-2029
- Chart on India - Market size and forecast 2024-2029 ($ million)
- Data Table on India - Market size and forecast 2024-2029 ($ million)
- Chart on India - Year-over-year growth 2024-2029 (%)
- Data Table on India - Year-over-year growth 2024-2029 (%)
- 11.11 Germany - Market size and forecast 2024-2029
- Chart on Germany - Market size and forecast 2024-2029 ($ million)
- Data Table on Germany - Market size and forecast 2024-2029 ($ million)
- Chart on Germany - Year-over-year growth 2024-2029 (%)
- Data Table on Germany - Year-over-year growth 2024-2029 (%)
- 11.12 UK - Market size and forecast 2024-2029
- Chart on UK - Market size and forecast 2024-2029 ($ million)
- Data Table on UK - Market size and forecast 2024-2029 ($ million)
- Chart on UK - Year-over-year growth 2024-2029 (%)
- Data Table on UK - Year-over-year growth 2024-2029 (%)
- 11.13 Canada - Market size and forecast 2024-2029
- Chart on Canada - Market size and forecast 2024-2029 ($ million)
- Data Table on Canada - Market size and forecast 2024-2029 ($ million)
- Chart on Canada - Year-over-year growth 2024-2029 (%)
- Data Table on Canada - Year-over-year growth 2024-2029 (%)
- 11.14 Japan - Market size and forecast 2024-2029
- Chart on Japan - Market size and forecast 2024-2029 ($ million)
- Data Table on Japan - Market size and forecast 2024-2029 ($ million)
- Chart on Japan - Year-over-year growth 2024-2029 (%)
- Data Table on Japan - Year-over-year growth 2024-2029 (%)
- 11.15 Australia - Market size and forecast 2024-2029
- Chart on Australia - Market size and forecast 2024-2029 ($ million)
- Data Table on Australia - Market size and forecast 2024-2029 ($ million)
- Chart on Australia - Year-over-year growth 2024-2029 (%)
- Data Table on Australia - Year-over-year growth 2024-2029 (%)
- 11.16 France - Market size and forecast 2024-2029
- Chart on France - Market size and forecast 2024-2029 ($ million)
- Data Table on France - Market size and forecast 2024-2029 ($ million)
- Chart on France - Year-over-year growth 2024-2029 (%)
- Data Table on France - Year-over-year growth 2024-2029 (%)
- 11.17 Italy - Market size and forecast 2024-2029
- Chart on Italy - Market size and forecast 2024-2029 ($ million)
- Data Table on Italy - Market size and forecast 2024-2029 ($ million)
- Chart on Italy - Year-over-year growth 2024-2029 (%)
- Data Table on Italy - Year-over-year growth 2024-2029 (%)
- 11.18 Market opportunity By Geographical Landscape
- Market opportunity By Geographical Landscape ($ million)
- Data Tables on Market opportunity By Geographical Landscape ($ million)
12 Drivers, Challenges, and Opportunity/Restraints
- 12.1 Market drivers
- 12.2 Market challenges
- 12.3 Impact of drivers and challenges
- Impact of drivers and challenges in 2024 and 2029
- 12.4 Market opportunities/restraints
13 Competitive Landscape
- 13.1 Overview
- 13.2 Competitive Landscape
- Overview on criticality of inputs and factors of differentiation
- 13.3 Landscape disruption
- Overview on factors of disruption
- 13.4 Industry risks
- Impact of key risks on business
14 Competitive Analysis
- 14.1 Companies profiled
- Companies covered
- 14.2 Company ranking index
- Company ranking index
- 14.3 Market positioning of companies
- Matrix on companies position and classification
- 14.4 AB Holding Spa
- AB Holding Spa - Overview
- AB Holding Spa - Product / Service
- AB Holding Spa - Key offerings
- SWOT
- 14.5 AEV Energy GmbH
- AEV Energy GmbH - Overview
- AEV Energy GmbH - Product / Service
- AEV Energy GmbH - Key offerings
- SWOT
- 14.6 Agrinz Technologies GmbH
- Agrinz Technologies GmbH - Overview
- Agrinz Technologies GmbH - Product / Service
- Agrinz Technologies GmbH - Key offerings
- SWOT
- 14.7 Air Liquide
- Air Liquide - Overview
- Air Liquide - Product / Service
- Air Liquide - Key news
- Air Liquide - Key offerings
- SWOT
- 14.8 Ameresco Inc.
- Ameresco Inc. - Overview
- Ameresco Inc. - Business segments
- Ameresco Inc. - Key news
- Ameresco Inc. - Key offerings
- Ameresco Inc. - Segment focus
- SWOT
- 14.9 BDI BioEnergy International GmbH
- BDI BioEnergy International GmbH - Overview
- BDI BioEnergy International GmbH - Product / Service
- BDI BioEnergy International GmbH - Key offerings
- SWOT
- 14.10 EnviTec Biogas AG
- EnviTec Biogas AG - Overview
- EnviTec Biogas AG - Product / Service
- EnviTec Biogas AG - Key offerings
- SWOT
- 14.11 Future Biogas Ltd.
- Future Biogas Ltd. - Overview
- Future Biogas Ltd. - Product / Service
- Future Biogas Ltd. - Key offerings
- SWOT
- 14.12 Hitachi Zosen Corp.
- Hitachi Zosen Corp. - Overview
- Hitachi Zosen Corp. - Business segments
- Hitachi Zosen Corp. - Key news
- Hitachi Zosen Corp. - Key offerings
- Hitachi Zosen Corp. - Segment focus
- SWOT
- 14.13 PlanET Biogastechnik GmbH
- PlanET Biogastechnik GmbH - Overview
- PlanET Biogastechnik GmbH - Product / Service
- PlanET Biogastechnik GmbH - Key offerings
- SWOT
- 14.14 Renergon International AG
- Renergon International AG - Overview
- Renergon International AG - Product / Service
- Renergon International AG - Key offerings
- SWOT
- 14.15 Stormfisher Ltd.
- Stormfisher Ltd. - Overview
- Stormfisher Ltd. - Product / Service
- Stormfisher Ltd. - Key offerings
- SWOT
- 14.16 TotalEnergies SE
- TotalEnergies SE - Overview
- TotalEnergies SE - Business segments
- TotalEnergies SE - Key news
- TotalEnergies SE - Key offerings
- TotalEnergies SE - Segment focus
- SWOT
- 14.17 Wartsila Corp.
- Wartsila Corp. - Overview
- Wartsila Corp. - Business segments
- Wartsila Corp. - Key news
- Wartsila Corp. - Key offerings
- Wartsila Corp. - Segment focus
- SWOT
- 14.18 WELTEC BIOPOWER GmbH
- WELTEC BIOPOWER GmbH - Overview
- WELTEC BIOPOWER GmbH - Product / Service
- WELTEC BIOPOWER GmbH - Key offerings
- SWOT
15 Appendix
- 15.1 Scope of the report
- 15.2 Inclusions and exclusions checklist
- Inclusions checklist
- Exclusions checklist
- 15.3 Currency conversion rates for US$
- Currency conversion rates for US$
- 15.4 Research methodology
- Research methodology
- 15.5 Data procurement
- Information sources
- 15.6 Data validation
- Data validation
- 15.7 Validation techniques employed for market sizing
- Validation techniques employed for market sizing
- 15.8 Data synthesis
- Data synthesis
- 15.9 360 degree market analysis
- 360 degree market analysis
- 15.10 List of abbreviations
- List of abbreviations

