|
|
市場調査レポート
商品コード
1626436
モノのインターネット(IoT)チップの世界市場(2024年~2028年)Global Internet of Things (iot) Chip Market 2024-2028 |
||||||
|
|||||||
カスタマイズ可能
|
|||||||

| モノのインターネット(IoT)チップの世界市場(2024年~2028年) |
|
出版日: 2024年12月17日
発行: TechNavio
ページ情報: 英文 196 Pages
納期: 即納可能
|

全表示
- 概要
- 図表
- 目次
モノのインターネット(IoT)チップ市場(2024年~2028年)
世界のモノのインターネット(IoT)チップの市場規模は、2023年~2028年に195億1,080万米ドル、予測期間中のCAGRは15.2%で成長すると予測されます。当レポートでは、モノのインターネット(IoT)チップ市場の全体的な分析、市場規模・予測、動向、成長促進要因、課題、約25のベンダーを網羅したベンダー分析などを掲載しています。
本レポートは、現在の市場シナリオ、最新動向と促進要因、市場環境全体に関する最新分析を提供しています。市場は、スマートデバイスやアプリケーションの増加、M2M接続の採用拡大、政府や金融機関によるIoTエコシステム開発への投資などが牽引しています。
| 市場範囲 | |
|---|---|
| 基準年 | 2024年 |
| 終了年 | 2028年 |
| 予測期間 | 2024年~2028年 |
| 成長モメンタム | 加速 |
| 前年比2024年 | 12.9% |
| CAGR | 15.2% |
| 増分額 | 195億1,080万米ドル |
本調査では、今後数年間のモノのインターネット(IoT)チップ市場の成長を促進する主な要因の1つとして、NB-IoT技術の導入を挙げています。また、グローバルデバイスマネージャの進化と5Gの展開が市場の大きな需要につながると予測しています。
目次
第1章 エグゼクティブサマリー
- 市場概要
第2章 市場情勢
- 市場エコシステム
- 市場の特徴
- バリューチェーン分析
第3章 市場規模
- 市場の定義
- 市場セグメント分析
- 市場規模(2023年)
- 市場の見通し(2023年~2028年)
第4章 市場規模実績
- モノのインターネット(IoT)チップの世界市場(2018年~2022年)
- 用途セグメント分析(2018年~2022年)
- タイプセグメント分析(2018年~2022年)
- 地域セグメント分析(2018年~2022年)
- 国セグメント分析(2018年~2022年)
第5章 ファイブフォース分析
- ファイブフォースの要約
- 買い手の交渉力
- 供給企業の交渉力
- 新規参入業者の脅威
- 代替品の脅威
- 競争の脅威
- 市況
第6章 市場セグメンテーション:用途別
- 市場セグメント
- 比較:用途別
- スマートシティ:市場規模と予測(2023年~2028年)
- 産業用イーサネット:市場規模と予測(2023年~2028年)
- スマートウェアラブル:市場規模と予測(2023年~2028年)
- コネクテッドカー:市場規模と予測(2023年~2028年)
- コネクテッドホーム:市場規模と予測(2023年~2028年)
- 市場機会:用途別
第7章 市場セグメンテーション:タイプ別
- 市場セグメント
- 比較:タイプ別
- ロジックデバイス:市場規模と予測(2023年~2028年)
- センサー:市場規模と予測(2023年~2028年)
- プロセッサ:市場規模と予測(2023年~2028年)
- 接続集積回路:市場規模と予測(2023年~2028年)
- メモリデバイス:市場規模と予測(2023年~2028年)
- 市場機会:タイプ別
第8章 顧客情勢
- 顧客情勢の概要
第9章 地域別情勢
- 地域別セグメンテーション
- 地域別比較
- アジア太平洋:市場規模と予測(2023年~2028年)
- 北米:市場規模と予測(2023年~2028年)
- 欧州:市場規模と予測(2023年~2028年)
- 南米:市場規模と予測(2023年~2028年)
- 中東・アフリカ:市場規模と予測(2023年~2028年)
- 中国:市場規模と予測(2023年~2028年)
- 韓国:市場規模と予測(2023年~2028年)
- 日本:市場規模と予測(2023年~2028年)
- 米国:市場規模と予測(2023年~2028年)
- 台湾:市場規模と予測(2023年~2028年)
- 市場機会:地域情勢別
第10章 促進要因・課題・機会・抑制要因
- 市場促進要因
- 市場の課題
- 促進要因と課題の影響
- 市場の機会・抑制要因
第11章 競合情勢
- 概要
- 競合情勢
- ディスラプションの状況
- 業界のリスク
第12章 競合分析
- 企業プロファイル
- 企業の市場ポジショニング
- Advanced Micro Devices Inc.
- Analog Devices Inc.
- Huawei Technologies Co. Ltd.
- Infineon Technologies AG
- Intel Corp.
- Marvell Technology Inc.
- MediaTek Inc.
- Microchip Technology Inc.
- NVIDIA Corp.
- NXP Semiconductors NV
- Qualcomm Inc.
- Renesas Electronics Corp.
- Samsung Electronics Co. Ltd.
- STMicroelectronics International N.V.
- Texas Instruments Inc.
第13章 付録
Exhibits:
- Exhibits1: Executive Summary - Chart on Market Overview
- Exhibits2: Executive Summary - Data Table on Market Overview
- Exhibits3: Executive Summary - Chart on Global Market Characteristics
- Exhibits4: Executive Summary - Chart on Market By Geographical Landscape
- Exhibits5: Executive Summary - Chart on Market Segmentation by Application
- Exhibits6: Executive Summary - Chart on Market Segmentation by Type
- Exhibits7: Executive Summary - Chart on Incremental Growth
- Exhibits8: Executive Summary - Data Table on Incremental Growth
- Exhibits9: Executive Summary - Chart on Company Market Positioning
- Exhibits10: Parent Market
- Exhibits11: Data Table on - Parent Market
- Exhibits12: Market characteristics analysis
- Exhibits13: Value chain analysis
- Exhibits14: Offerings of companies included in the market definition
- Exhibits15: Market segments
- Exhibits16: Chart on Global - Market size and forecast 2023-2028 ($ million)
- Exhibits17: Data Table on Global - Market size and forecast 2023-2028 ($ million)
- Exhibits18: Chart on Global Market: Year-over-year growth 2023-2028 (%)
- Exhibits19: Data Table on Global Market: Year-over-year growth 2023-2028 (%)
- Exhibits20: Historic Market Size - Data Table on Global Internet Of Things (IoT) Chip Market 2018 - 2022 ($ million)
- Exhibits21: Historic Market Size - Application Segment 2018 - 2022 ($ million)
- Exhibits22: Historic Market Size - Type Segment 2018 - 2022 ($ million)
- Exhibits23: Historic Market Size - Geography Segment 2018 - 2022 ($ million)
- Exhibits24: Historic Market Size - Country Segment 2018 - 2022 ($ million)
- Exhibits25: Five forces analysis - Comparison between 2023 and 2028
- Exhibits26: Bargaining power of buyers - Impact of key factors 2023 and 2028
- Exhibits27: Bargaining power of suppliers - Impact of key factors in 2023 and 2028
- Exhibits28: Threat of new entrants - Impact of key factors in 2023 and 2028
- Exhibits29: Threat of substitutes - Impact of key factors in 2023 and 2028
- Exhibits30: Threat of rivalry - Impact of key factors in 2023 and 2028
- Exhibits31: Chart on Market condition - Five forces 2023 and 2028
- Exhibits32: Chart on Application - Market share 2023-2028 (%)
- Exhibits33: Data Table on Application - Market share 2023-2028 (%)
- Exhibits34: Chart on Comparison by Application
- Exhibits35: Data Table on Comparison by Application
- Exhibits36: Chart on Smart cities - Market size and forecast 2023-2028 ($ million)
- Exhibits37: Data Table on Smart cities - Market size and forecast 2023-2028 ($ million)
- Exhibits38: Chart on Smart cities - Year-over-year growth 2023-2028 (%)
- Exhibits39: Data Table on Smart cities - Year-over-year growth 2023-2028 (%)
- Exhibits40: Chart on Industrial ethernet - Market size and forecast 2023-2028 ($ million)
- Exhibits41: Data Table on Industrial ethernet - Market size and forecast 2023-2028 ($ million)
- Exhibits42: Chart on Industrial ethernet - Year-over-year growth 2023-2028 (%)
- Exhibits43: Data Table on Industrial ethernet - Year-over-year growth 2023-2028 (%)
- Exhibits44: Chart on Smart wearables - Market size and forecast 2023-2028 ($ million)
- Exhibits45: Data Table on Smart wearables - Market size and forecast 2023-2028 ($ million)
- Exhibits46: Chart on Smart wearables - Year-over-year growth 2023-2028 (%)
- Exhibits47: Data Table on Smart wearables - Year-over-year growth 2023-2028 (%)
- Exhibits48: Chart on Connected vehicles - Market size and forecast 2023-2028 ($ million)
- Exhibits49: Data Table on Connected vehicles - Market size and forecast 2023-2028 ($ million)
- Exhibits50: Chart on Connected vehicles - Year-over-year growth 2023-2028 (%)
- Exhibits51: Data Table on Connected vehicles - Year-over-year growth 2023-2028 (%)
- Exhibits52: Chart on Connected homes - Market size and forecast 2023-2028 ($ million)
- Exhibits53: Data Table on Connected homes - Market size and forecast 2023-2028 ($ million)
- Exhibits54: Chart on Connected homes - Year-over-year growth 2023-2028 (%)
- Exhibits55: Data Table on Connected homes - Year-over-year growth 2023-2028 (%)
- Exhibits56: Market opportunity by Application ($ million)
- Exhibits57: Data Table on Market opportunity by Application ($ million)
- Exhibits58: Chart on Type - Market share 2023-2028 (%)
- Exhibits59: Data Table on Type - Market share 2023-2028 (%)
- Exhibits60: Chart on Comparison by Type
- Exhibits61: Data Table on Comparison by Type
- Exhibits62: Chart on Logic devices - Market size and forecast 2023-2028 ($ million)
- Exhibits63: Data Table on Logic devices - Market size and forecast 2023-2028 ($ million)
- Exhibits64: Chart on Logic devices - Year-over-year growth 2023-2028 (%)
- Exhibits65: Data Table on Logic devices - Year-over-year growth 2023-2028 (%)
- Exhibits66: Chart on Sensors - Market size and forecast 2023-2028 ($ million)
- Exhibits67: Data Table on Sensors - Market size and forecast 2023-2028 ($ million)
- Exhibits68: Chart on Sensors - Year-over-year growth 2023-2028 (%)
- Exhibits69: Data Table on Sensors - Year-over-year growth 2023-2028 (%)
- Exhibits70: Chart on Processors - Market size and forecast 2023-2028 ($ million)
- Exhibits71: Data Table on Processors - Market size and forecast 2023-2028 ($ million)
- Exhibits72: Chart on Processors - Year-over-year growth 2023-2028 (%)
- Exhibits73: Data Table on Processors - Year-over-year growth 2023-2028 (%)
- Exhibits74: Chart on Connectivity integrated circuits - Market size and forecast 2023-2028 ($ million)
- Exhibits75: Data Table on Connectivity integrated circuits - Market size and forecast 2023-2028 ($ million)
- Exhibits76: Chart on Connectivity integrated circuits - Year-over-year growth 2023-2028 (%)
- Exhibits77: Data Table on Connectivity integrated circuits - Year-over-year growth 2023-2028 (%)
- Exhibits78: Chart on Memory devices - Market size and forecast 2023-2028 ($ million)
- Exhibits79: Data Table on Memory devices - Market size and forecast 2023-2028 ($ million)
- Exhibits80: Chart on Memory devices - Year-over-year growth 2023-2028 (%)
- Exhibits81: Data Table on Memory devices - Year-over-year growth 2023-2028 (%)
- Exhibits82: Market opportunity by Type ($ million)
- Exhibits83: Data Table on Market opportunity by Type ($ million)
- Exhibits84: Analysis of price sensitivity, lifecycle, customer purchase basket, adoption rates, and purchase criteria
- Exhibits85: Chart on Market share By Geographical Landscape 2023-2028 (%)
- Exhibits86: Data Table on Market share By Geographical Landscape 2023-2028 (%)
- Exhibits87: Chart on Geographic comparison
- Exhibits88: Data Table on Geographic comparison
- Exhibits89: Chart on APAC - Market size and forecast 2023-2028 ($ million)
- Exhibits90: Data Table on APAC - Market size and forecast 2023-2028 ($ million)
- Exhibits91: Chart on APAC - Year-over-year growth 2023-2028 (%)
- Exhibits92: Data Table on APAC - Year-over-year growth 2023-2028 (%)
- Exhibits93: Chart on North America - Market size and forecast 2023-2028 ($ million)
- Exhibits94: Data Table on North America - Market size and forecast 2023-2028 ($ million)
- Exhibits95: Chart on North America - Year-over-year growth 2023-2028 (%)
- Exhibits96: Data Table on North America - Year-over-year growth 2023-2028 (%)
- Exhibits97: Chart on Europe - Market size and forecast 2023-2028 ($ million)
- Exhibits98: Data Table on Europe - Market size and forecast 2023-2028 ($ million)
- Exhibits99: Chart on Europe - Year-over-year growth 2023-2028 (%)
- Exhibits100: Data Table on Europe - Year-over-year growth 2023-2028 (%)
- Exhibits101: Chart on South America - Market size and forecast 2023-2028 ($ million)
- Exhibits102: Data Table on South America - Market size and forecast 2023-2028 ($ million)
- Exhibits103: Chart on South America - Year-over-year growth 2023-2028 (%)
- Exhibits104: Data Table on South America - Year-over-year growth 2023-2028 (%)
- Exhibits105: Chart on Middle East and Africa - Market size and forecast 2023-2028 ($ million)
- Exhibits106: Data Table on Middle East and Africa - Market size and forecast 2023-2028 ($ million)
- Exhibits107: Chart on Middle East and Africa - Year-over-year growth 2023-2028 (%)
- Exhibits108: Data Table on Middle East and Africa - Year-over-year growth 2023-2028 (%)
- Exhibits109: Chart on China - Market size and forecast 2023-2028 ($ million)
- Exhibits110: Data Table on China - Market size and forecast 2023-2028 ($ million)
- Exhibits111: Chart on China - Year-over-year growth 2023-2028 (%)
- Exhibits112: Data Table on China - Year-over-year growth 2023-2028 (%)
- Exhibits113: Chart on South Korea - Market size and forecast 2023-2028 ($ million)
- Exhibits114: Data Table on South Korea - Market size and forecast 2023-2028 ($ million)
- Exhibits115: Chart on South Korea - Year-over-year growth 2023-2028 (%)
- Exhibits116: Data Table on South Korea - Year-over-year growth 2023-2028 (%)
- Exhibits117: Chart on Japan - Market size and forecast 2023-2028 ($ million)
- Exhibits118: Data Table on Japan - Market size and forecast 2023-2028 ($ million)
- Exhibits119: Chart on Japan - Year-over-year growth 2023-2028 (%)
- Exhibits120: Data Table on Japan - Year-over-year growth 2023-2028 (%)
- Exhibits121: Chart on US - Market size and forecast 2023-2028 ($ million)
- Exhibits122: Data Table on US - Market size and forecast 2023-2028 ($ million)
- Exhibits123: Chart on US - Year-over-year growth 2023-2028 (%)
- Exhibits124: Data Table on US - Year-over-year growth 2023-2028 (%)
- Exhibits125: Chart on Taiwan - Market size and forecast 2023-2028 ($ million)
- Exhibits126: Data Table on Taiwan - Market size and forecast 2023-2028 ($ million)
- Exhibits127: Chart on Taiwan - Year-over-year growth 2023-2028 (%)
- Exhibits128: Data Table on Taiwan - Year-over-year growth 2023-2028 (%)
- Exhibits129: Market opportunity By Geographical Landscape ($ million)
- Exhibits130: Data Tables on Market opportunity By Geographical Landscape ($ million)
- Exhibits131: Impact of drivers and challenges in 2023 and 2028
- Exhibits132: Overview on criticality of inputs and factors of differentiation
- Exhibits133: Overview on factors of disruption
- Exhibits134: Impact of key risks on business
- Exhibits135: Companies covered
- Exhibits136: Matrix on companies position and classification
- Exhibits137: Advanced Micro Devices Inc. - Overview
- Exhibits138: Advanced Micro Devices Inc. - Business segments
- Exhibits139: Advanced Micro Devices Inc. - Key news
- Exhibits140: Advanced Micro Devices Inc. - Key offerings
- Exhibits141: Advanced Micro Devices Inc. - Segment focus
- Exhibits142: Analog Devices Inc. - Overview
- Exhibits143: Analog Devices Inc. - Business segments
- Exhibits144: Analog Devices Inc. - Key news
- Exhibits145: Analog Devices Inc. - Key offerings
- Exhibits146: Analog Devices Inc. - Segment focus
- Exhibits147: Huawei Technologies Co. Ltd. - Overview
- Exhibits148: Huawei Technologies Co. Ltd. - Product / Service
- Exhibits149: Huawei Technologies Co. Ltd. - Key news
- Exhibits150: Huawei Technologies Co. Ltd. - Key offerings
- Exhibits151: Infineon Technologies AG - Overview
- Exhibits152: Infineon Technologies AG - Business segments
- Exhibits153: Infineon Technologies AG - Key news
- Exhibits154: Infineon Technologies AG - Key offerings
- Exhibits155: Infineon Technologies AG - Segment focus
- Exhibits156: Intel Corp. - Overview
- Exhibits157: Intel Corp. - Business segments
- Exhibits158: Intel Corp. - Key news
- Exhibits159: Intel Corp. - Key offerings
- Exhibits160: Intel Corp. - Segment focus
- Exhibits161: Marvell Technology Inc. - Overview
- Exhibits162: Marvell Technology Inc. - Product / Service
- Exhibits163: Marvell Technology Inc. - Key offerings
- Exhibits164: MediaTek Inc. - Overview
- Exhibits165: MediaTek Inc. - Product / Service
- Exhibits166: MediaTek Inc. - Key news
- Exhibits167: MediaTek Inc. - Key offerings
- Exhibits168: Microchip Technology Inc. - Overview
- Exhibits169: Microchip Technology Inc. - Business segments
- Exhibits170: Microchip Technology Inc. - Key news
- Exhibits171: Microchip Technology Inc. - Key offerings
- Exhibits172: Microchip Technology Inc. - Segment focus
- Exhibits173: NVIDIA Corp. - Overview
- Exhibits174: NVIDIA Corp. - Business segments
- Exhibits175: NVIDIA Corp. - Key news
- Exhibits176: NVIDIA Corp. - Key offerings
- Exhibits177: NVIDIA Corp. - Segment focus
- Exhibits178: NXP Semiconductors NV - Overview
- Exhibits179: NXP Semiconductors NV - Product / Service
- Exhibits180: NXP Semiconductors NV - Key news
- Exhibits181: NXP Semiconductors NV - Key offerings
- Exhibits182: Qualcomm Inc. - Overview
- Exhibits183: Qualcomm Inc. - Business segments
- Exhibits184: Qualcomm Inc. - Key news
- Exhibits185: Qualcomm Inc. - Key offerings
- Exhibits186: Qualcomm Inc. - Segment focus
- Exhibits187: Renesas Electronics Corp. - Overview
- Exhibits188: Renesas Electronics Corp. - Business segments
- Exhibits189: Renesas Electronics Corp. - Key news
- Exhibits190: Renesas Electronics Corp. - Key offerings
- Exhibits191: Renesas Electronics Corp. - Segment focus
- Exhibits192: Samsung Electronics Co. Ltd. - Overview
- Exhibits193: Samsung Electronics Co. Ltd. - Business segments
- Exhibits194: Samsung Electronics Co. Ltd. - Key news
- Exhibits195: Samsung Electronics Co. Ltd. - Key offerings
- Exhibits196: Samsung Electronics Co. Ltd. - Segment focus
- Exhibits197: STMicroelectronics International N.V. - Overview
- Exhibits198: STMicroelectronics International N.V. - Business segments
- Exhibits199: STMicroelectronics International N.V. - Key news
- Exhibits200: STMicroelectronics International N.V. - Key offerings
- Exhibits201: STMicroelectronics International N.V. - Segment focus
- Exhibits202: Texas Instruments Inc. - Overview
- Exhibits203: Texas Instruments Inc. - Business segments
- Exhibits204: Texas Instruments Inc. - Key offerings
- Exhibits205: Texas Instruments Inc. - Segment focus
- Exhibits206: Inclusions checklist
- Exhibits207: Exclusions checklist
- Exhibits208: Currency conversion rates for US$
- Exhibits209: Research methodology
- Exhibits210: Information sources
- Exhibits211: Data validation
- Exhibits212: Validation techniques employed for market sizing
- Exhibits213: Data synthesis
- Exhibits214: 360 degree market analysis
- Exhibits215: List of abbreviations
Internet Of Things (IoT) Chip Market 2024-2028
The internet of things (IoT) chip market is forecasted to grow by USD 19510.8 mn during 2023-2028, accelerating at a CAGR of 15.2% during the forecast period. The report on the internet of things (IoT) chip market provides a holistic analysis, market size and forecast, trends, growth drivers, and challenges, as well as vendor analysis covering around 25 vendors.
The report offers an up-to-date analysis regarding the current market scenario, the latest trends and drivers, and the overall market environment. The market is driven by increasing number of smart devices and applications, increasing adoption of m2m connections, and governments and financial institutions investing in iot ecosystem development.
| Market Scope | |
|---|---|
| Base Year | 2024 |
| End Year | 2028 |
| Series Year | 2024-2028 |
| Growth Momentum | Accelerate |
| YOY 2024 | 12.9% |
| CAGR | 15.2% |
| Incremental Value | $19510.8 mn |
Technavio's internet of things (IoT) chip market is segmented as below:
By Application
- Smart cities
- Industrial ethernet
- Smart wearables
- Connected vehicles
- Connected homes
By Type
- Logic devices
- Sensors
- Processors
- Connectivity integrated circuits
- Memory devices
By Geographical Landscape
- APAC
- North America
- Europe
- South America
- Middle East and Africa
This study identifies the introduction of nb-iot technology as one of the prime reasons driving the internet of things (IoT) chip market growth during the next few years. Also, evolution of global device managers and anticipated rollout of 5g will lead to sizable demand in the market.
The report on the internet of things (IoT) chip market covers the following areas:
- Internet Of Things (IoT) Chip Market sizing
- Internet Of Things (IoT) Chip Market forecast
- Internet Of Things (IoT) Chip Market industry analysis
The robust vendor analysis is designed to help clients improve their market position, and in line with this, this report provides a detailed analysis of several leading internet of things (IoT) chip market vendors that include Advanced Micro Devices Inc., Analog Devices Inc., Arduino Srl, Huawei Technologies Co. Ltd., Infineon Technologies AG, Intel Corp., Marvell Technology Inc., MediaTek Inc., Microchip Technology Inc., NVIDIA Corp., NXP Semiconductors NV, Park Ohio Holdings Corp., Qualcomm Inc., Renesas Electronics Corp., Samsung Electronics Co. Ltd., Silicon Laboratories Inc., SoftBank Group Corp., STMicroelectronics International NV, Texas Instruments Inc., and Twilio Inc.. Also, the internet of things (IoT) chip market analysis report includes information on upcoming trends and challenges that will influence market growth. This is to help companies strategize and leverage all forthcoming growth opportunities.
The study was conducted using an objective combination of primary and secondary information including inputs from key participants in the industry. The report contains a comprehensive market and vendor landscape in addition to an analysis of the key vendors.
The publisher presents a detailed picture of the market by the way of study, synthesis, and summation of data from multiple sources by an analysis of key parameters such as profit, pricing, competition, and promotions. It presents various market facets by identifying the key industry influencers. The data presented is comprehensive, reliable, and a result of extensive primary and secondary research. The market research reports provide a complete competitive landscape and an in-depth vendor selection methodology and analysis using qualitative and quantitative research to forecast accurate market growth.
Table of Contents
1 Executive Summary
- 1.1 Market overview
- Executive Summary - Chart on Market Overview
- Executive Summary - Data Table on Market Overview
- Executive Summary - Chart on Global Market Characteristics
- Executive Summary - Chart on Market By Geographical Landscape
- Executive Summary - Chart on Market Segmentation by Application
- Executive Summary - Chart on Market Segmentation by Type
- Executive Summary - Chart on Incremental Growth
- Executive Summary - Data Table on Incremental Growth
- Executive Summary - Chart on Company Market Positioning
2 Market Landscape
- 2.1 Market ecosystem
- Parent Market
- Data Table on - Parent Market
- 2.2 Market characteristics
- Market characteristics analysis
- 2.3 Value chain analysis
- Value chain analysis
3 Market Sizing
- 3.1 Market definition
- Offerings of companies included in the market definition
- 3.2 Market segment analysis
- Market segments
- 3.3 Market size 2023
- 3.4 Market outlook: Forecast for 2023-2028
- Chart on Global - Market size and forecast 2023-2028 ($ million)
- Data Table on Global - Market size and forecast 2023-2028 ($ million)
- Chart on Global Market: Year-over-year growth 2023-2028 (%)
- Data Table on Global Market: Year-over-year growth 2023-2028 (%)
4 Historic Market Size
- 4.1 Global Internet Of Things (IoT) Chip Market 2018 - 2022
- Historic Market Size - Data Table on Global Internet Of Things (IoT) Chip Market 2018 - 2022 ($ million)
- 4.2 Application segment analysis 2018 - 2022
- Historic Market Size - Application Segment 2018 - 2022 ($ million)
- 4.3 Type segment analysis 2018 - 2022
- Historic Market Size - Type Segment 2018 - 2022 ($ million)
- 4.4 Geography segment analysis 2018 - 2022
- Historic Market Size - Geography Segment 2018 - 2022 ($ million)
- 4.5 Country segment analysis 2018 - 2022
- Historic Market Size - Country Segment 2018 - 2022 ($ million)
5 Five Forces Analysis
- 5.1 Five forces summary
- Five forces analysis - Comparison between 2023 and 2028
- 5.2 Bargaining power of buyers
- Bargaining power of buyers - Impact of key factors 2023 and 2028
- 5.3 Bargaining power of suppliers
- Bargaining power of suppliers - Impact of key factors in 2023 and 2028
- 5.4 Threat of new entrants
- Threat of new entrants - Impact of key factors in 2023 and 2028
- 5.5 Threat of substitutes
- Threat of substitutes - Impact of key factors in 2023 and 2028
- 5.6 Threat of rivalry
- Threat of rivalry - Impact of key factors in 2023 and 2028
- 5.7 Market condition
- Chart on Market condition - Five forces 2023 and 2028
6 Market Segmentation by Application
- 6.1 Market segments
- Chart on Application - Market share 2023-2028 (%)
- Data Table on Application - Market share 2023-2028 (%)
- 6.2 Comparison by Application
- Chart on Comparison by Application
- Data Table on Comparison by Application
- 6.3 Smart cities - Market size and forecast 2023-2028
- Chart on Smart cities - Market size and forecast 2023-2028 ($ million)
- Data Table on Smart cities - Market size and forecast 2023-2028 ($ million)
- Chart on Smart cities - Year-over-year growth 2023-2028 (%)
- Data Table on Smart cities - Year-over-year growth 2023-2028 (%)
- 6.4 Industrial ethernet - Market size and forecast 2023-2028
- Chart on Industrial ethernet - Market size and forecast 2023-2028 ($ million)
- Data Table on Industrial ethernet - Market size and forecast 2023-2028 ($ million)
- Chart on Industrial ethernet - Year-over-year growth 2023-2028 (%)
- Data Table on Industrial ethernet - Year-over-year growth 2023-2028 (%)
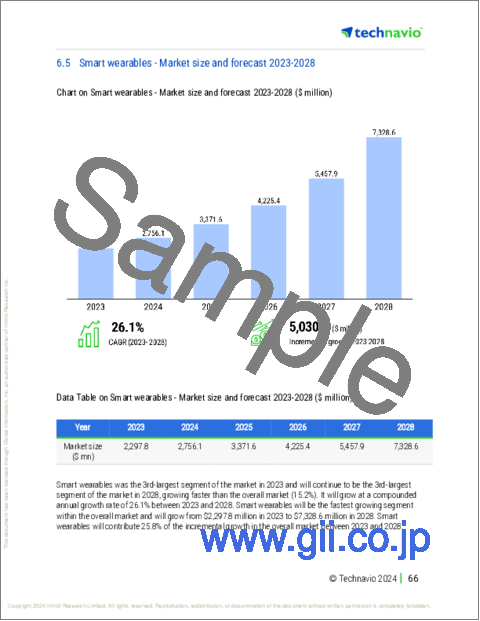
- 6.5 Smart wearables - Market size and forecast 2023-2028
- Chart on Smart wearables - Market size and forecast 2023-2028 ($ million)
- Data Table on Smart wearables - Market size and forecast 2023-2028 ($ million)
- Chart on Smart wearables - Year-over-year growth 2023-2028 (%)
- Data Table on Smart wearables - Year-over-year growth 2023-2028 (%)
- 6.6 Connected vehicles - Market size and forecast 2023-2028
- Chart on Connected vehicles - Market size and forecast 2023-2028 ($ million)
- Data Table on Connected vehicles - Market size and forecast 2023-2028 ($ million)
- Chart on Connected vehicles - Year-over-year growth 2023-2028 (%)
- Data Table on Connected vehicles - Year-over-year growth 2023-2028 (%)
- 6.7 Connected homes - Market size and forecast 2023-2028
- Chart on Connected homes - Market size and forecast 2023-2028 ($ million)
- Data Table on Connected homes - Market size and forecast 2023-2028 ($ million)
- Chart on Connected homes - Year-over-year growth 2023-2028 (%)
- Data Table on Connected homes - Year-over-year growth 2023-2028 (%)
- 6.8 Market opportunity by Application
- Market opportunity by Application ($ million)
- Data Table on Market opportunity by Application ($ million)
7 Market Segmentation by Type
- 7.1 Market segments
- Chart on Type - Market share 2023-2028 (%)
- Data Table on Type - Market share 2023-2028 (%)
- 7.2 Comparison by Type
- Chart on Comparison by Type
- Data Table on Comparison by Type
- 7.3 Logic devices - Market size and forecast 2023-2028
- Chart on Logic devices - Market size and forecast 2023-2028 ($ million)
- Data Table on Logic devices - Market size and forecast 2023-2028 ($ million)
- Chart on Logic devices - Year-over-year growth 2023-2028 (%)
- Data Table on Logic devices - Year-over-year growth 2023-2028 (%)
- 7.4 Sensors - Market size and forecast 2023-2028
- Chart on Sensors - Market size and forecast 2023-2028 ($ million)
- Data Table on Sensors - Market size and forecast 2023-2028 ($ million)
- Chart on Sensors - Year-over-year growth 2023-2028 (%)
- Data Table on Sensors - Year-over-year growth 2023-2028 (%)
- 7.5 Processors - Market size and forecast 2023-2028
- Chart on Processors - Market size and forecast 2023-2028 ($ million)
- Data Table on Processors - Market size and forecast 2023-2028 ($ million)
- Chart on Processors - Year-over-year growth 2023-2028 (%)
- Data Table on Processors - Year-over-year growth 2023-2028 (%)
- 7.6 Connectivity integrated circuits - Market size and forecast 2023-2028
- Chart on Connectivity integrated circuits - Market size and forecast 2023-2028 ($ million)
- Data Table on Connectivity integrated circuits - Market size and forecast 2023-2028 ($ million)
- Chart on Connectivity integrated circuits - Year-over-year growth 2023-2028 (%)
- Data Table on Connectivity integrated circuits - Year-over-year growth 2023-2028 (%)
- 7.7 Memory devices - Market size and forecast 2023-2028
- Chart on Memory devices - Market size and forecast 2023-2028 ($ million)
- Data Table on Memory devices - Market size and forecast 2023-2028 ($ million)
- Chart on Memory devices - Year-over-year growth 2023-2028 (%)
- Data Table on Memory devices - Year-over-year growth 2023-2028 (%)
- 7.8 Market opportunity by Type
- Market opportunity by Type ($ million)
- Data Table on Market opportunity by Type ($ million)
8 Customer Landscape
- 8.1 Customer landscape overview
- Analysis of price sensitivity, lifecycle, customer purchase basket, adoption rates, and purchase criteria
9 Geographic Landscape
- 9.1 Geographic segmentation
- Chart on Market share By Geographical Landscape 2023-2028 (%)
- Data Table on Market share By Geographical Landscape 2023-2028 (%)
- 9.2 Geographic comparison
- Chart on Geographic comparison
- Data Table on Geographic comparison
- 9.3 APAC - Market size and forecast 2023-2028
- Chart on APAC - Market size and forecast 2023-2028 ($ million)
- Data Table on APAC - Market size and forecast 2023-2028 ($ million)
- Chart on APAC - Year-over-year growth 2023-2028 (%)
- Data Table on APAC - Year-over-year growth 2023-2028 (%)
- 9.4 North America - Market size and forecast 2023-2028
- Chart on North America - Market size and forecast 2023-2028 ($ million)
- Data Table on North America - Market size and forecast 2023-2028 ($ million)
- Chart on North America - Year-over-year growth 2023-2028 (%)
- Data Table on North America - Year-over-year growth 2023-2028 (%)
- 9.5 Europe - Market size and forecast 2023-2028
- Chart on Europe - Market size and forecast 2023-2028 ($ million)
- Data Table on Europe - Market size and forecast 2023-2028 ($ million)
- Chart on Europe - Year-over-year growth 2023-2028 (%)
- Data Table on Europe - Year-over-year growth 2023-2028 (%)
- 9.6 South America - Market size and forecast 2023-2028
- Chart on South America - Market size and forecast 2023-2028 ($ million)
- Data Table on South America - Market size and forecast 2023-2028 ($ million)
- Chart on South America - Year-over-year growth 2023-2028 (%)
- Data Table on South America - Year-over-year growth 2023-2028 (%)
- 9.7 Middle East and Africa - Market size and forecast 2023-2028
- Chart on Middle East and Africa - Market size and forecast 2023-2028 ($ million)
- Data Table on Middle East and Africa - Market size and forecast 2023-2028 ($ million)
- Chart on Middle East and Africa - Year-over-year growth 2023-2028 (%)
- Data Table on Middle East and Africa - Year-over-year growth 2023-2028 (%)
- 9.8 China - Market size and forecast 2023-2028
- Chart on China - Market size and forecast 2023-2028 ($ million)
- Data Table on China - Market size and forecast 2023-2028 ($ million)
- Chart on China - Year-over-year growth 2023-2028 (%)
- Data Table on China - Year-over-year growth 2023-2028 (%)
- 9.9 South Korea - Market size and forecast 2023-2028
- Chart on South Korea - Market size and forecast 2023-2028 ($ million)
- Data Table on South Korea - Market size and forecast 2023-2028 ($ million)
- Chart on South Korea - Year-over-year growth 2023-2028 (%)
- Data Table on South Korea - Year-over-year growth 2023-2028 (%)
- 9.10 Japan - Market size and forecast 2023-2028
- Chart on Japan - Market size and forecast 2023-2028 ($ million)
- Data Table on Japan - Market size and forecast 2023-2028 ($ million)
- Chart on Japan - Year-over-year growth 2023-2028 (%)
- Data Table on Japan - Year-over-year growth 2023-2028 (%)
- 9.11 US - Market size and forecast 2023-2028
- Chart on US - Market size and forecast 2023-2028 ($ million)
- Data Table on US - Market size and forecast 2023-2028 ($ million)
- Chart on US - Year-over-year growth 2023-2028 (%)
- Data Table on US - Year-over-year growth 2023-2028 (%)
- 9.12 Taiwan - Market size and forecast 2023-2028
- Chart on Taiwan - Market size and forecast 2023-2028 ($ million)
- Data Table on Taiwan - Market size and forecast 2023-2028 ($ million)
- Chart on Taiwan - Year-over-year growth 2023-2028 (%)
- Data Table on Taiwan - Year-over-year growth 2023-2028 (%)
- 9.13 Market opportunity By Geographical Landscape
- Market opportunity By Geographical Landscape ($ million)
- Data Tables on Market opportunity By Geographical Landscape ($ million)
10 Drivers, Challenges, and Opportunity/Restraints
- 10.1 Market drivers
- 10.2 Market challenges
- 10.3 Impact of drivers and challenges
- Impact of drivers and challenges in 2023 and 2028
- 10.4 Market opportunities/restraints
11 Competitive Landscape
- 11.1 Overview
- 11.2 Competitive Landscape
- Overview on criticality of inputs and factors of differentiation
- 11.3 Landscape disruption
- Overview on factors of disruption
- 11.4 Industry risks
- Impact of key risks on business
12 Competitive Analysis
- 12.1 Companies profiled
- Companies covered
- 12.2 Market positioning of companies
- Matrix on companies position and classification
- 12.3 Advanced Micro Devices Inc.
- Advanced Micro Devices Inc. - Overview
- Advanced Micro Devices Inc. - Business segments
- Advanced Micro Devices Inc. - Key news
- Advanced Micro Devices Inc. - Key offerings
- Advanced Micro Devices Inc. - Segment focus
- 12.4 Analog Devices Inc.
- Analog Devices Inc. - Overview
- Analog Devices Inc. - Business segments
- Analog Devices Inc. - Key news
- Analog Devices Inc. - Key offerings
- Analog Devices Inc. - Segment focus
- 12.5 Huawei Technologies Co. Ltd.
- Huawei Technologies Co. Ltd. - Overview
- Huawei Technologies Co. Ltd. - Product / Service
- Huawei Technologies Co. Ltd. - Key news
- Huawei Technologies Co. Ltd. - Key offerings
- 12.6 Infineon Technologies AG
- Infineon Technologies AG - Overview
- Infineon Technologies AG - Business segments
- Infineon Technologies AG - Key news
- Infineon Technologies AG - Key offerings
- Infineon Technologies AG - Segment focus
- 12.7 Intel Corp.
- Intel Corp. - Overview
- Intel Corp. - Business segments
- Intel Corp. - Key news
- Intel Corp. - Key offerings
- Intel Corp. - Segment focus
- 12.8 Marvell Technology Inc.
- Marvell Technology Inc. - Overview
- Marvell Technology Inc. - Product / Service
- Marvell Technology Inc. - Key offerings
- 12.9 MediaTek Inc.
- MediaTek Inc. - Overview
- MediaTek Inc. - Product / Service
- MediaTek Inc. - Key news
- MediaTek Inc. - Key offerings
- 12.10 Microchip Technology Inc.
- Microchip Technology Inc. - Overview
- Microchip Technology Inc. - Business segments
- Microchip Technology Inc. - Key news
- Microchip Technology Inc. - Key offerings
- Microchip Technology Inc. - Segment focus
- 12.11 NVIDIA Corp.
- NVIDIA Corp. - Overview
- NVIDIA Corp. - Business segments
- NVIDIA Corp. - Key news
- NVIDIA Corp. - Key offerings
- NVIDIA Corp. - Segment focus
- 12.12 NXP Semiconductors NV
- NXP Semiconductors NV - Overview
- NXP Semiconductors NV - Product / Service
- NXP Semiconductors NV - Key news
- NXP Semiconductors NV - Key offerings
- 12.13 Qualcomm Inc.
- Qualcomm Inc. - Overview
- Qualcomm Inc. - Business segments
- Qualcomm Inc. - Key news
- Qualcomm Inc. - Key offerings
- Qualcomm Inc. - Segment focus
- 12.14 Renesas Electronics Corp.
- Renesas Electronics Corp. - Overview
- Renesas Electronics Corp. - Business segments
- Renesas Electronics Corp. - Key news
- Renesas Electronics Corp. - Key offerings
- Renesas Electronics Corp. - Segment focus
- 12.15 Samsung Electronics Co. Ltd.
- Samsung Electronics Co. Ltd. - Overview
- Samsung Electronics Co. Ltd. - Business segments
- Samsung Electronics Co. Ltd. - Key news
- Samsung Electronics Co. Ltd. - Key offerings
- Samsung Electronics Co. Ltd. - Segment focus
- 12.16 STMicroelectronics International N.V.
- STMicroelectronics International N.V. - Overview
- STMicroelectronics International N.V. - Business segments
- STMicroelectronics International N.V. - Key news
- STMicroelectronics International N.V. - Key offerings
- STMicroelectronics International N.V. - Segment focus
- 12.17 Texas Instruments Inc.
- Texas Instruments Inc. - Overview
- Texas Instruments Inc. - Business segments
- Texas Instruments Inc. - Key offerings
- Texas Instruments Inc. - Segment focus
13 Appendix
- 13.1 Scope of the report
- 13.2 Inclusions and exclusions checklist
- Inclusions checklist
- Exclusions checklist
- 13.3 Currency conversion rates for US$
- Currency conversion rates for US$
- 13.4 Research methodology
- Research methodology
- 13.5 Data procurement
- Information sources
- 13.6 Data validation
- Data validation
- 13.7 Validation techniques employed for market sizing
- Validation techniques employed for market sizing
- 13.8 Data synthesis
- Data synthesis
- 13.9 360 degree market analysis
- 360 degree market analysis
- 13.10 List of abbreviations
- List of abbreviations

