|
|
市場調査レポート
商品コード
1516991
硝酸カリウムの世界市場 2024-2028Global potassium nitrate market 2024-2028 |
||||||
|
|||||||
カスタマイズ可能
|
|||||||

| 硝酸カリウムの世界市場 2024-2028 |
|
出版日: 2024年06月12日
発行: TechNavio
ページ情報: 英文 172 Pages
納期: 即納可能
|

全表示
- 概要
- 図表
- 目次
硝酸カリウム市場は2023-2028年に3億6,370万米ドル、予測期間中のCAGRは3.06%で成長すると予測されます。
当レポートでは、硝酸カリウム市場の全体的な分析、市場規模・予測、動向、成長促進要因、課題、約25のベンダーを網羅したベンダー分析などを掲載しています。
現在の市場シナリオ、最新動向と促進要因、市場環境全体に関する最新分析を提供しています。市場は、硝酸カリウムベースの肥料需要の増加、食品加工産業への応用、採鉱目的での硝酸カリウム使用の増加によって牽引されています。
| 市場範囲 | |
|---|---|
| 基準年 | 2024 |
| 終了年 | 2028 |
| 予測期間 | 2024-2028 |
| 成長モメンタム | 加速 |
| 前年比2024年 | 2.94% |
| CAGR | 3.06% |
| 増分額 | 3億6,370万米ドル |
本調査では、殺菌剤の使用拡大が今後数年間の硝酸カリウム市場成長を牽引する主要因の1つであるとしています。また、農業生産性を向上させるための世界の取り組みや有機農業に対する意識の高まりも、市場の大きな需要につながると思われます。
目次
第1章 エグゼクティブサマリー
- 市場概要
第2章 市場情勢
- 市場エコシステム
- 市場の特徴
- バリューチェーン分析
第3章 市場規模の評価
- 市場の定義
- 市場セグメント分析
- 市場規模 2023
- 市場の見通し 2023-2028
第4章 市場規模実績
- 世界硝酸カリウム市場 2018-2022
- エンドユーザー別セグメント分析 2018-2022
- タイプ別セグメント分析 2018-2022
- 地域別セグメント分析 2018-2022
- 国別セグメント分析 2018-2022
第5章 ファイブフォース分析
- ファイブフォースの要約
- 買い手の交渉力
- 供給企業の交渉力
- 新規参入業者の脅威
- 代替品の脅威
- 競争の脅威
- 市況
第6章 市場セグメンテーション:エンドユーザー別
- 市場セグメンテーション
- 比較:エンドユーザー別
- 農業:市場規模と予測 2023-2028
- 一般産業:市場規模と予測 2023-2028
- 製薬:市場規模と予測 2023-2028
- 飲食品:市場規模と予測 2023-2028
- 市場機会:エンドユーザー別
第7章 市場セグメンテーション:タイプ別
- 市場セグメンテーション
- 比較:タイプ別
- 塩化カリウム:市場規模と予測 2023-2028
- 硝酸ナトリウム:市場規模と予測 2023-2028
- 硝酸アンモニウム:市場規模と予測 2023-2028
- 市場機会:タイプ別
第8章 顧客情勢
- 顧客情勢の概要
第9章 地域別情勢
- 地域別セグメンテーション
- 地域別比較
- アジア太平洋:市場規模と予測 2023-2028
- 北米:市場規模と予測 2023-2028
- 欧州:市場規模と予測 2023-2028
- 中東・アフリカ:市場規模と予測 2023-2028
- 南米:市場規模と予測 2023-2028
- 米国:市場規模と予測 2023-2028
- 中国:市場規模と予測 2023-2028
- インド:市場規模と予測 2023-2028
- 日本:市場規模と予測 2023-2028
- カナダ:市場規模と予測 2023-2028
- 市場機会:地域情勢別
第10章 促進要因・課題・機会・抑制要因
- 市場促進要因
- 市場の課題
- 促進要因と課題の影響
- 市場の機会・抑制要因
第11章 競合情勢
- 概要
- 競合情勢
- 混乱の状況
- 業界のリスク
第12章 競合分析
- 企業プロファイル
- 企業の市場ポジショニング
- AG Chemi Group s.r.o.
- Akshay Group of Companies
- Anish Chemicals
- Arihant Chemical
- Jagannath Chemicals
- Otsuka Chemical Co. Ltd.
- Otto Chemie Pvt. Ltd.
- Penta s.r.o
- SNDB
- Spectrum Laboratory Products Inc.
- SQM S.A.
- Vizag Chemical International
- Wentong Potassium Salt Group Co. Ltd.
- Yara International ASA
- Yogi Dye Chem Industries
第13章 付録
Exhibits:
- Exhibits1: Executive Summary - Chart on Market Overview
- Exhibits2: Executive Summary - Data Table on Market Overview
- Exhibits3: Executive Summary - Chart on Global Market Characteristics
- Exhibits4: Executive Summary - Chart on Market By Geographical Landscape
- Exhibits5: Executive Summary - Chart on Market Segmentation by End-user
- Exhibits6: Executive Summary - Chart on Market Segmentation by Type
- Exhibits7: Executive Summary - Chart on Incremental Growth
- Exhibits8: Executive Summary - Data Table on Incremental Growth
- Exhibits9: Executive Summary - Chart on Company Market Positioning
- Exhibits10: Parent Market
- Exhibits11: Data Table on - Parent Market
- Exhibits12: Market characteristics analysis
- Exhibits13: Value Chain Analysis
- Exhibits14: Offerings of companies included in the market definition
- Exhibits15: Market segments
- Exhibits16: Chart on Global - Market size and forecast 2023-2028 ($ million)
- Exhibits17: Data Table on Global - Market size and forecast 2023-2028 ($ million)
- Exhibits18: Chart on Global Market: Year-over-year growth 2023-2028 (%)
- Exhibits19: Data Table on Global Market: Year-over-year growth 2023-2028 (%)
- Exhibits20: Historic Market Size - Data Table on Global Potassium Nitrate Market 2018 - 2022 ($ million)
- Exhibits21: Historic Market Size - End-user Segment 2018 - 2022 ($ million)
- Exhibits22: Historic Market Size - Type Segment 2018 - 2022 ($ million)
- Exhibits23: Historic Market Size - Geography Segment 2018 - 2022 ($ million)
- Exhibits24: Historic Market Size - Country Segment 2018 - 2022 ($ million)
- Exhibits25: Five forces analysis - Comparison between 2023 and 2028
- Exhibits26: Bargaining power of buyers - Impact of key factors 2023 and 2028
- Exhibits27: Bargaining power of suppliers - Impact of key factors in 2023 and 2028
- Exhibits28: Threat of new entrants - Impact of key factors in 2023 and 2028
- Exhibits29: Threat of substitutes - Impact of key factors in 2023 and 2028
- Exhibits30: Threat of rivalry - Impact of key factors in 2023 and 2028
- Exhibits31: Chart on Market condition - Five forces 2023 and 2028
- Exhibits32: Chart on End-user - Market share 2023-2028 (%)
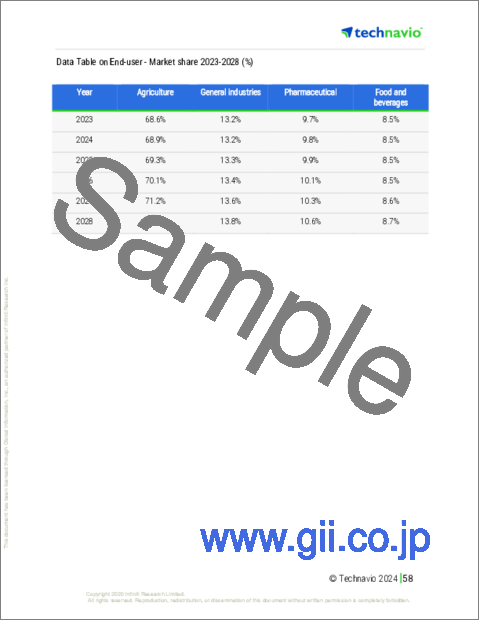
- Exhibits33: Data Table on End-user - Market share 2023-2028 (%)
- Exhibits34: Chart on Comparison by End-user
- Exhibits35: Data Table on Comparison by End-user
- Exhibits36: Chart on Agriculture - Market size and forecast 2023-2028 ($ million)
- Exhibits37: Data Table on Agriculture - Market size and forecast 2023-2028 ($ million)
- Exhibits38: Chart on Agriculture - Year-over-year growth 2023-2028 (%)
- Exhibits39: Data Table on Agriculture - Year-over-year growth 2023-2028 (%)
- Exhibits40: Chart on General industries - Market size and forecast 2023-2028 ($ million)
- Exhibits41: Data Table on General industries - Market size and forecast 2023-2028 ($ million)
- Exhibits42: Chart on General industries - Year-over-year growth 2023-2028 (%)
- Exhibits43: Data Table on General industries - Year-over-year growth 2023-2028 (%)
- Exhibits44: Chart on Pharmaceutical - Market size and forecast 2023-2028 ($ million)
- Exhibits45: Data Table on Pharmaceutical - Market size and forecast 2023-2028 ($ million)
- Exhibits46: Chart on Pharmaceutical - Year-over-year growth 2023-2028 (%)
- Exhibits47: Data Table on Pharmaceutical - Year-over-year growth 2023-2028 (%)
- Exhibits48: Chart on Food and beverages - Market size and forecast 2023-2028 ($ million)
- Exhibits49: Data Table on Food and beverages - Market size and forecast 2023-2028 ($ million)
- Exhibits50: Chart on Food and beverages - Year-over-year growth 2023-2028 (%)
- Exhibits51: Data Table on Food and beverages - Year-over-year growth 2023-2028 (%)
- Exhibits52: Market opportunity by End-user ($ million)
- Exhibits53: Data Table on Market opportunity by End-user ($ million)
- Exhibits54: Chart on Type - Market share 2023-2028 (%)
- Exhibits55: Data Table on Type - Market share 2023-2028 (%)
- Exhibits56: Chart on Comparison by Type
- Exhibits57: Data Table on Comparison by Type
- Exhibits58: Chart on Potassium chloride - Market size and forecast 2023-2028 ($ million)
- Exhibits59: Data Table on Potassium chloride - Market size and forecast 2023-2028 ($ million)
- Exhibits60: Chart on Potassium chloride - Year-over-year growth 2023-2028 (%)
- Exhibits61: Data Table on Potassium chloride - Year-over-year growth 2023-2028 (%)
- Exhibits62: Chart on Sodium nitrate - Market size and forecast 2023-2028 ($ million)
- Exhibits63: Data Table on Sodium nitrate - Market size and forecast 2023-2028 ($ million)
- Exhibits64: Chart on Sodium nitrate - Year-over-year growth 2023-2028 (%)
- Exhibits65: Data Table on Sodium nitrate - Year-over-year growth 2023-2028 (%)
- Exhibits66: Chart on Ammonium nitrate - Market size and forecast 2023-2028 ($ million)
- Exhibits67: Data Table on Ammonium nitrate - Market size and forecast 2023-2028 ($ million)
- Exhibits68: Chart on Ammonium nitrate - Year-over-year growth 2023-2028 (%)
- Exhibits69: Data Table on Ammonium nitrate - Year-over-year growth 2023-2028 (%)
- Exhibits70: Market opportunity by Type ($ million)
- Exhibits71: Data Table on Market opportunity by Type ($ million)
- Exhibits72: Analysis of price sensitivity, lifecycle, customer purchase basket, adoption rates, and purchase criteria
- Exhibits73: Chart on Market share By Geographical Landscape 2023-2028 (%)
- Exhibits74: Data Table on Market share By Geographical Landscape 2023-2028 (%)
- Exhibits75: Chart on Geographic comparison
- Exhibits76: Data Table on Geographic comparison
- Exhibits77: Chart on APAC - Market size and forecast 2023-2028 ($ million)
- Exhibits78: Data Table on APAC - Market size and forecast 2023-2028 ($ million)
- Exhibits79: Chart on APAC - Year-over-year growth 2023-2028 (%)
- Exhibits80: Data Table on APAC - Year-over-year growth 2023-2028 (%)
- Exhibits81: Chart on North America - Market size and forecast 2023-2028 ($ million)
- Exhibits82: Data Table on North America - Market size and forecast 2023-2028 ($ million)
- Exhibits83: Chart on North America - Year-over-year growth 2023-2028 (%)
- Exhibits84: Data Table on North America - Year-over-year growth 2023-2028 (%)
- Exhibits85: Chart on Europe - Market size and forecast 2023-2028 ($ million)
- Exhibits86: Data Table on Europe - Market size and forecast 2023-2028 ($ million)
- Exhibits87: Chart on Europe - Year-over-year growth 2023-2028 (%)
- Exhibits88: Data Table on Europe - Year-over-year growth 2023-2028 (%)
- Exhibits89: Chart on Middle East and Africa - Market size and forecast 2023-2028 ($ million)
- Exhibits90: Data Table on Middle East and Africa - Market size and forecast 2023-2028 ($ million)
- Exhibits91: Chart on Middle East and Africa - Year-over-year growth 2023-2028 (%)
- Exhibits92: Data Table on Middle East and Africa - Year-over-year growth 2023-2028 (%)
- Exhibits93: Chart on South America - Market size and forecast 2023-2028 ($ million)
- Exhibits94: Data Table on South America - Market size and forecast 2023-2028 ($ million)
- Exhibits95: Chart on South America - Year-over-year growth 2023-2028 (%)
- Exhibits96: Data Table on South America - Year-over-year growth 2023-2028 (%)
- Exhibits97: Chart on US - Market size and forecast 2023-2028 ($ million)
- Exhibits98: Data Table on US - Market size and forecast 2023-2028 ($ million)
- Exhibits99: Chart on US - Year-over-year growth 2023-2028 (%)
- Exhibits100: Data Table on US - Year-over-year growth 2023-2028 (%)
- Exhibits101: Chart on China - Market size and forecast 2023-2028 ($ million)
- Exhibits102: Data Table on China - Market size and forecast 2023-2028 ($ million)
- Exhibits103: Chart on China - Year-over-year growth 2023-2028 (%)
- Exhibits104: Data Table on China - Year-over-year growth 2023-2028 (%)
- Exhibits105: Chart on India - Market size and forecast 2023-2028 ($ million)
- Exhibits106: Data Table on India - Market size and forecast 2023-2028 ($ million)
- Exhibits107: Chart on India - Year-over-year growth 2023-2028 (%)
- Exhibits108: Data Table on India - Year-over-year growth 2023-2028 (%)
- Exhibits109: Chart on Japan - Market size and forecast 2023-2028 ($ million)
- Exhibits110: Data Table on Japan - Market size and forecast 2023-2028 ($ million)
- Exhibits111: Chart on Japan - Year-over-year growth 2023-2028 (%)
- Exhibits112: Data Table on Japan - Year-over-year growth 2023-2028 (%)
- Exhibits113: Chart on Canada - Market size and forecast 2023-2028 ($ million)
- Exhibits114: Data Table on Canada - Market size and forecast 2023-2028 ($ million)
- Exhibits115: Chart on Canada - Year-over-year growth 2023-2028 (%)
- Exhibits116: Data Table on Canada - Year-over-year growth 2023-2028 (%)
- Exhibits117: Market opportunity By Geographical Landscape ($ million)
- Exhibits118: Data Tables on Market opportunity By Geographical Landscape ($ million)
- Exhibits119: Impact of drivers and challenges in 2023 and 2028
- Exhibits120: Overview on criticality of inputs and factors of differentiation
- Exhibits121: Overview on factors of disruption
- Exhibits122: Impact of key risks on business
- Exhibits123: Companies covered
- Exhibits124: Matrix on companies position and classification
- Exhibits125: AG Chemi Group s.r.o. - Overview
- Exhibits126: AG Chemi Group s.r.o. - Product / Service
- Exhibits127: AG Chemi Group s.r.o. - Key offerings
- Exhibits128: Akshay Group of Companies - Overview
- Exhibits129: Akshay Group of Companies - Product / Service
- Exhibits130: Akshay Group of Companies - Key offerings
- Exhibits131: Anish Chemicals - Overview
- Exhibits132: Anish Chemicals - Product / Service
- Exhibits133: Anish Chemicals - Key offerings
- Exhibits134: Arihant Chemical - Overview
- Exhibits135: Arihant Chemical - Product / Service
- Exhibits136: Arihant Chemical - Key offerings
- Exhibits137: Jagannath Chemicals - Overview
- Exhibits138: Jagannath Chemicals - Product / Service
- Exhibits139: Jagannath Chemicals - Key offerings
- Exhibits140: Otsuka Chemical Co. Ltd. - Overview
- Exhibits141: Otsuka Chemical Co. Ltd. - Product / Service
- Exhibits142: Otsuka Chemical Co. Ltd. - Key offerings
- Exhibits143: Otto Chemie Pvt. Ltd. - Overview
- Exhibits144: Otto Chemie Pvt. Ltd. - Product / Service
- Exhibits145: Otto Chemie Pvt. Ltd. - Key offerings
- Exhibits146: Penta s.r.o - Overview
- Exhibits147: Penta s.r.o - Product / Service
- Exhibits148: Penta s.r.o - Key offerings
- Exhibits149: SNDB - Overview
- Exhibits150: SNDB - Product / Service
- Exhibits151: SNDB - Key offerings
- Exhibits152: Spectrum Laboratory Products Inc. - Overview
- Exhibits153: Spectrum Laboratory Products Inc. - Product / Service
- Exhibits154: Spectrum Laboratory Products Inc. - Key news
- Exhibits155: Spectrum Laboratory Products Inc. - Key offerings
- Exhibits156: SQM S.A. - Overview
- Exhibits157: SQM S.A. - Business segments
- Exhibits158: SQM S.A. - Key news
- Exhibits159: SQM S.A. - Key offerings
- Exhibits160: SQM S.A. - Segment focus
- Exhibits161: Vizag Chemical International - Overview
- Exhibits162: Vizag Chemical International - Product / Service
- Exhibits163: Vizag Chemical International - Key offerings
- Exhibits164: Wentong Potassium Salt Group Co. Ltd. - Overview
- Exhibits165: Wentong Potassium Salt Group Co. Ltd. - Product / Service
- Exhibits166: Wentong Potassium Salt Group Co. Ltd. - Key offerings
- Exhibits167: Yara International ASA - Overview
- Exhibits168: Yara International ASA - Business segments
- Exhibits169: Yara International ASA - Key offerings
- Exhibits170: Yara International ASA - Segment focus
- Exhibits171: Yogi Dye Chem Industries - Overview
- Exhibits172: Yogi Dye Chem Industries - Product / Service
- Exhibits173: Yogi Dye Chem Industries - Key offerings
- Exhibits174: Inclusions checklist
- Exhibits175: Exclusions checklist
- Exhibits176: Currency conversion rates for US$
- Exhibits177: Research methodology
- Exhibits178: Information sources
- Exhibits179: Data validation
- Exhibits180: Validation techniques employed for market sizing
- Exhibits181: Data synthesis
- Exhibits182: 360 degree market analysis
- Exhibits183: List of abbreviations
The potassium nitrate market is forecasted to grow by USD 363.7 mn during 2023-2028, accelerating AT a CAGR of 3.06% during the forecast period. The report on the potassium nitrate market provides a holistic analysis, market size and forecast, trends, growth drivers, and challenges, as well as vendor analysis covering around 25 vendors.
The report offers an up-to-date analysis regarding the current market scenario, the latest trends and drivers, and the overall market environment. The market is driven by increase in demand for potassium nitrate-based fertilizers, application in food processing industry, and growing use of potassium nitrate for mining purposes.
Technavio's potassium nitrate market is segmented as below:
| Market Scope | |
|---|---|
| Base Year | 2024 |
| End Year | 2028 |
| Series Year | 2024-2028 |
| Growth Momentum | Accelerate |
| YOY 2024 | 2.94% |
| CAGR | 3.06% |
| Incremental Value | $363.7mn |
By End-user
- Agriculture
- General industries
- Pharmaceutical
- Food and beverages
By Type
- Potassium chloride
- Sodium nitrate
- Ammonium nitrate
By Geographical Landscape
- APAC
- North America
- Europe
- Middle East and Africa
- South America
This study identifies the growing use of fungicides as one of the prime reasons driving the potassium nitrate market growth during the next few years. Also, global initiatives to improve agricultural productivity and growing awareness about organic farming will lead to sizable demand in the market.
The report on the potassium nitrate market covers the following areas:
- Potassium nitrate market sizing
- Potassium nitrate market forecast
- Potassium nitrate market industry analysis
The robust vendor analysis is designed to help clients improve their market position, and in line with this, this report provides a detailed analysis of several leading potassium nitrate market vendors that include AG Chemi Group s.r.o., Akshay Group of Companies, Anish Chemicals, Arihant Chemical, BGP Group of Companies, Jagannath Chemicals, Jost Chemical Co., Nitroparis S.L., Otsuka Chemical Co. Ltd., Otto Chemie Pvt. Ltd., Penta s.r.o, Ravi Chem Industries, SNDB, Spectrum Laboratory Products Inc., SQM S.A., Vizag Chemical International, VWR International LLC, Wentong Potassium Salt Group Co. Ltd., Yara International ASA, and Yogi Dye Chem Industries. Also, the potassium nitrate market analysis report includes information on upcoming trends and challenges that will influence market growth. This is to help companies strategize and leverage all forthcoming growth opportunities.
The study was conducted using an objective combination of primary and secondary information including inputs from key participants in the industry. The report contains a comprehensive market and vendor landscape in addition to an analysis of the key vendors.
The publisher presents a detailed picture of the market by the way of study, synthesis, and summation of data from multiple sources by an analysis of key parameters such as profit, pricing, competition, and promotions. IT presents various market facets by identifying the key industry influencers. The data presented is comprehensive, reliable, and a result of extensive research - both primary and secondary. The market research reports provide a complete competitive landscape and an in-depth vendor selection methodology and analysis using qualitative and quantitative research to forecast the accurate market growth.
Table of Contents
1 Executive Summary
- 1.1 Market overview
- Executive Summary - Chart on Market Overview
- Executive Summary - Data Table on Market Overview
- Executive Summary - Chart on Global Market Characteristics
- Executive Summary - Chart on Market By Geographical Landscape
- Executive Summary - Chart on Market Segmentation by End-user
- Executive Summary - Chart on Market Segmentation by Type
- Executive Summary - Chart on Incremental Growth
- Executive Summary - Data Table on Incremental Growth
- Executive Summary - Chart on Company Market Positioning
2 Market Landscape
- 2.1 Market ecosystem
- Parent Market
- Data Table on - Parent Market
- 2.2 Market characteristics
- Market characteristics analysis
- 2.3 Value chain analysis
- Value Chain Analysis
3 Market Sizing
- 3.1 Market definition
- Offerings of companies included in the market definition
- 3.2 Market segment analysis
- Market segments
- 3.3 Market size 2023
- 3.4 Market outlook: Forecast for 2023-2028
- Chart on Global - Market size and forecast 2023-2028 ($ million)
- Data Table on Global - Market size and forecast 2023-2028 ($ million)
- Chart on Global Market: Year-over-year growth 2023-2028 (%)
- Data Table on Global Market: Year-over-year growth 2023-2028 (%)
4 Historic Market Size
- 4.1 Global Potassium Nitrate Market 2018 - 2022
- Historic Market Size - Data Table on Global Potassium Nitrate Market 2018 - 2022 ($ million)
- 4.2 End-user segment analysis 2018 - 2022
- Historic Market Size - End-user Segment 2018 - 2022 ($ million)
- 4.3 Type segment analysis 2018 - 2022
- Historic Market Size - Type Segment 2018 - 2022 ($ million)
- 4.4 Geography segment analysis 2018 - 2022
- Historic Market Size - Geography Segment 2018 - 2022 ($ million)
- 4.5 Country segment analysis 2018 - 2022
- Historic Market Size - Country Segment 2018 - 2022 ($ million)
5 Five Forces Analysis
- 5.1 Five forces summary
- Five forces analysis - Comparison between 2023 and 2028
- 5.2 Bargaining power of buyers
- Bargaining power of buyers - Impact of key factors 2023 and 2028
- 5.3 Bargaining power of suppliers
- Bargaining power of suppliers - Impact of key factors in 2023 and 2028
- 5.4 Threat of new entrants
- Threat of new entrants - Impact of key factors in 2023 and 2028
- 5.5 Threat of substitutes
- Threat of substitutes - Impact of key factors in 2023 and 2028
- 5.6 Threat of rivalry
- Threat of rivalry - Impact of key factors in 2023 and 2028
- 5.7 Market condition
- Chart on Market condition - Five forces 2023 and 2028
6 Market Segmentation by End-user
- 6.1 Market segments
- Chart on End-user - Market share 2023-2028 (%)
- Data Table on End-user - Market share 2023-2028 (%)
- 6.2 Comparison by End-user
- Chart on Comparison by End-user
- Data Table on Comparison by End-user
- 6.3 Agriculture - Market size and forecast 2023-2028
- Chart on Agriculture - Market size and forecast 2023-2028 ($ million)
- Data Table on Agriculture - Market size and forecast 2023-2028 ($ million)
- Chart on Agriculture - Year-over-year growth 2023-2028 (%)
- Data Table on Agriculture - Year-over-year growth 2023-2028 (%)
- 6.4 General industries - Market size and forecast 2023-2028
- Chart on General industries - Market size and forecast 2023-2028 ($ million)
- Data Table on General industries - Market size and forecast 2023-2028 ($ million)
- Chart on General industries - Year-over-year growth 2023-2028 (%)
- Data Table on General industries - Year-over-year growth 2023-2028 (%)
- 6.5 Pharmaceutical - Market size and forecast 2023-2028
- Chart on Pharmaceutical - Market size and forecast 2023-2028 ($ million)
- Data Table on Pharmaceutical - Market size and forecast 2023-2028 ($ million)
- Chart on Pharmaceutical - Year-over-year growth 2023-2028 (%)
- Data Table on Pharmaceutical - Year-over-year growth 2023-2028 (%)
- 6.6 Food and beverages - Market size and forecast 2023-2028
- Chart on Food and beverages - Market size and forecast 2023-2028 ($ million)
- Data Table on Food and beverages - Market size and forecast 2023-2028 ($ million)
- Chart on Food and beverages - Year-over-year growth 2023-2028 (%)
- Data Table on Food and beverages - Year-over-year growth 2023-2028 (%)
- 6.7 Market opportunity by End-user
- Market opportunity by End-user ($ million)
- Data Table on Market opportunity by End-user ($ million)
7 Market Segmentation by Type
- 7.1 Market segments
- Chart on Type - Market share 2023-2028 (%)
- Data Table on Type - Market share 2023-2028 (%)
- 7.2 Comparison by Type
- Chart on Comparison by Type
- Data Table on Comparison by Type
- 7.3 Potassium chloride - Market size and forecast 2023-2028
- Chart on Potassium chloride - Market size and forecast 2023-2028 ($ million)
- Data Table on Potassium chloride - Market size and forecast 2023-2028 ($ million)
- Chart on Potassium chloride - Year-over-year growth 2023-2028 (%)
- Data Table on Potassium chloride - Year-over-year growth 2023-2028 (%)
- 7.4 Sodium nitrate - Market size and forecast 2023-2028
- Chart on Sodium nitrate - Market size and forecast 2023-2028 ($ million)
- Data Table on Sodium nitrate - Market size and forecast 2023-2028 ($ million)
- Chart on Sodium nitrate - Year-over-year growth 2023-2028 (%)
- Data Table on Sodium nitrate - Year-over-year growth 2023-2028 (%)
- 7.5 Ammonium nitrate - Market size and forecast 2023-2028
- Chart on Ammonium nitrate - Market size and forecast 2023-2028 ($ million)
- Data Table on Ammonium nitrate - Market size and forecast 2023-2028 ($ million)
- Chart on Ammonium nitrate - Year-over-year growth 2023-2028 (%)
- Data Table on Ammonium nitrate - Year-over-year growth 2023-2028 (%)
- 7.6 Market opportunity by Type
- Market opportunity by Type ($ million)
- Data Table on Market opportunity by Type ($ million)
8 Customer Landscape
- 8.1 Customer landscape overview
- Analysis of price sensitivity, lifecycle, customer purchase basket, adoption rates, and purchase criteria
9 Geographic Landscape
- 9.1 Geographic segmentation
- Chart on Market share By Geographical Landscape 2023-2028 (%)
- Data Table on Market share By Geographical Landscape 2023-2028 (%)
- 9.2 Geographic comparison
- Chart on Geographic comparison
- Data Table on Geographic comparison
- 9.3 APAC - Market size and forecast 2023-2028
- Chart on APAC - Market size and forecast 2023-2028 ($ million)
- Data Table on APAC - Market size and forecast 2023-2028 ($ million)
- Chart on APAC - Year-over-year growth 2023-2028 (%)
- Data Table on APAC - Year-over-year growth 2023-2028 (%)
- 9.4 North America - Market size and forecast 2023-2028
- Chart on North America - Market size and forecast 2023-2028 ($ million)
- Data Table on North America - Market size and forecast 2023-2028 ($ million)
- Chart on North America - Year-over-year growth 2023-2028 (%)
- Data Table on North America - Year-over-year growth 2023-2028 (%)
- 9.5 Europe - Market size and forecast 2023-2028
- Chart on Europe - Market size and forecast 2023-2028 ($ million)
- Data Table on Europe - Market size and forecast 2023-2028 ($ million)
- Chart on Europe - Year-over-year growth 2023-2028 (%)
- Data Table on Europe - Year-over-year growth 2023-2028 (%)
- 9.6 Middle East and Africa - Market size and forecast 2023-2028
- Chart on Middle East and Africa - Market size and forecast 2023-2028 ($ million)
- Data Table on Middle East and Africa - Market size and forecast 2023-2028 ($ million)
- Chart on Middle East and Africa - Year-over-year growth 2023-2028 (%)
- Data Table on Middle East and Africa - Year-over-year growth 2023-2028 (%)
- 9.7 South America - Market size and forecast 2023-2028
- Chart on South America - Market size and forecast 2023-2028 ($ million)
- Data Table on South America - Market size and forecast 2023-2028 ($ million)
- Chart on South America - Year-over-year growth 2023-2028 (%)
- Data Table on South America - Year-over-year growth 2023-2028 (%)
- 9.8 US - Market size and forecast 2023-2028
- Chart on US - Market size and forecast 2023-2028 ($ million)
- Data Table on US - Market size and forecast 2023-2028 ($ million)
- Chart on US - Year-over-year growth 2023-2028 (%)
- Data Table on US - Year-over-year growth 2023-2028 (%)
- 9.9 China - Market size and forecast 2023-2028
- Chart on China - Market size and forecast 2023-2028 ($ million)
- Data Table on China - Market size and forecast 2023-2028 ($ million)
- Chart on China - Year-over-year growth 2023-2028 (%)
- Data Table on China - Year-over-year growth 2023-2028 (%)
- 9.10 India - Market size and forecast 2023-2028
- Chart on India - Market size and forecast 2023-2028 ($ million)
- Data Table on India - Market size and forecast 2023-2028 ($ million)
- Chart on India - Year-over-year growth 2023-2028 (%)
- Data Table on India - Year-over-year growth 2023-2028 (%)
- 9.11 Japan - Market size and forecast 2023-2028
- Chart on Japan - Market size and forecast 2023-2028 ($ million)
- Data Table on Japan - Market size and forecast 2023-2028 ($ million)
- Chart on Japan - Year-over-year growth 2023-2028 (%)
- Data Table on Japan - Year-over-year growth 2023-2028 (%)
- 9.12 Canada - Market size and forecast 2023-2028
- Chart on Canada - Market size and forecast 2023-2028 ($ million)
- Data Table on Canada - Market size and forecast 2023-2028 ($ million)
- Chart on Canada - Year-over-year growth 2023-2028 (%)
- Data Table on Canada - Year-over-year growth 2023-2028 (%)
- 9.13 Market opportunity By Geographical Landscape
- Market opportunity By Geographical Landscape ($ million)
- Data Tables on Market opportunity By Geographical Landscape ($ million)
10 Drivers, Challenges, and Opportunity/Restraints
- 10.1 Market drivers
- 10.2 Market challenges
- 10.3 Impact of drivers and challenges
- Impact of drivers and challenges in 2023 and 2028
- 10.4 Market opportunities/restraints
11 Competitive Landscape
- 11.1 Overview
- 11.2 Competitive Landscape
- Overview on criticality of inputs and factors of differentiation
- 11.3 Landscape disruption
- Overview on factors of disruption
- 11.4 Industry risks
- Impact of key risks on business
12 Competitive Analysis
- 12.1 Companies profiled
- Companies covered
- 12.2 Market positioning of companies
- Matrix on companies position and classification
- 12.3 AG Chemi Group s.r.o.
- AG Chemi Group s.r.o. - Overview
- AG Chemi Group s.r.o. - Product / Service
- AG Chemi Group s.r.o. - Key offerings
- 12.4 Akshay Group of Companies
- Akshay Group of Companies - Overview
- Akshay Group of Companies - Product / Service
- Akshay Group of Companies - Key offerings
- 12.5 Anish Chemicals
- Anish Chemicals - Overview
- Anish Chemicals - Product / Service
- Anish Chemicals - Key offerings
- 12.6 Arihant Chemical
- Arihant Chemical - Overview
- Arihant Chemical - Product / Service
- Arihant Chemical - Key offerings
- 12.7 Jagannath Chemicals
- Jagannath Chemicals - Overview
- Jagannath Chemicals - Product / Service
- Jagannath Chemicals - Key offerings
- 12.8 Otsuka Chemical Co. Ltd.
- Otsuka Chemical Co. Ltd. - Overview
- Otsuka Chemical Co. Ltd. - Product / Service
- Otsuka Chemical Co. Ltd. - Key offerings
- 12.9 Otto Chemie Pvt. Ltd.
- Otto Chemie Pvt. Ltd. - Overview
- Otto Chemie Pvt. Ltd. - Product / Service
- Otto Chemie Pvt. Ltd. - Key offerings
- 12.10 Penta s.r.o
- Penta s.r.o - Overview
- Penta s.r.o - Product / Service
- Penta s.r.o - Key offerings
- 12.11 SNDB
- SNDB - Overview
- SNDB - Product / Service
- SNDB - Key offerings
- 12.12 Spectrum Laboratory Products Inc.
- Spectrum Laboratory Products Inc. - Overview
- Spectrum Laboratory Products Inc. - Product / Service
- Spectrum Laboratory Products Inc. - Key news
- Spectrum Laboratory Products Inc. - Key offerings
- 12.13 SQM S.A.
- SQM S.A. - Overview
- SQM S.A. - Business segments
- SQM S.A. - Key news
- SQM S.A. - Key offerings
- SQM S.A. - Segment focus
- 12.14 Vizag Chemical International
- Vizag Chemical International - Overview
- Vizag Chemical International - Product / Service
- Vizag Chemical International - Key offerings
- 12.15 Wentong Potassium Salt Group Co. Ltd.
- Wentong Potassium Salt Group Co. Ltd. - Overview
- Wentong Potassium Salt Group Co. Ltd. - Product / Service
- Wentong Potassium Salt Group Co. Ltd. - Key offerings
- 12.16 Yara International ASA
- Yara International ASA - Overview
- Yara International ASA - Business segments
- Yara International ASA - Key offerings
- Yara International ASA - Segment focus
- 12.17 Yogi Dye Chem Industries
- Yogi Dye Chem Industries - Overview
- Yogi Dye Chem Industries - Product / Service
- Yogi Dye Chem Industries - Key offerings
13 Appendix
- 13.1 Scope of the report
- 13.2 Inclusions and exclusions checklist
- Inclusions checklist
- Exclusions checklist
- 13.3 Currency conversion rates for US$
- Currency conversion rates for US$
- 13.4 Research methodology
- Research methodology
- 13.5 Data procurement
- Information sources
- 13.6 Data validation
- Data validation
- 13.7 Validation techniques employed for market sizing
- Validation techniques employed for market sizing
- 13.8 Data synthesis
- Data synthesis
- 13.9 360 degree market analysis
- 360 degree market analysis
- 13.10 List of abbreviations
- List of abbreviations
