|
|
市場調査レポート
商品コード
1908304
発電用地熱掘削の世界市場、2026年~2030年Global Geothermal Drilling For Power Generation Market 2026-2030 |
||||||

|
|||||||
カスタマイズ可能
|
|||||||

| 発電用地熱掘削の世界市場、2026年~2030年 |
|
出版日: 2026年01月14日
発行: TechNavio
ページ情報: 英文 286 Pages
納期: 即納可能
|

概要
世界の発電用地熱掘削市場は、2025年から2030年の間に2億4,350万米ドルの成長が見込まれ、予測期間中のCAGRは4.5%と予測されています。
本報告書では、世界の発電用地熱掘削市場に関する包括的な分析、市場規模と予測、動向、成長要因、課題に加え、約25社のベンダー分析を提供しています。
本レポートは、現在の市場状況、最新の動向と促進要因、市場環境全般に関する最新の分析を提供します。市場は、世界の脱炭素化の要請とベースロード電力の必要性、地下工学および強化地熱システム(EGS)における技術革新、石油・ガス分野の専門知識とインフラの戦略的統合によって牽引されています。
本調査は、業界の主要関係者からの情報を含む、一次情報と二次情報の客観的な組み合わせを用いて実施されました。本レポートには、主要企業の分析に加え、包括的な市場規模データ、地域別分析を伴うセグメント、ベンダー情勢が含まれています。レポートには過去データと予測データが掲載されています。
| 市場範囲 | |
|---|---|
| 基準年 | 2026年 |
| 終了年 | 2030年 |
| 予測期間 | 2026年~2030年 |
| 成長モメンタム | 加速 |
| 前年比2026年 | 4.3% |
| CAGR | 4.5% |
| 増分額 | 2億4,350万米ドル |
本調査では、高温耐性材料と次世代センサーの統合が、今後数年間における世界の発電用地熱掘削市場成長の主要な促進要因の一つであると特定しています。また、炭化水素部門との業界横断的な技術融合、ならびにミリ波および非機械的掘削技術の導入が、市場において相当な需要を生み出すものと見込まれます。
目次
第1章 エグゼクティブサマリー
第2章 Technavio分析
- 価格反応性・ライフサイクル・顧客購入バスケット・採用率・購入基準の分析
- インプットの重要性と差別化の要因
- 混乱の要因
- 促進要因と課題の影響
第3章 市場情勢
- 市場エコシステム
- 市場の特徴
- バリューチェーン分析
第4章 市場規模
- 市場の定義
- 市場セグメント分析
- 市場規模、2025年
- 市場の見通し、2025年~2030年
第5章 市場規模実績
- 世界の発電用地熱掘削市場、2020年~2024年
- 用途別セグメント分析、2020年~2024年
- エリアセグメント分析、2020年~2024年
- タイプセグメント分析、2020年~2024年
- 地域別セグメント分析、2020年~2024年
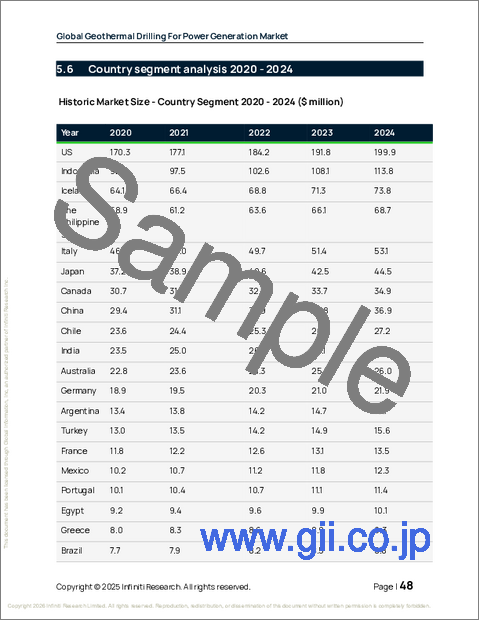
- 国別セグメント分析、2020年~2024年
第6章 定性分析
- AIの影響:世界の発電用地熱掘削市場
第7章 ファイブフォース分析
- ファイブフォースの要約
- 買い手の交渉力
- 供給企業の交渉力
- 新規参入業者の脅威
- 代替品の脅威
- 競争の脅威
- 市況
第8章 市場セグメンテーション:用途別
- 比較:用途別
- バイナリープラント
- 蒸気プラント
- 市場機会:用途別
第9章 市場セグメンテーション:エリア別
- 比較:エリア別
- 1000m未満
- 1000-2000m
- 市場機会:エリア別
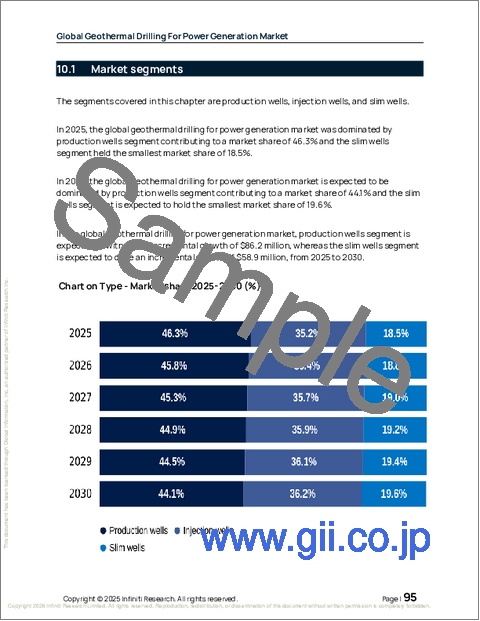
第10章 市場セグメンテーション:タイプ別
- 比較:タイプ別
- 生産井
- 注入井
- スリム井
- 市場機会:タイプ別
第11章 顧客情勢
第12章 地域別情勢
- 地域別セグメンテーション
- 地域別比較
- アジア太平洋地域
- インドネシア
- フィリピン
- 日本
- 中国
- インド
- オーストラリア
- 北米
- 米国
- カナダ
- メキシコ
- 欧州
- アイスランド
- イタリア
- ドイツ
- フランス
- ポルトガル
- ギリシャ
- 南米
- チリ
- アルゼンチン
- アルゼンチン
- 中東・アフリカ
- トルコ
- エジプト
- ケニア
- エチオピア
- サウジアラビア
- 市場機会:地域別
第13章 促進要因、課題、機会
- 市場促進要因
- 市場の課題
- 促進要因と課題の影響
- 市場機会
第14章 競合情勢
- 概要
- 競合情勢
- 混乱の状況
- 業界のリスク
第15章 競合分析
- 企業プロファイル
- 企業ランキング指標
- 企業の市場ポジショニング
- Baker Hughes Co.
- Deep Rock Manufacturing Co.
- Fraste Spa
- GA Drilling AS
- Geotech Drilling Services Ltd.
- Gill Rock Drill Co. Inc.
- Halliburton Co.
- Huisman Equipment BV
- Marton Geotechnical Services Ltd
- Ormat Technologies Inc.
- PT Pertamina Persero
- Quaise Energy Inc.
- Schlumberger Ltd.
- SIMCO Drilling Equipment Inc.
- Versa Drill

