|
|
市場調査レポート
商品コード
1714110
温室園芸の世界市場 2025-2029年Global Greenhouse Horticulture Market 2025-2029 |
||||||

|
|||||||
カスタマイズ可能
|
|||||||


| 温室園芸の世界市場 2025-2029年 |
|
出版日: 2025年04月12日
発行: TechNavio
ページ情報: 英文 222 Pages
納期: 即納可能
|

全表示
- 概要
- 図表
- 目次
温室園芸市場は2024-2029年に129億4,610万米ドル、予測期間中のCAGRは7.9%で成長すると予測されます。
当レポートでは、温室園芸市場の全体的な分析、市場規模・予測、動向、成長促進要因、課題、約25のベンダーを網羅したベンダー分析などを掲載しています。
現在の市場シナリオ、最新動向と促進要因、市場環境全体に関する最新分析を提供しています。園芸生産を牽引する都市需要の増加、新興経済諸国における温室園芸への政府支援、温室用CO2抽出技術の向上などが市場を牽引しています。
| 市場範囲 | |
|---|---|
| 基準年 | 2025年 |
| 終了年 | 2029年 |
| 予測期間 | 2025-2029年 |
| 成長モメンタム | 加速 |
| 前年比2025年 | 7.2% |
| CAGR | 7.9% |
| 増分額 | 129億4,610万米ドル |
本調査は、業界の主要参加者からのインプットを含め、一次情報と二次情報を客観的に組み合わせて実施しました。本レポートには、主要企業の分析に加え、包括的な市場規模データ、地域分析によるセグメント、ベンダー情勢が含まれています。レポートには過去データと予測データがあります。
この調査レポートは、今後数年間の温室園芸市場の成長を促進する主な要因の1つとして、温室園芸におけるLED成長ライトの関連性の高まりを挙げています。また、温室内の保温用資材の改良、温室園芸新興企業への技術革新と投資が、市場の大きな需要につながります。
目次
第1章 エグゼクティブサマリー
- 市場概要
第2章 Technavio分析
- 価格・ライフサイクル・顧客購入バスケット・採用率・購入基準の分析
- インプットの重要性と差別化の要因
- 混乱の要因
- 促進要因と課題の影響
第3章 市場情勢
- 市場エコシステム
- 市場の特徴
- バリューチェーン分析
第4章 市場規模
- 市場の定義
- 市場セグメント分析
- 市場規模 2024年
- 市場の見通し 2024-2029年
第5章 市場規模実績
- 温室園芸の世界市場 2019-2023年
- 製品セグメント分析 2019-2023年
- 作物タイプセグメント分析 2019-2023年
- 技術セグメント分析 2019-2023年
- 地域別セグメント分析 2019-2023年
- 国別セグメント分析 2019-2023年
第6章 定性分析
- AIの影響:温室園芸の世界市場
第7章 ファイブフォース分析
- ファイブフォースの要約
- 買い手の交渉力
- 供給企業の交渉力
- 新規参入業者の脅威
- 代替品の脅威
- 競争の脅威
- 市況
第8章 市場セグメンテーション:製品別
- 市場セグメント
- 比較:製品別
- プラスチック:市場規模と予測 2024-2029年
- ガラス:市場規模と予測 2024-2029年
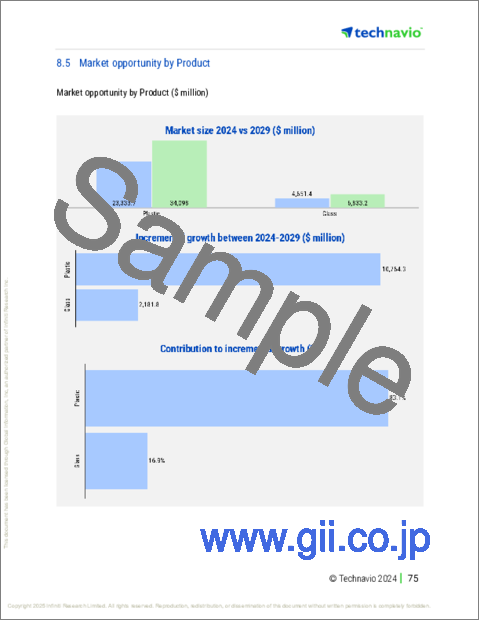
- 市場機会:製品別
第9章 市場セグメンテーション:作物タイプ別
- 市場セグメント
- 比較:作物タイプ別
- 果物と野菜:市場規模と予測 2024-2029年
- 苗木:市場規模と予測 2024-2029年
- 花と観賞植物:市場規模と予測 2024-2029年
- その他:市場規模と予測 2024-2029年
- 市場機会:作物タイプ別
第10章 市場セグメンテーション:技術別
- 市場セグメント
- 比較:技術別
- 水耕栽培:市場規模と予測 2024-2029年
- エアロポニックス:市場規模と予測 2024-2029年
- アクアポニックス:市場規模と予測 2024-2029年
- 垂直農法:市場規模と予測 2024-2029年
- その他:市場規模と予測 2024-2029年
- 市場機会:技術別
第11章 顧客情勢
- 顧客情勢の概要
第12章 地域別情勢
- 地域別セグメンテーション
- 比較:地域別
- 欧州:市場規模と予測 2024-2029年
- 北米:市場規模と予測 2024-2029年
- アジア太平洋:市場規模と予測 2024-2029年
- 中東・アフリカ:市場規模と予測 2024-2029年
- 南米:市場規模と予測 2024-2029年
- オランダ:市場規模と予測 2024-2029年
- 米国:市場規模と予測 2024-2029年
- スペイン:市場規模と予測 2024-2029年
- ドイツ:市場規模と予測 2024-2029年
- イタリア:市場規模と予測 2024-2029年
- 中国:市場規模と予測 2024-2029年
- フランス:市場規模と予測 2024-2029年
- インド:市場規模と予測 2024-2029年
- カナダ:市場規模と予測 2024-2029年
- 英国:市場規模と予測 2024-2029年
- 市場機会:地域情勢別
第13章 促進要因・課題・機会・抑制要因
- 市場促進要因
- 市場の課題
- 促進要因と課題の影響
- 市場の機会・抑制要因
第14章 競合情勢
- 概要
- 競合情勢
- 混乱の状況
- 業界のリスク
第15章 競合分析
- 企業プロファイル
- 企業ランキング指数
- 企業の市場ポジショニング
- Asian Perlite Industries Sdn Bhd
- Batenburg Techniek NV
- Ceres Greenhouse Solutions
- Certhon Build B.V.
- Dalsem Greenhouse Projects BV
- Europrogress Srl
- Industries Harnois Inc.
- Netafim Ltd.
- Novavert GmbH and Co. KG.
- Priva Holding BV
- Prospiant Inc.
- Richel Group SAS
- Ridder Drive Systems BV
- Top Greenhouses Ltd.
- Van der Hoeven Horticultural Projects BV
第16章 付録
Exhibits:
- Exhibits1: Executive Summary - Chart on Market Overview
- Exhibits2: Executive Summary - Data Table on Market Overview
- Exhibits3: Executive Summary - Chart on Global Market Characteristics
- Exhibits4: Executive Summary - Chart on Market By Geographical Landscape
- Exhibits5: Executive Summary - Chart on Market Segmentation by Product
- Exhibits6: Executive Summary - Chart on Market Segmentation by Crop Type
- Exhibits7: Executive Summary - Chart on Market Segmentation by Technology
- Exhibits8: Executive Summary - Chart on Incremental Growth
- Exhibits9: Executive Summary - Data Table on Incremental Growth
- Exhibits10: Executive Summary - Chart on Company Market Positioning
- Exhibits11: Analysis of price sensitivity, lifecycle, customer purchase basket, adoption rates, and purchase criteria
- Exhibits12: Overview on criticality of inputs and factors of differentiation
- Exhibits13: Overview on factors of disruption
- Exhibits14: Impact of drivers and challenges in 2024 and 2029
- Exhibits15: Parent Market
- Exhibits16: Data Table on - Parent Market
- Exhibits17: Market characteristics analysis
- Exhibits18: Value chain analysis
- Exhibits19: Offerings of companies included in the market definition
- Exhibits20: Market segments
- Exhibits21: Chart on Global - Market size and forecast 2024-2029 ($ million)
- Exhibits22: Data Table on Global - Market size and forecast 2024-2029 ($ million)
- Exhibits23: Chart on Global Market: Year-over-year growth 2024-2029 (%)
- Exhibits24: Data Table on Global Market: Year-over-year growth 2024-2029 (%)
- Exhibits25: Historic Market Size - Data Table on Global Greenhouse Horticulture Market 2019 - 2023 ($ million)
- Exhibits26: Historic Market Size - Product Segment 2019 - 2023 ($ million)
- Exhibits27: Historic Market Size - Crop Type Segment 2019 - 2023 ($ million)
- Exhibits28: Historic Market Size - Technology Segment 2019 - 2023 ($ million)
- Exhibits29: Historic Market Size - Geography Segment 2019 - 2023 ($ million)
- Exhibits30: Historic Market Size - Country Segment 2019 - 2023 ($ million)
- Exhibits31: Five forces analysis - Comparison between 2024 and 2029
- Exhibits32: Bargaining power of buyers - Impact of key factors 2024 and 2029
- Exhibits33: Bargaining power of suppliers - Impact of key factors in 2024 and 2029
- Exhibits34: Threat of new entrants - Impact of key factors in 2024 and 2029
- Exhibits35: Threat of substitutes - Impact of key factors in 2024 and 2029
- Exhibits36: Threat of rivalry - Impact of key factors in 2024 and 2029
- Exhibits37: Chart on Market condition - Five forces 2024 and 2029
- Exhibits38: Chart on Product - Market share 2024-2029 (%)
- Exhibits39: Data Table on Product - Market share 2024-2029 (%)
- Exhibits40: Chart on Comparison by Product
- Exhibits41: Data Table on Comparison by Product
- Exhibits42: Chart on Plastic - Market size and forecast 2024-2029 ($ million)
- Exhibits43: Data Table on Plastic - Market size and forecast 2024-2029 ($ million)
- Exhibits44: Chart on Plastic - Year-over-year growth 2024-2029 (%)
- Exhibits45: Data Table on Plastic - Year-over-year growth 2024-2029 (%)
- Exhibits46: Chart on Glass - Market size and forecast 2024-2029 ($ million)
- Exhibits47: Data Table on Glass - Market size and forecast 2024-2029 ($ million)
- Exhibits48: Chart on Glass - Year-over-year growth 2024-2029 (%)
- Exhibits49: Data Table on Glass - Year-over-year growth 2024-2029 (%)
- Exhibits50: Market opportunity by Product ($ million)
- Exhibits51: Data Table on Market opportunity by Product ($ million)
- Exhibits52: Chart on Crop Type - Market share 2024-2029 (%)
- Exhibits53: Data Table on Crop Type - Market share 2024-2029 (%)
- Exhibits54: Chart on Comparison by Crop Type
- Exhibits55: Data Table on Comparison by Crop Type
- Exhibits56: Chart on Fruits and vegetables - Market size and forecast 2024-2029 ($ million)
- Exhibits57: Data Table on Fruits and vegetables - Market size and forecast 2024-2029 ($ million)
- Exhibits58: Chart on Fruits and vegetables - Year-over-year growth 2024-2029 (%)
- Exhibits59: Data Table on Fruits and vegetables - Year-over-year growth 2024-2029 (%)
- Exhibits60: Chart on Nursery crops - Market size and forecast 2024-2029 ($ million)
- Exhibits61: Data Table on Nursery crops - Market size and forecast 2024-2029 ($ million)
- Exhibits62: Chart on Nursery crops - Year-over-year growth 2024-2029 (%)
- Exhibits63: Data Table on Nursery crops - Year-over-year growth 2024-2029 (%)
- Exhibits64: Chart on Flowers and ornamentals - Market size and forecast 2024-2029 ($ million)
- Exhibits65: Data Table on Flowers and ornamentals - Market size and forecast 2024-2029 ($ million)
- Exhibits66: Chart on Flowers and ornamentals - Year-over-year growth 2024-2029 (%)
- Exhibits67: Data Table on Flowers and ornamentals - Year-over-year growth 2024-2029 (%)
- Exhibits68: Chart on Others - Market size and forecast 2024-2029 ($ million)
- Exhibits69: Data Table on Others - Market size and forecast 2024-2029 ($ million)
- Exhibits70: Chart on Others - Year-over-year growth 2024-2029 (%)
- Exhibits71: Data Table on Others - Year-over-year growth 2024-2029 (%)
- Exhibits72: Market opportunity by Crop Type ($ million)
- Exhibits73: Data Table on Market opportunity by Crop Type ($ million)
- Exhibits74: Chart on Technology - Market share 2024-2029 (%)
- Exhibits75: Data Table on Technology - Market share 2024-2029 (%)
- Exhibits76: Chart on Comparison by Technology
- Exhibits77: Data Table on Comparison by Technology
- Exhibits78: Chart on Hydroponics - Market size and forecast 2024-2029 ($ million)
- Exhibits79: Data Table on Hydroponics - Market size and forecast 2024-2029 ($ million)
- Exhibits80: Chart on Hydroponics - Year-over-year growth 2024-2029 (%)
- Exhibits81: Data Table on Hydroponics - Year-over-year growth 2024-2029 (%)
- Exhibits82: Chart on Aeroponics - Market size and forecast 2024-2029 ($ million)
- Exhibits83: Data Table on Aeroponics - Market size and forecast 2024-2029 ($ million)
- Exhibits84: Chart on Aeroponics - Year-over-year growth 2024-2029 (%)
- Exhibits85: Data Table on Aeroponics - Year-over-year growth 2024-2029 (%)
- Exhibits86: Chart on Aquaponics - Market size and forecast 2024-2029 ($ million)
- Exhibits87: Data Table on Aquaponics - Market size and forecast 2024-2029 ($ million)
- Exhibits88: Chart on Aquaponics - Year-over-year growth 2024-2029 (%)
- Exhibits89: Data Table on Aquaponics - Year-over-year growth 2024-2029 (%)
- Exhibits90: Chart on Vertical farming - Market size and forecast 2024-2029 ($ million)
- Exhibits91: Data Table on Vertical farming - Market size and forecast 2024-2029 ($ million)
- Exhibits92: Chart on Vertical farming - Year-over-year growth 2024-2029 (%)
- Exhibits93: Data Table on Vertical farming - Year-over-year growth 2024-2029 (%)
- Exhibits94: Chart on Others - Market size and forecast 2024-2029 ($ million)
- Exhibits95: Data Table on Others - Market size and forecast 2024-2029 ($ million)
- Exhibits96: Chart on Others - Year-over-year growth 2024-2029 (%)
- Exhibits97: Data Table on Others - Year-over-year growth 2024-2029 (%)
- Exhibits98: Market opportunity by Technology ($ million)
- Exhibits99: Data Table on Market opportunity by Technology ($ million)
- Exhibits100: Analysis of price sensitivity, lifecycle, customer purchase basket, adoption rates, and purchase criteria
- Exhibits101: Chart on Market share By Geographical Landscape 2024-2029 (%)
- Exhibits102: Data Table on Market share By Geographical Landscape 2024-2029 (%)
- Exhibits103: Chart on Geographic comparison
- Exhibits104: Data Table on Geographic comparison
- Exhibits105: Chart on Europe - Market size and forecast 2024-2029 ($ million)
- Exhibits106: Data Table on Europe - Market size and forecast 2024-2029 ($ million)
- Exhibits107: Chart on Europe - Year-over-year growth 2024-2029 (%)
- Exhibits108: Data Table on Europe - Year-over-year growth 2024-2029 (%)
- Exhibits109: Chart on North America - Market size and forecast 2024-2029 ($ million)
- Exhibits110: Data Table on North America - Market size and forecast 2024-2029 ($ million)
- Exhibits111: Chart on North America - Year-over-year growth 2024-2029 (%)
- Exhibits112: Data Table on North America - Year-over-year growth 2024-2029 (%)
- Exhibits113: Chart on APAC - Market size and forecast 2024-2029 ($ million)
- Exhibits114: Data Table on APAC - Market size and forecast 2024-2029 ($ million)
- Exhibits115: Chart on APAC - Year-over-year growth 2024-2029 (%)
- Exhibits116: Data Table on APAC - Year-over-year growth 2024-2029 (%)
- Exhibits117: Chart on Middle East and Africa - Market size and forecast 2024-2029 ($ million)
- Exhibits118: Data Table on Middle East and Africa - Market size and forecast 2024-2029 ($ million)
- Exhibits119: Chart on Middle East and Africa - Year-over-year growth 2024-2029 (%)
- Exhibits120: Data Table on Middle East and Africa - Year-over-year growth 2024-2029 (%)
- Exhibits121: Chart on South America - Market size and forecast 2024-2029 ($ million)
- Exhibits122: Data Table on South America - Market size and forecast 2024-2029 ($ million)
- Exhibits123: Chart on South America - Year-over-year growth 2024-2029 (%)
- Exhibits124: Data Table on South America - Year-over-year growth 2024-2029 (%)
- Exhibits125: Chart on The Netherlands - Market size and forecast 2024-2029 ($ million)
- Exhibits126: Data Table on The Netherlands - Market size and forecast 2024-2029 ($ million)
- Exhibits127: Chart on The Netherlands - Year-over-year growth 2024-2029 (%)
- Exhibits128: Data Table on The Netherlands - Year-over-year growth 2024-2029 (%)
- Exhibits129: Chart on US - Market size and forecast 2024-2029 ($ million)
- Exhibits130: Data Table on US - Market size and forecast 2024-2029 ($ million)
- Exhibits131: Chart on US - Year-over-year growth 2024-2029 (%)
- Exhibits132: Data Table on US - Year-over-year growth 2024-2029 (%)
- Exhibits133: Chart on Spain - Market size and forecast 2024-2029 ($ million)
- Exhibits134: Data Table on Spain - Market size and forecast 2024-2029 ($ million)
- Exhibits135: Chart on Spain - Year-over-year growth 2024-2029 (%)
- Exhibits136: Data Table on Spain - Year-over-year growth 2024-2029 (%)
- Exhibits137: Chart on Germany - Market size and forecast 2024-2029 ($ million)
- Exhibits138: Data Table on Germany - Market size and forecast 2024-2029 ($ million)
- Exhibits139: Chart on Germany - Year-over-year growth 2024-2029 (%)
- Exhibits140: Data Table on Germany - Year-over-year growth 2024-2029 (%)
- Exhibits141: Chart on Italy - Market size and forecast 2024-2029 ($ million)
- Exhibits142: Data Table on Italy - Market size and forecast 2024-2029 ($ million)
- Exhibits143: Chart on Italy - Year-over-year growth 2024-2029 (%)
- Exhibits144: Data Table on Italy - Year-over-year growth 2024-2029 (%)
- Exhibits145: Chart on China - Market size and forecast 2024-2029 ($ million)
- Exhibits146: Data Table on China - Market size and forecast 2024-2029 ($ million)
- Exhibits147: Chart on China - Year-over-year growth 2024-2029 (%)
- Exhibits148: Data Table on China - Year-over-year growth 2024-2029 (%)
- Exhibits149: Chart on France - Market size and forecast 2024-2029 ($ million)
- Exhibits150: Data Table on France - Market size and forecast 2024-2029 ($ million)
- Exhibits151: Chart on France - Year-over-year growth 2024-2029 (%)
- Exhibits152: Data Table on France - Year-over-year growth 2024-2029 (%)
- Exhibits153: Chart on India - Market size and forecast 2024-2029 ($ million)
- Exhibits154: Data Table on India - Market size and forecast 2024-2029 ($ million)
- Exhibits155: Chart on India - Year-over-year growth 2024-2029 (%)
- Exhibits156: Data Table on India - Year-over-year growth 2024-2029 (%)
- Exhibits157: Chart on Canada - Market size and forecast 2024-2029 ($ million)
- Exhibits158: Data Table on Canada - Market size and forecast 2024-2029 ($ million)
- Exhibits159: Chart on Canada - Year-over-year growth 2024-2029 (%)
- Exhibits160: Data Table on Canada - Year-over-year growth 2024-2029 (%)
- Exhibits161: Chart on UK - Market size and forecast 2024-2029 ($ million)
- Exhibits162: Data Table on UK - Market size and forecast 2024-2029 ($ million)
- Exhibits163: Chart on UK - Year-over-year growth 2024-2029 (%)
- Exhibits164: Data Table on UK - Year-over-year growth 2024-2029 (%)
- Exhibits165: Market opportunity By Geographical Landscape ($ million)
- Exhibits166: Data Tables on Market opportunity By Geographical Landscape ($ million)
- Exhibits167: Impact of drivers and challenges in 2024 and 2029
- Exhibits168: Overview on criticality of inputs and factors of differentiation
- Exhibits169: Overview on factors of disruption
- Exhibits170: Impact of key risks on business
- Exhibits171: Companies covered
- Exhibits172: Company ranking index
- Exhibits173: Matrix on companies position and classification
- Exhibits174: Asian Perlite Industries Sdn Bhd - Overview
- Exhibits175: Asian Perlite Industries Sdn Bhd - Product / Service
- Exhibits176: Asian Perlite Industries Sdn Bhd - Key offerings
- Exhibits177: SWOT
- Exhibits178: Batenburg Techniek NV - Overview
- Exhibits179: Batenburg Techniek NV - Product / Service
- Exhibits180: Batenburg Techniek NV - Key offerings
- Exhibits181: SWOT
- Exhibits182: Ceres Greenhouse Solutions - Overview
- Exhibits183: Ceres Greenhouse Solutions - Product / Service
- Exhibits184: Ceres Greenhouse Solutions - Key offerings
- Exhibits185: SWOT
- Exhibits186: Certhon Build B.V. - Overview
- Exhibits187: Certhon Build B.V. - Product / Service
- Exhibits188: Certhon Build B.V. - Key offerings
- Exhibits189: SWOT
- Exhibits190: Dalsem Greenhouse Projects BV - Overview
- Exhibits191: Dalsem Greenhouse Projects BV - Product / Service
- Exhibits192: Dalsem Greenhouse Projects BV - Key offerings
- Exhibits193: SWOT
- Exhibits194: Europrogress Srl - Overview
- Exhibits195: Europrogress Srl - Product / Service
- Exhibits196: Europrogress Srl - Key offerings
- Exhibits197: SWOT
- Exhibits198: Industries Harnois Inc. - Overview
- Exhibits199: Industries Harnois Inc. - Product / Service
- Exhibits200: Industries Harnois Inc. - Key offerings
- Exhibits201: SWOT
- Exhibits202: Netafim Ltd. - Overview
- Exhibits203: Netafim Ltd. - Product / Service
- Exhibits204: Netafim Ltd. - Key offerings
- Exhibits205: SWOT
- Exhibits206: Novavert GmbH and Co. KG. - Overview
- Exhibits207: Novavert GmbH and Co. KG. - Product / Service
- Exhibits208: Novavert GmbH and Co. KG. - Key offerings
- Exhibits209: SWOT
- Exhibits210: Priva Holding BV - Overview
- Exhibits211: Priva Holding BV - Product / Service
- Exhibits212: Priva Holding BV - Key offerings
- Exhibits213: SWOT
- Exhibits214: Prospiant Inc. - Overview
- Exhibits215: Prospiant Inc. - Product / Service
- Exhibits216: Prospiant Inc. - Key offerings
- Exhibits217: SWOT
- Exhibits218: Richel Group SAS - Overview
- Exhibits219: Richel Group SAS - Product / Service
- Exhibits220: Richel Group SAS - Key offerings
- Exhibits221: SWOT
- Exhibits222: Ridder Drive Systems BV - Overview
- Exhibits223: Ridder Drive Systems BV - Product / Service
- Exhibits224: Ridder Drive Systems BV - Key offerings
- Exhibits225: SWOT
- Exhibits226: Top Greenhouses Ltd. - Overview
- Exhibits227: Top Greenhouses Ltd. - Product / Service
- Exhibits228: Top Greenhouses Ltd. - Key offerings
- Exhibits229: SWOT
- Exhibits230: Van der Hoeven Horticultural Projects BV - Overview
- Exhibits231: Van der Hoeven Horticultural Projects BV - Product / Service
- Exhibits232: Van der Hoeven Horticultural Projects BV - Key offerings
- Exhibits233: SWOT
- Exhibits234: Inclusions checklist
- Exhibits235: Exclusions checklist
- Exhibits236: Currency conversion rates for US$
- Exhibits237: Research methodology
- Exhibits238: Information sources
- Exhibits239: Data validation
- Exhibits240: Validation techniques employed for market sizing
- Exhibits241: Data synthesis
- Exhibits242: 360 degree market analysis
- Exhibits243: List of abbreviations
The greenhouse horticulture market is forecasted to grow by USD 12946.1 mn during 2024-2029, accelerating at a CAGR of 7.9% during the forecast period. The report on the greenhouse horticulture market provides a holistic analysis, market size and forecast, trends, growth drivers, and challenges, as well as vendor analysis covering around 25 vendors.
The report offers an up-to-date analysis regarding the current market scenario, the latest trends and drivers, and the overall market environment. The market is driven by increased urban demand driving horticultural production, government support for greenhouse horticulture in developing economies, and improvements in co2 extraction technologies for greenhouses.
| Market Scope | |
|---|---|
| Base Year | 2025 |
| End Year | 2029 |
| Series Year | 2025-2029 |
| Growth Momentum | Accelerate |
| YOY 2025 | 7.2% |
| CAGR | 7.9% |
| Incremental Value | $12946.1 mn |
The study was conducted using an objective combination of primary and secondary information including inputs from key participants in the industry. The report contains a comprehensive market size data, segment with regional analysis and vendor landscape in addition to an analysis of the key companies. Reports have historic and forecast data.
Technavio's greenhouse horticulture market is segmented as below:
By Product
- Plastic
- Glass
By Crop Type
- Fruits and vegetables
- Nursery crops
- Flowers and ornamentals
- Others
By Technology
- Hydroponics
- Aeroponics
- Aquaponics
- Vertical farming
- Others
By Geographical Landscape
- Europe
- North America
- APAC
- Middle East and Africa
- South America
This study identifies the increasing relevance of led growth lights in greenhouse horticulture as one of the prime reasons driving the greenhouse horticulture market growth during the next few years. Also, improvement in materials for retaining heat in greenhouses and innovation and investments in greenhouse horticulture startups will lead to sizable demand in the market.
The report on the greenhouse horticulture market covers the following areas:
- Greenhouse Horticulture Market sizing
- Greenhouse Horticulture Market forecast
- Greenhouse Horticulture Market industry analysis
The robust vendor analysis is designed to help clients improve their market position, and in line with this, this report provides a detailed analysis of several leading greenhouse horticulture market vendors that include Asian Perlite Industries Sdn Bhd, Batenburg Techniek NV, Beijing Kingpeng International Hi-tech Corp., Ceres Greenhouse Solutions, Certhon Build B.V., CMF Groupe, Dalsem Greenhouse Projects BV, Europrogress Srl, Industries Harnois Inc., IsraelAgri, Netafim Ltd., Novavert GmbH and Co. KG., Prasada Xiamen Agricultural Engineering Co. Ltd., Priva Holding BV, Prospiant Inc., Richel Group SAS, Ridder Drive Systems BV, Top Greenhouses Ltd., and Van der Hoeven Horticultural Projects BV. Also, the greenhouse horticulture market analysis report includes information on upcoming trends and challenges that will influence market growth. This is to help companies strategize and leverage all forthcoming growth opportunities.
The publisher presents a detailed picture of the market by the way of study, synthesis, and summation of data from multiple sources by an analysis of key parameters such as profit, pricing, competition, and promotions. It presents various market facets by identifying the key industry influencers. The data presented is comprehensive, reliable, and a result of extensive primary and secondary research. The market research reports provide a complete competitive landscape and an in-depth vendor selection methodology and analysis using qualitative and quantitative research to forecast accurate market growth.
Table of Contents
1 Executive Summary
- 1.1 Market overview
- Executive Summary - Chart on Market Overview
- Executive Summary - Data Table on Market Overview
- Executive Summary - Chart on Global Market Characteristics
- Executive Summary - Chart on Market By Geographical Landscape
- Executive Summary - Chart on Market Segmentation by Product
- Executive Summary - Chart on Market Segmentation by Crop Type
- Executive Summary - Chart on Market Segmentation by Technology
- Executive Summary - Chart on Incremental Growth
- Executive Summary - Data Table on Incremental Growth
- Executive Summary - Chart on Company Market Positioning
2 Technavio Analysis
- 2.1 Analysis of price sensitivity, lifecycle, customer purchase basket, adoption rates, and purchase criteria
- Analysis of price sensitivity, lifecycle, customer purchase basket, adoption rates, and purchase criteria
- 2.2 Criticality of inputs and Factors of differentiation
- Overview on criticality of inputs and factors of differentiation
- 2.3 Factors of disruption
- Overview on factors of disruption
- 2.4 Impact of drivers and challenges
- Impact of drivers and challenges in 2024 and 2029
3 Market Landscape
- 3.1 Market ecosystem
- Parent Market
- Data Table on - Parent Market
- 3.2 Market characteristics
- Market characteristics analysis
- 3.3 Value chain analysis
- Value chain analysis
4 Market Sizing
- 4.1 Market definition
- Offerings of companies included in the market definition
- 4.2 Market segment analysis
- Market segments
- 4.3 Market size 2024
- 4.4 Market outlook: Forecast for 2024-2029
- Chart on Global - Market size and forecast 2024-2029 ($ million)
- Data Table on Global - Market size and forecast 2024-2029 ($ million)
- Chart on Global Market: Year-over-year growth 2024-2029 (%)
- Data Table on Global Market: Year-over-year growth 2024-2029 (%)
5 Historic Market Size
- 5.1 Global Greenhouse Horticulture Market 2019 - 2023
- Historic Market Size - Data Table on Global Greenhouse Horticulture Market 2019 - 2023 ($ million)
- 5.2 Product segment analysis 2019 - 2023
- Historic Market Size - Product Segment 2019 - 2023 ($ million)
- 5.3 Crop Type segment analysis 2019 - 2023
- Historic Market Size - Crop Type Segment 2019 - 2023 ($ million)
- 5.4 Technology segment analysis 2019 - 2023
- Historic Market Size - Technology Segment 2019 - 2023 ($ million)
- 5.5 Geography segment analysis 2019 - 2023
- Historic Market Size - Geography Segment 2019 - 2023 ($ million)
- 5.6 Country segment analysis 2019 - 2023
- Historic Market Size - Country Segment 2019 - 2023 ($ million)
6 Qualitative Analysis
- 6.1 The AI impact on Global Greenhouse Horticulture Market
7 Five Forces Analysis
- 7.1 Five forces summary
- Five forces analysis - Comparison between 2024 and 2029
- 7.2 Bargaining power of buyers
- Bargaining power of buyers - Impact of key factors 2024 and 2029
- 7.3 Bargaining power of suppliers
- Bargaining power of suppliers - Impact of key factors in 2024 and 2029
- 7.4 Threat of new entrants
- Threat of new entrants - Impact of key factors in 2024 and 2029
- 7.5 Threat of substitutes
- Threat of substitutes - Impact of key factors in 2024 and 2029
- 7.6 Threat of rivalry
- Threat of rivalry - Impact of key factors in 2024 and 2029
- 7.7 Market condition
- Chart on Market condition - Five forces 2024 and 2029
8 Market Segmentation by Product
- 8.1 Market segments
- Chart on Product - Market share 2024-2029 (%)
- Data Table on Product - Market share 2024-2029 (%)
- 8.2 Comparison by Product
- Chart on Comparison by Product
- Data Table on Comparison by Product
- 8.3 Plastic - Market size and forecast 2024-2029
- Chart on Plastic - Market size and forecast 2024-2029 ($ million)
- Data Table on Plastic - Market size and forecast 2024-2029 ($ million)
- Chart on Plastic - Year-over-year growth 2024-2029 (%)
- Data Table on Plastic - Year-over-year growth 2024-2029 (%)
- 8.4 Glass - Market size and forecast 2024-2029
- Chart on Glass - Market size and forecast 2024-2029 ($ million)
- Data Table on Glass - Market size and forecast 2024-2029 ($ million)
- Chart on Glass - Year-over-year growth 2024-2029 (%)
- Data Table on Glass - Year-over-year growth 2024-2029 (%)
- 8.5 Market opportunity by Product
- Market opportunity by Product ($ million)
- Data Table on Market opportunity by Product ($ million)
9 Market Segmentation by Crop Type
- 9.1 Market segments
- Chart on Crop Type - Market share 2024-2029 (%)
- Data Table on Crop Type - Market share 2024-2029 (%)
- 9.2 Comparison by Crop Type
- Chart on Comparison by Crop Type
- Data Table on Comparison by Crop Type
- 9.3 Fruits and vegetables - Market size and forecast 2024-2029
- Chart on Fruits and vegetables - Market size and forecast 2024-2029 ($ million)
- Data Table on Fruits and vegetables - Market size and forecast 2024-2029 ($ million)
- Chart on Fruits and vegetables - Year-over-year growth 2024-2029 (%)
- Data Table on Fruits and vegetables - Year-over-year growth 2024-2029 (%)
- 9.4 Nursery crops - Market size and forecast 2024-2029
- Chart on Nursery crops - Market size and forecast 2024-2029 ($ million)
- Data Table on Nursery crops - Market size and forecast 2024-2029 ($ million)
- Chart on Nursery crops - Year-over-year growth 2024-2029 (%)
- Data Table on Nursery crops - Year-over-year growth 2024-2029 (%)
- 9.5 Flowers and ornamentals - Market size and forecast 2024-2029
- Chart on Flowers and ornamentals - Market size and forecast 2024-2029 ($ million)
- Data Table on Flowers and ornamentals - Market size and forecast 2024-2029 ($ million)
- Chart on Flowers and ornamentals - Year-over-year growth 2024-2029 (%)
- Data Table on Flowers and ornamentals - Year-over-year growth 2024-2029 (%)
- 9.6 Others - Market size and forecast 2024-2029
- Chart on Others - Market size and forecast 2024-2029 ($ million)
- Data Table on Others - Market size and forecast 2024-2029 ($ million)
- Chart on Others - Year-over-year growth 2024-2029 (%)
- Data Table on Others - Year-over-year growth 2024-2029 (%)
- 9.7 Market opportunity by Crop Type
- Market opportunity by Crop Type ($ million)
- Data Table on Market opportunity by Crop Type ($ million)
10 Market Segmentation by Technology
- 10.1 Market segments
- Chart on Technology - Market share 2024-2029 (%)
- Data Table on Technology - Market share 2024-2029 (%)
- 10.2 Comparison by Technology
- Chart on Comparison by Technology
- Data Table on Comparison by Technology
- 10.3 Hydroponics - Market size and forecast 2024-2029
- Chart on Hydroponics - Market size and forecast 2024-2029 ($ million)
- Data Table on Hydroponics - Market size and forecast 2024-2029 ($ million)
- Chart on Hydroponics - Year-over-year growth 2024-2029 (%)
- Data Table on Hydroponics - Year-over-year growth 2024-2029 (%)
- 10.4 Aeroponics - Market size and forecast 2024-2029
- Chart on Aeroponics - Market size and forecast 2024-2029 ($ million)
- Data Table on Aeroponics - Market size and forecast 2024-2029 ($ million)
- Chart on Aeroponics - Year-over-year growth 2024-2029 (%)
- Data Table on Aeroponics - Year-over-year growth 2024-2029 (%)
- 10.5 Aquaponics - Market size and forecast 2024-2029
- Chart on Aquaponics - Market size and forecast 2024-2029 ($ million)
- Data Table on Aquaponics - Market size and forecast 2024-2029 ($ million)
- Chart on Aquaponics - Year-over-year growth 2024-2029 (%)
- Data Table on Aquaponics - Year-over-year growth 2024-2029 (%)
- 10.6 Vertical farming - Market size and forecast 2024-2029
- Chart on Vertical farming - Market size and forecast 2024-2029 ($ million)
- Data Table on Vertical farming - Market size and forecast 2024-2029 ($ million)
- Chart on Vertical farming - Year-over-year growth 2024-2029 (%)
- Data Table on Vertical farming - Year-over-year growth 2024-2029 (%)
- 10.7 Others - Market size and forecast 2024-2029
- Chart on Others - Market size and forecast 2024-2029 ($ million)
- Data Table on Others - Market size and forecast 2024-2029 ($ million)
- Chart on Others - Year-over-year growth 2024-2029 (%)
- Data Table on Others - Year-over-year growth 2024-2029 (%)
- 10.8 Market opportunity by Technology
- Market opportunity by Technology ($ million)
- Data Table on Market opportunity by Technology ($ million)
11 Customer Landscape
- 11.1 Customer landscape overview
- Analysis of price sensitivity, lifecycle, customer purchase basket, adoption rates, and purchase criteria
12 Geographic Landscape
- 12.1 Geographic segmentation
- Chart on Market share By Geographical Landscape 2024-2029 (%)
- Data Table on Market share By Geographical Landscape 2024-2029 (%)
- 12.2 Geographic comparison
- Chart on Geographic comparison
- Data Table on Geographic comparison
- 12.3 Europe - Market size and forecast 2024-2029
- Chart on Europe - Market size and forecast 2024-2029 ($ million)
- Data Table on Europe - Market size and forecast 2024-2029 ($ million)
- Chart on Europe - Year-over-year growth 2024-2029 (%)
- Data Table on Europe - Year-over-year growth 2024-2029 (%)
- 12.4 North America - Market size and forecast 2024-2029
- Chart on North America - Market size and forecast 2024-2029 ($ million)
- Data Table on North America - Market size and forecast 2024-2029 ($ million)
- Chart on North America - Year-over-year growth 2024-2029 (%)
- Data Table on North America - Year-over-year growth 2024-2029 (%)
- 12.5 APAC - Market size and forecast 2024-2029
- Chart on APAC - Market size and forecast 2024-2029 ($ million)
- Data Table on APAC - Market size and forecast 2024-2029 ($ million)
- Chart on APAC - Year-over-year growth 2024-2029 (%)
- Data Table on APAC - Year-over-year growth 2024-2029 (%)
- 12.6 Middle East and Africa - Market size and forecast 2024-2029
- Chart on Middle East and Africa - Market size and forecast 2024-2029 ($ million)
- Data Table on Middle East and Africa - Market size and forecast 2024-2029 ($ million)
- Chart on Middle East and Africa - Year-over-year growth 2024-2029 (%)
- Data Table on Middle East and Africa - Year-over-year growth 2024-2029 (%)
- 12.7 South America - Market size and forecast 2024-2029
- Chart on South America - Market size and forecast 2024-2029 ($ million)
- Data Table on South America - Market size and forecast 2024-2029 ($ million)
- Chart on South America - Year-over-year growth 2024-2029 (%)
- Data Table on South America - Year-over-year growth 2024-2029 (%)
- 12.8 The Netherlands - Market size and forecast 2024-2029
- Chart on The Netherlands - Market size and forecast 2024-2029 ($ million)
- Data Table on The Netherlands - Market size and forecast 2024-2029 ($ million)
- Chart on The Netherlands - Year-over-year growth 2024-2029 (%)
- Data Table on The Netherlands - Year-over-year growth 2024-2029 (%)
- 12.9 US - Market size and forecast 2024-2029
- Chart on US - Market size and forecast 2024-2029 ($ million)
- Data Table on US - Market size and forecast 2024-2029 ($ million)
- Chart on US - Year-over-year growth 2024-2029 (%)
- Data Table on US - Year-over-year growth 2024-2029 (%)
- 12.10 Spain - Market size and forecast 2024-2029
- Chart on Spain - Market size and forecast 2024-2029 ($ million)
- Data Table on Spain - Market size and forecast 2024-2029 ($ million)
- Chart on Spain - Year-over-year growth 2024-2029 (%)
- Data Table on Spain - Year-over-year growth 2024-2029 (%)
- 12.11 Germany - Market size and forecast 2024-2029
- Chart on Germany - Market size and forecast 2024-2029 ($ million)
- Data Table on Germany - Market size and forecast 2024-2029 ($ million)
- Chart on Germany - Year-over-year growth 2024-2029 (%)
- Data Table on Germany - Year-over-year growth 2024-2029 (%)
- 12.12 Italy - Market size and forecast 2024-2029
- Chart on Italy - Market size and forecast 2024-2029 ($ million)
- Data Table on Italy - Market size and forecast 2024-2029 ($ million)
- Chart on Italy - Year-over-year growth 2024-2029 (%)
- Data Table on Italy - Year-over-year growth 2024-2029 (%)
- 12.13 China - Market size and forecast 2024-2029
- Chart on China - Market size and forecast 2024-2029 ($ million)
- Data Table on China - Market size and forecast 2024-2029 ($ million)
- Chart on China - Year-over-year growth 2024-2029 (%)
- Data Table on China - Year-over-year growth 2024-2029 (%)
- 12.14 France - Market size and forecast 2024-2029
- Chart on France - Market size and forecast 2024-2029 ($ million)
- Data Table on France - Market size and forecast 2024-2029 ($ million)
- Chart on France - Year-over-year growth 2024-2029 (%)
- Data Table on France - Year-over-year growth 2024-2029 (%)
- 12.15 India - Market size and forecast 2024-2029
- Chart on India - Market size and forecast 2024-2029 ($ million)
- Data Table on India - Market size and forecast 2024-2029 ($ million)
- Chart on India - Year-over-year growth 2024-2029 (%)
- Data Table on India - Year-over-year growth 2024-2029 (%)
- 12.16 Canada - Market size and forecast 2024-2029
- Chart on Canada - Market size and forecast 2024-2029 ($ million)
- Data Table on Canada - Market size and forecast 2024-2029 ($ million)
- Chart on Canada - Year-over-year growth 2024-2029 (%)
- Data Table on Canada - Year-over-year growth 2024-2029 (%)
- 12.17 UK - Market size and forecast 2024-2029
- Chart on UK - Market size and forecast 2024-2029 ($ million)
- Data Table on UK - Market size and forecast 2024-2029 ($ million)
- Chart on UK - Year-over-year growth 2024-2029 (%)
- Data Table on UK - Year-over-year growth 2024-2029 (%)
- 12.18 Market opportunity By Geographical Landscape
- Market opportunity By Geographical Landscape ($ million)
- Data Tables on Market opportunity By Geographical Landscape ($ million)
13 Drivers, Challenges, and Opportunity/Restraints
- 13.1 Market drivers
- 13.2 Market challenges
- 13.3 Impact of drivers and challenges
- Impact of drivers and challenges in 2024 and 2029
- 13.4 Market opportunities/restraints
14 Competitive Landscape
- 14.1 Overview
- 14.2 Competitive Landscape
- Overview on criticality of inputs and factors of differentiation
- 14.3 Landscape disruption
- Overview on factors of disruption
- 14.4 Industry risks
- Impact of key risks on business
15 Competitive Analysis
- 15.1 Companies profiled
- Companies covered
- 15.2 Company ranking index
- Company ranking index
- 15.3 Market positioning of companies
- Matrix on companies position and classification
- 15.4 Asian Perlite Industries Sdn Bhd
- Asian Perlite Industries Sdn Bhd - Overview
- Asian Perlite Industries Sdn Bhd - Product / Service
- Asian Perlite Industries Sdn Bhd - Key offerings
- SWOT
- 15.5 Batenburg Techniek NV
- Batenburg Techniek NV - Overview
- Batenburg Techniek NV - Product / Service
- Batenburg Techniek NV - Key offerings
- SWOT
- 15.6 Ceres Greenhouse Solutions
- Ceres Greenhouse Solutions - Overview
- Ceres Greenhouse Solutions - Product / Service
- Ceres Greenhouse Solutions - Key offerings
- SWOT
- 15.7 Certhon Build B.V.
- Certhon Build B.V. - Overview
- Certhon Build B.V. - Product / Service
- Certhon Build B.V. - Key offerings
- SWOT
- 15.8 Dalsem Greenhouse Projects BV
- Dalsem Greenhouse Projects BV - Overview
- Dalsem Greenhouse Projects BV - Product / Service
- Dalsem Greenhouse Projects BV - Key offerings
- SWOT
- 15.9 Europrogress Srl
- Europrogress Srl - Overview
- Europrogress Srl - Product / Service
- Europrogress Srl - Key offerings
- SWOT
- 15.10 Industries Harnois Inc.
- Industries Harnois Inc. - Overview
- Industries Harnois Inc. - Product / Service
- Industries Harnois Inc. - Key offerings
- SWOT
- 15.11 Netafim Ltd.
- Netafim Ltd. - Overview
- Netafim Ltd. - Product / Service
- Netafim Ltd. - Key offerings
- SWOT
- 15.12 Novavert GmbH and Co. KG.
- Novavert GmbH and Co. KG. - Overview
- Novavert GmbH and Co. KG. - Product / Service
- Novavert GmbH and Co. KG. - Key offerings
- SWOT
- 15.13 Priva Holding BV
- Priva Holding BV - Overview
- Priva Holding BV - Product / Service
- Priva Holding BV - Key offerings
- SWOT
- 15.14 Prospiant Inc.
- Prospiant Inc. - Overview
- Prospiant Inc. - Product / Service
- Prospiant Inc. - Key offerings
- SWOT
- 15.15 Richel Group SAS
- Richel Group SAS - Overview
- Richel Group SAS - Product / Service
- Richel Group SAS - Key offerings
- SWOT
- 15.16 Ridder Drive Systems BV
- Ridder Drive Systems BV - Overview
- Ridder Drive Systems BV - Product / Service
- Ridder Drive Systems BV - Key offerings
- SWOT
- 15.17 Top Greenhouses Ltd.
- Top Greenhouses Ltd. - Overview
- Top Greenhouses Ltd. - Product / Service
- Top Greenhouses Ltd. - Key offerings
- SWOT
- 15.18 Van der Hoeven Horticultural Projects BV
- Van der Hoeven Horticultural Projects BV - Overview
- Van der Hoeven Horticultural Projects BV - Product / Service
- Van der Hoeven Horticultural Projects BV - Key offerings
- SWOT
16 Appendix
- 16.1 Scope of the report
- 16.2 Inclusions and exclusions checklist
- Inclusions checklist
- Exclusions checklist
- 16.3 Currency conversion rates for US$
- Currency conversion rates for US$
- 16.4 Research methodology
- Research methodology
- 16.5 Data procurement
- Information sources
- 16.6 Data validation
- Data validation
- 16.7 Validation techniques employed for market sizing
- Validation techniques employed for market sizing
- 16.8 Data synthesis
- Data synthesis
- 16.9 360 degree market analysis
- 360 degree market analysis
- 16.10 List of abbreviations
- List of abbreviations

