|
|
市場調査レポート
商品コード
1645412
電子カルテの世界市場 (2025~2029年)Global Electronic Health Records Market 2025-2029 |
||||||

|
|||||||
カスタマイズ可能
|
|||||||

| 電子カルテの世界市場 (2025~2029年) |
|
出版日: 2025年01月11日
発行: TechNavio
ページ情報: 英文 197 Pages
納期: 即納可能
|

全表示
- 概要
- 図表
- 目次
電子カルテ(EHR)市場は2024~2029年に494億730万米ドル、予測期間中のCAGRは14.8%で成長すると予測されています。
この調査レポートは、電子カルテ市場の全体分析、市場規模・予測、動向、成長促進要因、課題、約25のベンダーを網羅したベンダー分析などを掲載しています。
現在の市場シナリオ、最新動向と促進要因、市場環境全体に関する最新分析を提供しています。市場は、EHR導入の増加につながるEHRのメリット、EHR導入を支援する政府の取り組み、ヘルスケア業界のデジタル化の進展などが牽引しています。
| 市場範囲 | |
|---|---|
| 基準年 | 2025年 |
| 終了年 | 2029年 |
| 予測期間 | 2025~2029年 |
| 成長モメンタム | 加速 |
| 前年比2025年 | 13.8% |
| CAGR | 14.8% |
| 増分額 | 494億730万米ドル |
本調査では、今後数年間の電子カルテ市場成長を牽引する主な要因の1つとして、セルフメディケーションと在宅ケア医療機器に対する需要の高まりを挙げています。また、コネクテッドデバイスや技術の利用が拡大し、ヘルスケア業界における統合が進むことで、同市場は大きな需要が見込まれます。
目次
第1章 エグゼクティブサマリー
- 市場概要
第2章 Technavioの分析
- 価格感度・ライフサイクル・顧客購入バスケット・採用率・購入基準の分析
- インプットの重要性と差別化の要因
- ディスラプションの要因
- 促進要因と課題の影響
第3章 市場情勢
- 市場エコシステム
- 市場の特徴
- バリューチェーン分析
第4章 市場規模
- 市場の定義
- 市場セグメント分析
- 市場規模 (2024年)
- 市場展望 (2024~2029年)
第5章 市場規模実績
- 電子カルテの世界市場 (2019~2023年)
- 展開別セグメント分析 (2019~2023年)
- 部品別セグメント分析 (2019~2023年)
- 地域別セグメント分析 (2019~2023年)
- 国別セグメント分析 (2019~2023年)
第6章 定性分析
- AIの影響:電子カルテの世界市場
第7章 ファイブフォース分析
- ファイブフォースの要約
- 買い手の交渉力
- 供給企業の交渉力
- 新規参入業者の脅威
- 代替品の脅威
- 競争の脅威
- 市況
第8章 市場セグメンテーション:展開別
- 市場セグメント
- 比較:展開別
- オンプレミス:市場規模と予測 (2024~2029年)
- クラウドベース:市場規模と予測 (2024~2029年)
- 市場機会:展開別
第9章 市場セグメンテーション:コンポーネント別
- 市場セグメント
- 比較:コンポーネント別
- サービス:市場規模と予測 (2024~2029年)
- ソフトウェア:市場規模と予測 (2024~2029年)
- ハードウェア:市場規模と予測 (2024~2029年)
- 市場機会:コンポーネント別
第10章 顧客情勢
- 顧客情勢の概要
第11章 地域別情勢
- 地域別セグメンテーション
- 地域別比較
- 北米:市場規模と予測 (2024~2029年)
- 欧州:市場規模と予測 (2024~2029年)
- アジア:市場規模と予測 (2024~2029年)
- 世界のその他の地域:市場規模と予測 (2024~2029年)
- 米国:市場規模と予測 (2024~2029年)
- カナダ:市場規模と予測 (2024~2029年)
- ドイツ:市場規模と予測 (2024~2029年)
- 中国:市場規模と予測 (2024~2029年)
- 英国:市場規模と予測 (2024~2029年)
- フランス:市場規模と予測 (2024~2029年)
- イタリア:市場規模と予測 (2024~2029年)
- 日本:市場規模と予測 (2024~2029年)
- スペイン:市場規模と予測 (2024~2029年)
- インド:市場規模と予測 (2024~2029年)
- 市場機会:地域情勢別
第12章 促進要因・課題・機会・抑制要因
- 市場促進要因
- 市場の課題
- 促進要因と課題の影響
- 市場の機会・抑制要因
第13章 競合情勢
- 概要
- 競合情勢
- ディスラプションの状況
- 業界のリスク
第14章 競合分析
- 企業プロファイル
- 企業ランキング指数
- 企業の市場ポジショニング
- AdvancedMD Inc.
- athenahealth Inc.
- CareCloud Inc.
- Computer Programs and Systems Inc.
- CureMD
- Dedalus Group
- Dell Technologies Inc.
- eClinicalWorks LLC
- Epic Systems Corp.
- EverCommerce Inc.
- GE Healthcare Technologies Inc.
- Greenway Health LLC
- KareXpert Technologies Pvt. Ltd.
- Oracle Corp.
- Veradigm LLC
第15章 付録
Exhibits:
- Exhibits1: Executive Summary - Chart on Market Overview
- Exhibits2: Executive Summary - Data Table on Market Overview
- Exhibits3: Executive Summary - Chart on Global Market Characteristics
- Exhibits4: Executive Summary - Chart on Market By Geographical Landscape
- Exhibits5: Executive Summary - Chart on Market Segmentation by Deployment
- Exhibits6: Executive Summary - Chart on Market Segmentation by Component
- Exhibits7: Executive Summary - Chart on Incremental Growth
- Exhibits8: Executive Summary - Data Table on Incremental Growth
- Exhibits9: Executive Summary - Chart on Company Market Positioning
- Exhibits10: Analysis of price sensitivity, lifecycle, customer purchase basket, adoption rates, and purchase criteria
- Exhibits11: Overview on criticality of inputs and factors of differentiation
- Exhibits12: Overview on factors of disruption
- Exhibits13: Impact of drivers and challenges in 2024 and 2029
- Exhibits14: Parent Market
- Exhibits15: Data Table on - Parent Market
- Exhibits16: Market characteristics analysis
- Exhibits17: Value chain analysis
- Exhibits18: Offerings of companies included in the market definition
- Exhibits19: Market segments
- Exhibits20: Chart on Global - Market size and forecast 2024-2029 ($ million)
- Exhibits21: Data Table on Global - Market size and forecast 2024-2029 ($ million)
- Exhibits22: Chart on Global Market: Year-over-year growth 2024-2029 (%)
- Exhibits23: Data Table on Global Market: Year-over-year growth 2024-2029 (%)
- Exhibits24: Historic Market Size - Data Table on Global Electronic Health Records Market 2019 - 2023 ($ million)
- Exhibits25: Historic Market Size - Deployment Segment 2019 - 2023 ($ million)
- Exhibits26: Historic Market Size - Component Segment 2019 - 2023 ($ million)
- Exhibits27: Historic Market Size - Geography Segment 2019 - 2023 ($ million)
- Exhibits28: Historic Market Size - Country Segment 2019 - 2023 ($ million)
- Exhibits29: Five forces analysis - Comparison between 2024 and 2029
- Exhibits30: Bargaining power of buyers - Impact of key factors 2024 and 2029
- Exhibits31: Bargaining power of suppliers - Impact of key factors in 2024 and 2029
- Exhibits32: Threat of new entrants - Impact of key factors in 2024 and 2029
- Exhibits33: Threat of substitutes - Impact of key factors in 2024 and 2029
- Exhibits34: Threat of rivalry - Impact of key factors in 2024 and 2029
- Exhibits35: Chart on Market condition - Five forces 2024 and 2029
- Exhibits36: Chart on Deployment - Market share 2024-2029 (%)
- Exhibits37: Data Table on Deployment - Market share 2024-2029 (%)
- Exhibits38: Chart on Comparison by Deployment
- Exhibits39: Data Table on Comparison by Deployment
- Exhibits40: Chart on On-premises - Market size and forecast 2024-2029 ($ million)
- Exhibits41: Data Table on On-premises - Market size and forecast 2024-2029 ($ million)
- Exhibits42: Chart on On-premises - Year-over-year growth 2024-2029 (%)
- Exhibits43: Data Table on On-premises - Year-over-year growth 2024-2029 (%)
- Exhibits44: Chart on Cloud-based - Market size and forecast 2024-2029 ($ million)
- Exhibits45: Data Table on Cloud-based - Market size and forecast 2024-2029 ($ million)
- Exhibits46: Chart on Cloud-based - Year-over-year growth 2024-2029 (%)
- Exhibits47: Data Table on Cloud-based - Year-over-year growth 2024-2029 (%)
- Exhibits48: Market opportunity by Deployment ($ million)
- Exhibits49: Data Table on Market opportunity by Deployment ($ million)
- Exhibits50: Chart on Component - Market share 2024-2029 (%)
- Exhibits51: Data Table on Component - Market share 2024-2029 (%)
- Exhibits52: Chart on Comparison by Component
- Exhibits53: Data Table on Comparison by Component
- Exhibits54: Chart on Services - Market size and forecast 2024-2029 ($ million)
- Exhibits55: Data Table on Services - Market size and forecast 2024-2029 ($ million)
- Exhibits56: Chart on Services - Year-over-year growth 2024-2029 (%)
- Exhibits57: Data Table on Services - Year-over-year growth 2024-2029 (%)
- Exhibits58: Chart on Software - Market size and forecast 2024-2029 ($ million)
- Exhibits59: Data Table on Software - Market size and forecast 2024-2029 ($ million)
- Exhibits60: Chart on Software - Year-over-year growth 2024-2029 (%)
- Exhibits61: Data Table on Software - Year-over-year growth 2024-2029 (%)
- Exhibits62: Chart on Hardware - Market size and forecast 2024-2029 ($ million)
- Exhibits63: Data Table on Hardware - Market size and forecast 2024-2029 ($ million)
- Exhibits64: Chart on Hardware - Year-over-year growth 2024-2029 (%)
- Exhibits65: Data Table on Hardware - Year-over-year growth 2024-2029 (%)
- Exhibits66: Market opportunity by Component ($ million)
- Exhibits67: Data Table on Market opportunity by Component ($ million)
- Exhibits68: Analysis of price sensitivity, lifecycle, customer purchase basket, adoption rates, and purchase criteria
- Exhibits69: Chart on Market share By Geographical Landscape 2024-2029 (%)
- Exhibits70: Data Table on Market share By Geographical Landscape 2024-2029 (%)
- Exhibits71: Chart on Geographic comparison
- Exhibits72: Data Table on Geographic comparison
- Exhibits73: Chart on North America - Market size and forecast 2024-2029 ($ million)
- Exhibits74: Data Table on North America - Market size and forecast 2024-2029 ($ million)
- Exhibits75: Chart on North America - Year-over-year growth 2024-2029 (%)
- Exhibits76: Data Table on North America - Year-over-year growth 2024-2029 (%)
- Exhibits77: Chart on Europe - Market size and forecast 2024-2029 ($ million)
- Exhibits78: Data Table on Europe - Market size and forecast 2024-2029 ($ million)
- Exhibits79: Chart on Europe - Year-over-year growth 2024-2029 (%)
- Exhibits80: Data Table on Europe - Year-over-year growth 2024-2029 (%)
- Exhibits81: Chart on Asia - Market size and forecast 2024-2029 ($ million)
- Exhibits82: Data Table on Asia - Market size and forecast 2024-2029 ($ million)
- Exhibits83: Chart on Asia - Year-over-year growth 2024-2029 (%)
- Exhibits84: Data Table on Asia - Year-over-year growth 2024-2029 (%)
- Exhibits85: Chart on Rest of World (ROW) - Market size and forecast 2024-2029 ($ million)
- Exhibits86: Data Table on Rest of World (ROW) - Market size and forecast 2024-2029 ($ million)
- Exhibits87: Chart on Rest of World (ROW) - Year-over-year growth 2024-2029 (%)
- Exhibits88: Data Table on Rest of World (ROW) - Year-over-year growth 2024-2029 (%)
- Exhibits89: Chart on US - Market size and forecast 2024-2029 ($ million)
- Exhibits90: Data Table on US - Market size and forecast 2024-2029 ($ million)
- Exhibits91: Chart on US - Year-over-year growth 2024-2029 (%)
- Exhibits92: Data Table on US - Year-over-year growth 2024-2029 (%)
- Exhibits93: Chart on Canada - Market size and forecast 2024-2029 ($ million)
- Exhibits94: Data Table on Canada - Market size and forecast 2024-2029 ($ million)
- Exhibits95: Chart on Canada - Year-over-year growth 2024-2029 (%)
- Exhibits96: Data Table on Canada - Year-over-year growth 2024-2029 (%)
- Exhibits97: Chart on Germany - Market size and forecast 2024-2029 ($ million)
- Exhibits98: Data Table on Germany - Market size and forecast 2024-2029 ($ million)
- Exhibits99: Chart on Germany - Year-over-year growth 2024-2029 (%)
- Exhibits100: Data Table on Germany - Year-over-year growth 2024-2029 (%)
- Exhibits101: Chart on China - Market size and forecast 2024-2029 ($ million)
- Exhibits102: Data Table on China - Market size and forecast 2024-2029 ($ million)
- Exhibits103: Chart on China - Year-over-year growth 2024-2029 (%)
- Exhibits104: Data Table on China - Year-over-year growth 2024-2029 (%)
- Exhibits105: Chart on UK - Market size and forecast 2024-2029 ($ million)
- Exhibits106: Data Table on UK - Market size and forecast 2024-2029 ($ million)
- Exhibits107: Chart on UK - Year-over-year growth 2024-2029 (%)
- Exhibits108: Data Table on UK - Year-over-year growth 2024-2029 (%)
- Exhibits109: Chart on France - Market size and forecast 2024-2029 ($ million)
- Exhibits110: Data Table on France - Market size and forecast 2024-2029 ($ million)
- Exhibits111: Chart on France - Year-over-year growth 2024-2029 (%)
- Exhibits112: Data Table on France - Year-over-year growth 2024-2029 (%)
- Exhibits113: Chart on Italy - Market size and forecast 2024-2029 ($ million)
- Exhibits114: Data Table on Italy - Market size and forecast 2024-2029 ($ million)
- Exhibits115: Chart on Italy - Year-over-year growth 2024-2029 (%)
- Exhibits116: Data Table on Italy - Year-over-year growth 2024-2029 (%)
- Exhibits117: Chart on Japan - Market size and forecast 2024-2029 ($ million)
- Exhibits118: Data Table on Japan - Market size and forecast 2024-2029 ($ million)
- Exhibits119: Chart on Japan - Year-over-year growth 2024-2029 (%)
- Exhibits120: Data Table on Japan - Year-over-year growth 2024-2029 (%)
- Exhibits121: Chart on Spain - Market size and forecast 2024-2029 ($ million)
- Exhibits122: Data Table on Spain - Market size and forecast 2024-2029 ($ million)
- Exhibits123: Chart on Spain - Year-over-year growth 2024-2029 (%)
- Exhibits124: Data Table on Spain - Year-over-year growth 2024-2029 (%)
- Exhibits125: Chart on India - Market size and forecast 2024-2029 ($ million)
- Exhibits126: Data Table on India - Market size and forecast 2024-2029 ($ million)
- Exhibits127: Chart on India - Year-over-year growth 2024-2029 (%)
- Exhibits128: Data Table on India - Year-over-year growth 2024-2029 (%)
- Exhibits129: Market opportunity By Geographical Landscape ($ million)
- Exhibits130: Data Tables on Market opportunity By Geographical Landscape ($ million)
- Exhibits131: Impact of drivers and challenges in 2024 and 2029
- Exhibits132: Overview on criticality of inputs and factors of differentiation
- Exhibits133: Overview on factors of disruption
- Exhibits134: Impact of key risks on business
- Exhibits135: Companies covered
- Exhibits136: Company ranking index
- Exhibits137: Matrix on companies position and classification
- Exhibits138: AdvancedMD Inc. - Overview
- Exhibits139: AdvancedMD Inc. - Product / Service
- Exhibits140: AdvancedMD Inc. - Key offerings
- Exhibits141: SWOT
- Exhibits142: athenahealth Inc. - Overview
- Exhibits143: athenahealth Inc. - Product / Service
- Exhibits144: athenahealth Inc. - Key offerings
- Exhibits145: SWOT
- Exhibits146: CareCloud Inc. - Overview
- Exhibits147: CareCloud Inc. - Business segments
- Exhibits148: CareCloud Inc. - Key news
- Exhibits149: CareCloud Inc. - Key offerings
- Exhibits150: CareCloud Inc. - Segment focus
- Exhibits151: SWOT
- Exhibits152: Computer Programs and Systems Inc. - Overview
- Exhibits153: Computer Programs and Systems Inc. - Business segments
- Exhibits154: Computer Programs and Systems Inc. - Key offerings
- Exhibits155: Computer Programs and Systems Inc. - Segment focus
- Exhibits156: SWOT
- Exhibits157: CureMD - Overview
- Exhibits158: CureMD - Product / Service
- Exhibits159: CureMD - Key offerings
- Exhibits160: SWOT
- Exhibits161: Dedalus Group - Overview
- Exhibits162: Dedalus Group - Product / Service
- Exhibits163: Dedalus Group - Key offerings
- Exhibits164: SWOT
- Exhibits165: Dell Technologies Inc. - Overview
- Exhibits166: Dell Technologies Inc. - Business segments
- Exhibits167: Dell Technologies Inc. - Key news
- Exhibits168: Dell Technologies Inc. - Key offerings
- Exhibits169: Dell Technologies Inc. - Segment focus
- Exhibits170: SWOT
- Exhibits171: eClinicalWorks LLC - Overview
- Exhibits172: eClinicalWorks LLC - Product / Service
- Exhibits173: eClinicalWorks LLC - Key offerings
- Exhibits174: SWOT
- Exhibits175: Epic Systems Corp. - Overview
- Exhibits176: Epic Systems Corp. - Product / Service
- Exhibits177: Epic Systems Corp. - Key offerings
- Exhibits178: SWOT
- Exhibits179: EverCommerce Inc. - Overview
- Exhibits180: EverCommerce Inc. - Product / Service
- Exhibits181: EverCommerce Inc. - Key offerings
- Exhibits182: SWOT
- Exhibits183: GE Healthcare Technologies Inc. - Overview
- Exhibits184: GE Healthcare Technologies Inc. - Business segments
- Exhibits185: GE Healthcare Technologies Inc. - Key news
- Exhibits186: GE Healthcare Technologies Inc. - Key offerings
- Exhibits187: GE Healthcare Technologies Inc. - Segment focus
- Exhibits188: SWOT
- Exhibits189: Greenway Health LLC - Overview
- Exhibits190: Greenway Health LLC - Product / Service
- Exhibits191: Greenway Health LLC - Key news
- Exhibits192: Greenway Health LLC - Key offerings
- Exhibits193: SWOT
- Exhibits194: KareXpert Technologies Pvt. Ltd. - Overview
- Exhibits195: KareXpert Technologies Pvt. Ltd. - Product / Service
- Exhibits196: KareXpert Technologies Pvt. Ltd. - Key offerings
- Exhibits197: SWOT
- Exhibits198: Oracle Corp. - Overview
- Exhibits199: Oracle Corp. - Business segments
- Exhibits200: Oracle Corp. - Key news
- Exhibits201: Oracle Corp. - Key offerings
- Exhibits202: Oracle Corp. - Segment focus
- Exhibits203: SWOT
- Exhibits204: Veradigm LLC - Overview
- Exhibits205: Veradigm LLC - Business segments
- Exhibits206: Veradigm LLC - Key news
- Exhibits207: Veradigm LLC - Key offerings
- Exhibits208: Veradigm LLC - Segment focus
- Exhibits209: SWOT
- Exhibits210: Inclusions checklist
- Exhibits211: Exclusions checklist
- Exhibits212: Currency conversion rates for US$
- Exhibits213: Research methodology
- Exhibits214: Information sources
- Exhibits215: Data validation
- Exhibits216: Validation techniques employed for market sizing
- Exhibits217: Data synthesis
- Exhibits218: 360 degree market analysis
- Exhibits219: List of abbreviations
The electronic health records market is forecasted to grow by $ 49407.3 mn during 2024-2029, accelerating at a CAGR of 14.8% during the forecast period. The report on the electronic health records market provides a holistic analysis, market size and forecast, trends, growth drivers, and challenges, as well as vendor analysis covering around 25 vendors.
The report offers an up-to-date analysis regarding the current market scenario, the latest trends and drivers, and the overall market environment. The market is driven by benefits of ehr leading to rise in adoption, government initiatives supporting ehr adoption, and growing digitization of healthcare industry.
| Market Scope | |
|---|---|
| Base Year | 2025 |
| End Year | 2029 |
| Series Year | 2025-2029 |
| Growth Momentum | Accelerate |
| YOY 2025 | 13.8% |
| CAGR | 14.8% |
| Incremental Value | $49407.3 mn |
Technavio's electronic health records market is segmented as below:
By Deployment
- On-premises
- Cloud-based
By Component
- Services
- Software
- Hardware
By Geographical Landscape
- North America
- Europe
- Asia
- Rest of World (ROW)
This study identifies the rising demand for self-medication and homecare medical devices as one of the prime reasons driving the electronic health records market growth during the next few years. Also, growing use of connected devices and technologies and growing consolidation in healthcare industry will lead to sizable demand in the market.
The report on the electronic health records market covers the following areas:
- Electronic Health Records Market sizing
- Electronic Health Records Market forecast
- Electronic Health Records Market industry analysis
The robust vendor analysis is designed to help clients improve their market position, and in line with this, this report provides a detailed analysis of several leading electronic health records market vendors that include AdvancedMD Inc., athenahealth Inc., CareCloud Inc., Computer Programs and Systems Inc., CureMD, Dedalus Group, Dell Technologies Inc., eClinicalWorks LLC, Epic Systems Corp., EverCommerce Inc., GE Healthcare Technologies Inc., Greenway Health LLC, KareXpert Technologies Pvt. Ltd., McKesson Corp., MEDHOST, Medical Information Technology Inc., Oracle Corp., Siemens Healthineers AG, Tebra Technologies Inc., and Veradigm LLC. Also, the electronic health records market analysis report includes information on upcoming trends and challenges that will influence market growth. This is to help companies strategize and leverage all forthcoming growth opportunities.
The study was conducted using an objective combination of primary and secondary information including inputs from key participants in the industry. The report contains a comprehensive market and vendor landscape in addition to an analysis of the key vendors.
The publisher presents a detailed picture of the market by the way of study, synthesis, and summation of data from multiple sources by an analysis of key parameters such as profit, pricing, competition, and promotions. It presents various market facets by identifying the key industry influencers. The data presented is comprehensive, reliable, and a result of extensive primary and secondary research. The market research reports provide a complete competitive landscape and an in-depth vendor selection methodology and analysis using qualitative and quantitative research to forecast accurate market growth.
Table of Contents
1 Executive Summary
- 1.1 Market overview
- Executive Summary - Chart on Market Overview
- Executive Summary - Data Table on Market Overview
- Executive Summary - Chart on Global Market Characteristics
- Executive Summary - Chart on Market By Geographical Landscape
- Executive Summary - Chart on Market Segmentation by Deployment
- Executive Summary - Chart on Market Segmentation by Component
- Executive Summary - Chart on Incremental Growth
- Executive Summary - Data Table on Incremental Growth
- Executive Summary - Chart on Company Market Positioning
2 Technavio Analysis
- 2.1 Analysis of price sensitivity, lifecycle, customer purchase basket, adoption rates, and purchase criteria
- Analysis of price sensitivity, lifecycle, customer purchase basket, adoption rates, and purchase criteria
- 2.2 Criticality of inputs and Factors of differentiation
- Overview on criticality of inputs and factors of differentiation
- 2.3 Factors of disruption
- Overview on factors of disruption
- 2.4 Impact of drivers and challenges
- Impact of drivers and challenges in 2024 and 2029
3 Market Landscape
- 3.1 Market ecosystem
- Parent Market
- Data Table on - Parent Market
- 3.2 Market characteristics
- Market characteristics analysis
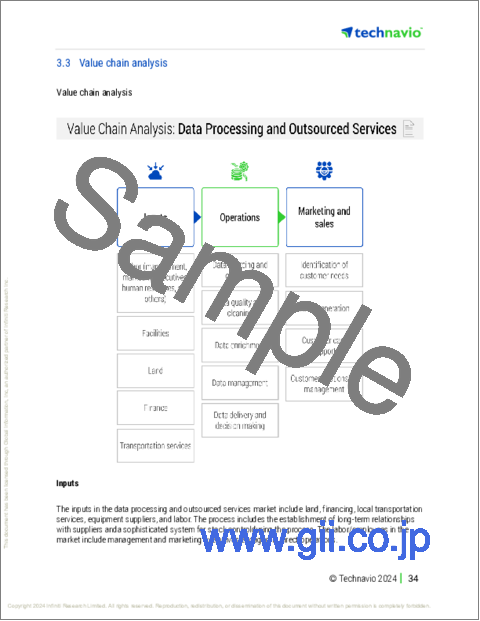
- 3.3 Value chain analysis
- Value chain analysis
4 Market Sizing
- 4.1 Market definition
- Offerings of companies included in the market definition
- 4.2 Market segment analysis
- Market segments
- 4.3 Market size 2024
- 4.4 Market outlook: Forecast for 2024-2029
- Chart on Global - Market size and forecast 2024-2029 ($ million)
- Data Table on Global - Market size and forecast 2024-2029 ($ million)
- Chart on Global Market: Year-over-year growth 2024-2029 (%)
- Data Table on Global Market: Year-over-year growth 2024-2029 (%)
5 Historic Market Size
- 5.1 Global Electronic Health Records Market 2019 - 2023
- Historic Market Size - Data Table on Global Electronic Health Records Market 2019 - 2023 ($ million)
- 5.2 Deployment segment analysis 2019 - 2023
- Historic Market Size - Deployment Segment 2019 - 2023 ($ million)
- 5.3 Component segment analysis 2019 - 2023
- Historic Market Size - Component Segment 2019 - 2023 ($ million)
- 5.4 Geography segment analysis 2019 - 2023
- Historic Market Size - Geography Segment 2019 - 2023 ($ million)
- 5.5 Country segment analysis 2019 - 2023
- Historic Market Size - Country Segment 2019 - 2023 ($ million)
6 Qualitative Analysis
- 6.1 Impact of AI on global electronic health records market
7 Five Forces Analysis
- 7.1 Five forces summary
- Five forces analysis - Comparison between 2024 and 2029
- 7.2 Bargaining power of buyers
- Bargaining power of buyers - Impact of key factors 2024 and 2029
- 7.3 Bargaining power of suppliers
- Bargaining power of suppliers - Impact of key factors in 2024 and 2029
- 7.4 Threat of new entrants
- Threat of new entrants - Impact of key factors in 2024 and 2029
- 7.5 Threat of substitutes
- Threat of substitutes - Impact of key factors in 2024 and 2029
- 7.6 Threat of rivalry
- Threat of rivalry - Impact of key factors in 2024 and 2029
- 7.7 Market condition
- Chart on Market condition - Five forces 2024 and 2029
8 Market Segmentation by Deployment
- 8.1 Market segments
- Chart on Deployment - Market share 2024-2029 (%)
- Data Table on Deployment - Market share 2024-2029 (%)
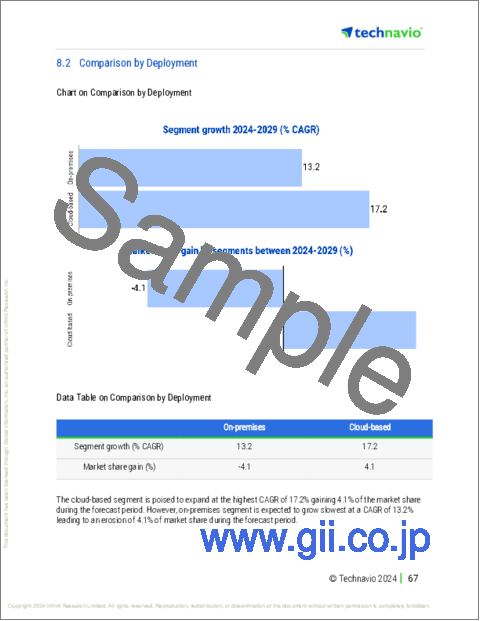
- 8.2 Comparison by Deployment
- Chart on Comparison by Deployment
- Data Table on Comparison by Deployment
- 8.3 On-premises - Market size and forecast 2024-2029
- Chart on On-premises - Market size and forecast 2024-2029 ($ million)
- Data Table on On-premises - Market size and forecast 2024-2029 ($ million)
- Chart on On-premises - Year-over-year growth 2024-2029 (%)
- Data Table on On-premises - Year-over-year growth 2024-2029 (%)
- 8.4 Cloud-based - Market size and forecast 2024-2029
- Chart on Cloud-based - Market size and forecast 2024-2029 ($ million)
- Data Table on Cloud-based - Market size and forecast 2024-2029 ($ million)
- Chart on Cloud-based - Year-over-year growth 2024-2029 (%)
- Data Table on Cloud-based - Year-over-year growth 2024-2029 (%)
- 8.5 Market opportunity by Deployment
- Market opportunity by Deployment ($ million)
- Data Table on Market opportunity by Deployment ($ million)
9 Market Segmentation by Component
- 9.1 Market segments
- Chart on Component - Market share 2024-2029 (%)
- Data Table on Component - Market share 2024-2029 (%)
- 9.2 Comparison by Component
- Chart on Comparison by Component
- Data Table on Comparison by Component
- 9.3 Services - Market size and forecast 2024-2029
- Chart on Services - Market size and forecast 2024-2029 ($ million)
- Data Table on Services - Market size and forecast 2024-2029 ($ million)
- Chart on Services - Year-over-year growth 2024-2029 (%)
- Data Table on Services - Year-over-year growth 2024-2029 (%)
- 9.4 Software - Market size and forecast 2024-2029
- Chart on Software - Market size and forecast 2024-2029 ($ million)
- Data Table on Software - Market size and forecast 2024-2029 ($ million)
- Chart on Software - Year-over-year growth 2024-2029 (%)
- Data Table on Software - Year-over-year growth 2024-2029 (%)
- 9.5 Hardware - Market size and forecast 2024-2029
- Chart on Hardware - Market size and forecast 2024-2029 ($ million)
- Data Table on Hardware - Market size and forecast 2024-2029 ($ million)
- Chart on Hardware - Year-over-year growth 2024-2029 (%)
- Data Table on Hardware - Year-over-year growth 2024-2029 (%)
- 9.6 Market opportunity by Component
- Market opportunity by Component ($ million)
- Data Table on Market opportunity by Component ($ million)
10 Customer Landscape
- 10.1 Customer landscape overview
- Analysis of price sensitivity, lifecycle, customer purchase basket, adoption rates, and purchase criteria
11 Geographic Landscape
- 11.1 Geographic segmentation
- Chart on Market share By Geographical Landscape 2024-2029 (%)
- Data Table on Market share By Geographical Landscape 2024-2029 (%)
- 11.2 Geographic comparison
- Chart on Geographic comparison
- Data Table on Geographic comparison
- 11.3 North America - Market size and forecast 2024-2029
- Chart on North America - Market size and forecast 2024-2029 ($ million)
- Data Table on North America - Market size and forecast 2024-2029 ($ million)
- Chart on North America - Year-over-year growth 2024-2029 (%)
- Data Table on North America - Year-over-year growth 2024-2029 (%)
- 11.4 Europe - Market size and forecast 2024-2029
- Chart on Europe - Market size and forecast 2024-2029 ($ million)
- Data Table on Europe - Market size and forecast 2024-2029 ($ million)
- Chart on Europe - Year-over-year growth 2024-2029 (%)
- Data Table on Europe - Year-over-year growth 2024-2029 (%)
- 11.5 Asia - Market size and forecast 2024-2029
- Chart on Asia - Market size and forecast 2024-2029 ($ million)
- Data Table on Asia - Market size and forecast 2024-2029 ($ million)
- Chart on Asia - Year-over-year growth 2024-2029 (%)
- Data Table on Asia - Year-over-year growth 2024-2029 (%)
- 11.6 Rest of World (ROW) - Market size and forecast 2024-2029
- Chart on Rest of World (ROW) - Market size and forecast 2024-2029 ($ million)
- Data Table on Rest of World (ROW) - Market size and forecast 2024-2029 ($ million)
- Chart on Rest of World (ROW) - Year-over-year growth 2024-2029 (%)
- Data Table on Rest of World (ROW) - Year-over-year growth 2024-2029 (%)
- 11.7 US - Market size and forecast 2024-2029
- Chart on US - Market size and forecast 2024-2029 ($ million)
- Data Table on US - Market size and forecast 2024-2029 ($ million)
- Chart on US - Year-over-year growth 2024-2029 (%)
- Data Table on US - Year-over-year growth 2024-2029 (%)
- 11.8 Canada - Market size and forecast 2024-2029
- Chart on Canada - Market size and forecast 2024-2029 ($ million)
- Data Table on Canada - Market size and forecast 2024-2029 ($ million)
- Chart on Canada - Year-over-year growth 2024-2029 (%)
- Data Table on Canada - Year-over-year growth 2024-2029 (%)
- 11.9 Germany - Market size and forecast 2024-2029
- Chart on Germany - Market size and forecast 2024-2029 ($ million)
- Data Table on Germany - Market size and forecast 2024-2029 ($ million)
- Chart on Germany - Year-over-year growth 2024-2029 (%)
- Data Table on Germany - Year-over-year growth 2024-2029 (%)
- 11.10 China - Market size and forecast 2024-2029
- Chart on China - Market size and forecast 2024-2029 ($ million)
- Data Table on China - Market size and forecast 2024-2029 ($ million)
- Chart on China - Year-over-year growth 2024-2029 (%)
- Data Table on China - Year-over-year growth 2024-2029 (%)
- 11.11 UK - Market size and forecast 2024-2029
- Chart on UK - Market size and forecast 2024-2029 ($ million)
- Data Table on UK - Market size and forecast 2024-2029 ($ million)
- Chart on UK - Year-over-year growth 2024-2029 (%)
- Data Table on UK - Year-over-year growth 2024-2029 (%)
- 11.12 France - Market size and forecast 2024-2029
- Chart on France - Market size and forecast 2024-2029 ($ million)
- Data Table on France - Market size and forecast 2024-2029 ($ million)
- Chart on France - Year-over-year growth 2024-2029 (%)
- Data Table on France - Year-over-year growth 2024-2029 (%)
- 11.13 Italy - Market size and forecast 2024-2029
- Chart on Italy - Market size and forecast 2024-2029 ($ million)
- Data Table on Italy - Market size and forecast 2024-2029 ($ million)
- Chart on Italy - Year-over-year growth 2024-2029 (%)
- Data Table on Italy - Year-over-year growth 2024-2029 (%)
- 11.14 Japan - Market size and forecast 2024-2029
- Chart on Japan - Market size and forecast 2024-2029 ($ million)
- Data Table on Japan - Market size and forecast 2024-2029 ($ million)
- Chart on Japan - Year-over-year growth 2024-2029 (%)
- Data Table on Japan - Year-over-year growth 2024-2029 (%)
- 11.15 Spain - Market size and forecast 2024-2029
- Chart on Spain - Market size and forecast 2024-2029 ($ million)
- Data Table on Spain - Market size and forecast 2024-2029 ($ million)
- Chart on Spain - Year-over-year growth 2024-2029 (%)
- Data Table on Spain - Year-over-year growth 2024-2029 (%)
- 11.16 India - Market size and forecast 2024-2029
- Chart on India - Market size and forecast 2024-2029 ($ million)
- Data Table on India - Market size and forecast 2024-2029 ($ million)
- Chart on India - Year-over-year growth 2024-2029 (%)
- Data Table on India - Year-over-year growth 2024-2029 (%)
- 11.17 Market opportunity By Geographical Landscape
- Market opportunity By Geographical Landscape ($ million)
- Data Tables on Market opportunity By Geographical Landscape ($ million)
12 Drivers, Challenges, and Opportunity/Restraints
- 12.1 Market drivers
- 12.2 Market challenges
- 12.3 Impact of drivers and challenges
- Impact of drivers and challenges in 2024 and 2029
- 12.4 Market opportunities/restraints
13 Competitive Landscape
- 13.1 Overview
- 13.2 Competitive Landscape
- Overview on criticality of inputs and factors of differentiation
- 13.3 Landscape disruption
- Overview on factors of disruption
- 13.4 Industry risks
- Impact of key risks on business
14 Competitive Analysis
- 14.1 Companies profiled
- Companies covered
- 14.2 Company ranking index
- Company ranking index
- 14.3 Market positioning of companies
- Matrix on companies position and classification
- 14.4 AdvancedMD Inc.
- AdvancedMD Inc. - Overview
- AdvancedMD Inc. - Product / Service
- AdvancedMD Inc. - Key offerings
- SWOT
- 14.5 athenahealth Inc.
- athenahealth Inc. - Overview
- athenahealth Inc. - Product / Service
- athenahealth Inc. - Key offerings
- SWOT
- 14.6 CareCloud Inc.
- CareCloud Inc. - Overview
- CareCloud Inc. - Business segments
- CareCloud Inc. - Key news
- CareCloud Inc. - Key offerings
- CareCloud Inc. - Segment focus
- SWOT
- 14.7 Computer Programs and Systems Inc.
- Computer Programs and Systems Inc. - Overview
- Computer Programs and Systems Inc. - Business segments
- Computer Programs and Systems Inc. - Key offerings
- Computer Programs and Systems Inc. - Segment focus
- SWOT
- 14.8 CureMD
- CureMD - Overview
- CureMD - Product / Service
- CureMD - Key offerings
- SWOT
- 14.9 Dedalus Group
- Dedalus Group - Overview
- Dedalus Group - Product / Service
- Dedalus Group - Key offerings
- SWOT
- 14.10 Dell Technologies Inc.
- Dell Technologies Inc. - Overview
- Dell Technologies Inc. - Business segments
- Dell Technologies Inc. - Key news
- Dell Technologies Inc. - Key offerings
- Dell Technologies Inc. - Segment focus
- SWOT
- 14.11 eClinicalWorks LLC
- eClinicalWorks LLC - Overview
- eClinicalWorks LLC - Product / Service
- eClinicalWorks LLC - Key offerings
- SWOT
- 14.12 Epic Systems Corp.
- Epic Systems Corp. - Overview
- Epic Systems Corp. - Product / Service
- Epic Systems Corp. - Key offerings
- SWOT
- 14.13 EverCommerce Inc.
- EverCommerce Inc. - Overview
- EverCommerce Inc. - Product / Service
- EverCommerce Inc. - Key offerings
- SWOT
- 14.14 GE Healthcare Technologies Inc.
- GE Healthcare Technologies Inc. - Overview
- GE Healthcare Technologies Inc. - Business segments
- GE Healthcare Technologies Inc. - Key news
- GE Healthcare Technologies Inc. - Key offerings
- GE Healthcare Technologies Inc. - Segment focus
- SWOT
- 14.15 Greenway Health LLC
- Greenway Health LLC - Overview
- Greenway Health LLC - Product / Service
- Greenway Health LLC - Key news
- Greenway Health LLC - Key offerings
- SWOT
- 14.16 KareXpert Technologies Pvt. Ltd.
- KareXpert Technologies Pvt. Ltd. - Overview
- KareXpert Technologies Pvt. Ltd. - Product / Service
- KareXpert Technologies Pvt. Ltd. - Key offerings
- SWOT
- 14.17 Oracle Corp.
- Oracle Corp. - Overview
- Oracle Corp. - Business segments
- Oracle Corp. - Key news
- Oracle Corp. - Key offerings
- Oracle Corp. - Segment focus
- SWOT
- 14.18 Veradigm LLC
- Veradigm LLC - Overview
- Veradigm LLC - Business segments
- Veradigm LLC - Key news
- Veradigm LLC - Key offerings
- Veradigm LLC - Segment focus
- SWOT
15 Appendix
- 15.1 Scope of the report
- 15.2 Inclusions and exclusions checklist
- Inclusions checklist
- Exclusions checklist
- 15.3 Currency conversion rates for US$
- Currency conversion rates for US$
- 15.4 Research methodology
- Research methodology
- 15.5 Data procurement
- Information sources
- 15.6 Data validation
- Data validation
- 15.7 Validation techniques employed for market sizing
- Validation techniques employed for market sizing
- 15.8 Data synthesis
- Data synthesis
- 15.9 360 degree market analysis
- 360 degree market analysis
- 15.10 List of abbreviations
- List of abbreviations

