|
|
市場調査レポート
商品コード
1456786
診断用ウェアラブル医療機器の世界市場 2024-2028Global Diagnostic Wearable Medical Devices Market 2024-2028 |
||||||
|
|||||||
カスタマイズ可能
|
|||||||


| 診断用ウェアラブル医療機器の世界市場 2024-2028 |
|
出版日: 2024年02月27日
発行: TechNavio
ページ情報: 英文 174 Pages
納期: 即納可能
|

全表示
- 概要
- 図表
- 目次
診断用ウェアラブル医療機器市場は2023-2028年に87億6,000万米ドル、予測期間中のCAGRは15.69%で成長すると予測されます。
当レポートでは、診断用ウェアラブル医療機器市場の全体的な分析、市場規模・予測、動向、成長促進要因、課題、約25のベンダーを網羅したベンダー分析などを掲載しています。
現在の市場シナリオ、最新動向と促進要因、市場環境全体に関する最新分析を提供しています。市場は、慢性疾患の有病率の増加、早期診断と予防医療への需要の高まり、費用対効果の高い診断へのニーズの高まりによって牽引されています。
| 市場範囲 | |
|---|---|
| 基準年 | 2024 |
| 終了年 | 2028 |
| 予測期間 | 2024-2028 |
| 成長モメンタム | 加速 |
| 前年比2024年 | 14.82% |
| CAGR | 15.69% |
| 増分額 | 87億6,000万米ドル |
本調査では、今後数年間の診断用ウェアラブル医療機器市場成長を牽引する主な要因の1つとして、医療分野での診断用ウェアラブル医療機器の普及拡大を挙げています。また、メンタルヘルスのモニタリングや診断用ウェアラブル医療機器の小型化にも注目が集まっており、今後大きな需要が見込まれます。
目次
第1章 エグゼクティブサマリー
- 市場概要
第2章 市場情勢
- 市場エコシステム
第3章 市場規模
- 市場の定義
- 市場セグメント分析
- 市場規模 2023
- 市場の見通し 2023-2028
第4章 市場規模実績
- 診断用ウェアラブル医療機器の世界市場 2018-2022
- デバイスセグメント分析 2018-2022
- 用途別セグメント分析 2018-2022
- 地域別セグメント分析 2018-2022
- 国別セグメント分析 2018-2022
第5章 ファイブフォース分析
- ファイブフォースの要約
- 買い手の交渉力
- 供給企業の交渉力
- 新規参入業者の脅威
- 代替品の脅威
- 競争の脅威
- 市況
第6章 市場セグメンテーション:デバイス別
- 市場セグメント
- 比較:デバイス別
- バイタルサインモニター:市場規模と予測 2023-2028
- 睡眠と活動のモニター:市場規模と予測 2023-2028
- 産科と婦人科モニタリング装置:市場規模と予測 2023-2028
- 神経モニタリング装置:市場規模と予測 2023-2028
- ECGモニター:市場規模と予測 2023-2028
- 市場機会:デバイス別
第7章 市場セグメンテーション:用途別
- 市場セグメント
- 比較:用途別
- 在宅ケア:市場規模と予測 2023-2028
- スポーツとフィットネス:市場規模と予測 2023-2028
- 遠隔患者モニタリング:市場規模と予測 2023-2028
- 市場機会:用途別
第8章 顧客情勢
- 顧客情勢の概要
第9章 地域別情勢
- 地域別セグメンテーション
- 地域別比較
- 北米:市場規模と予測 2023-2028
- 欧州:市場規模と予測 2023-2028
- アジア:市場規模と予測 2023-2028
- 世界のその他の地域:市場規模と予測 2023-2028
- 米国:市場規模と予測 2023-2028
- 中国:市場規模と予測 2023-2028
- 英国:市場規模と予測 2023-2028
- ドイツ:市場規模と予測 2023-2028
- 日本:市場規模と予測 2023-2028
- 市場機会:地域情勢別
第10章 促進要因、課題、および動向
- 市場促進要因
- 市場の課題
- 促進要因と課題の影響
- 市場動向
第11章 ベンダー情勢
- 概要
- ベンダー情勢
- 混乱の状況
- 業界のリスク
第12章 ベンダー分析
- 対象ベンダー
- ベンダーの市場ポジショニング
- Activinsights Ltd.
- AliveCor Inc.
- Alphabet Inc.
- BTS Bioengineering Corp.
- Cleveland Medical Devices Inc.
- Dragerwerk AG and Co. KGaA
- Intelesens Ltd.
- Koninklijke Philips N.V.
- Medtronic Plc
- Molex LLC
- Murata Vios, Inc.
- OMRON Corp.
- ResMed Inc.
- VitalConnect Inc.
- Wellue Health
第13章 付録
Exhibits:
- Exhibits1: Executive Summary - Chart on Market Overview
- Exhibits2: Executive Summary - Data Table on Market Overview
- Exhibits3: Executive Summary - Chart on Global Market Characteristics
- Exhibits4: Executive Summary - Chart on Market By Geographical Landscape
- Exhibits5: Executive Summary - Chart on Market Segmentation by Device
- Exhibits6: Executive Summary - Chart on Market Segmentation by Application
- Exhibits7: Executive Summary - Chart on Incremental Growth
- Exhibits8: Executive Summary - Data Table on Incremental Growth
- Exhibits9: Executive Summary - Chart on Vendor Market Positioning
- Exhibits10: Parent market
- Exhibits11: Market Characteristics
- Exhibits12: Offerings of vendors included in the market definition
- Exhibits13: Market segments
- Exhibits14: Chart on Global - Market size and forecast 2023-2028 ($ billion)
- Exhibits15: Data Table on Global - Market size and forecast 2023-2028 ($ billion)
- Exhibits16: Chart on Global Market: Year-over-year growth 2023-2028 (%)
- Exhibits17: Data Table on Global Market: Year-over-year growth 2023-2028 (%)
- Exhibits18: Historic Market Size - Data Table on global diagnostic wearable medical devices market 2018 - 2022 ($ billion)
- Exhibits19: Historic Market Size - Device Segment 2018 - 2022 ($ billion)
- Exhibits20: Historic Market Size - Application Segment 2018 - 2022 ($ billion)
- Exhibits21: Historic Market Size - Geography Segment 2018 - 2022 ($ billion)
- Exhibits22: Historic Market Size - Country Segment 2018 - 2022 ($ billion)
- Exhibits23: Five forces analysis - Comparison between 2023 and 2028
- Exhibits24: Chart on Bargaining power of buyers - Impact of key factors 2023 and 2028
- Exhibits25: Bargaining power of suppliers - Impact of key factors in 2023 and 2028
- Exhibits26: Threat of new entrants - Impact of key factors in 2023 and 2028
- Exhibits27: Threat of substitutes - Impact of key factors in 2023 and 2028
- Exhibits28: Threat of rivalry - Impact of key factors in 2023 and 2028
- Exhibits29: Chart on Market condition - Five forces 2023 and 2028
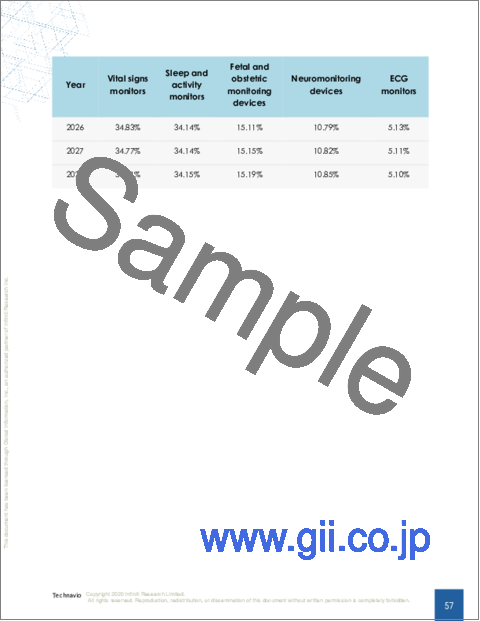
- Exhibits30: Chart on Device - Market share 2023-2028 (%)
- Exhibits31: Data Table on Device - Market share 2023-2028 (%)
- Exhibits32: Chart on Comparison by Device
- Exhibits33: Data Table on Comparison by Device
- Exhibits34: Chart on Vital signs monitors - Market size and forecast 2023-2028 ($ billion)
- Exhibits35: Data Table on Vital signs monitors - Market size and forecast 2023-2028 ($ billion)
- Exhibits36: Chart on Vital signs monitors - Year-over-year growth 2023-2028 (%)
- Exhibits37: Data Table on Vital signs monitors - Year-over-year growth 2023-2028 (%)
- Exhibits38: Chart on Sleep and activity monitors - Market size and forecast 2023-2028 ($ billion)
- Exhibits39: Data Table on Sleep and activity monitors - Market size and forecast 2023-2028 ($ billion)
- Exhibits40: Chart on Sleep and activity monitors - Year-over-year growth 2023-2028 (%)
- Exhibits41: Data Table on Sleep and activity monitors - Year-over-year growth 2023-2028 (%)
- Exhibits42: Chart on Fetal and obstetric monitoring devices - Market size and forecast 2023-2028 ($ billion)
- Exhibits43: Data Table on Fetal and obstetric monitoring devices - Market size and forecast 2023-2028 ($ billion)
- Exhibits44: Chart on Fetal and obstetric monitoring devices - Year-over-year growth 2023-2028 (%)
- Exhibits45: Data Table on Fetal and obstetric monitoring devices - Year-over-year growth 2023-2028 (%)
- Exhibits46: Chart on Neuromonitoring devices - Market size and forecast 2023-2028 ($ billion)
- Exhibits47: Data Table on Neuromonitoring devices - Market size and forecast 2023-2028 ($ billion)
- Exhibits48: Chart on Neuromonitoring devices - Year-over-year growth 2023-2028 (%)
- Exhibits49: Data Table on Neuromonitoring devices - Year-over-year growth 2023-2028 (%)
- Exhibits50: Chart on ECG monitors - Market size and forecast 2023-2028 ($ billion)
- Exhibits51: Data Table on ECG monitors - Market size and forecast 2023-2028 ($ billion)
- Exhibits52: Chart on ECG monitors - Year-over-year growth 2023-2028 (%)
- Exhibits53: Data Table on ECG monitors - Year-over-year growth 2023-2028 (%)
- Exhibits54: Market opportunity by Device ($ billion)
- Exhibits55: Data Table on Market opportunity by Device ($ billion)
- Exhibits56: Chart on Application - Market share 2023-2028 (%)
- Exhibits57: Data Table on Application - Market share 2023-2028 (%)
- Exhibits58: Chart on Comparison by Application
- Exhibits59: Data Table on Comparison by Application
- Exhibits60: Chart on Home healthcare - Market size and forecast 2023-2028 ($ billion)
- Exhibits61: Data Table on Home healthcare - Market size and forecast 2023-2028 ($ billion)
- Exhibits62: Chart on Home healthcare - Year-over-year growth 2023-2028 (%)
- Exhibits63: Data Table on Home healthcare - Year-over-year growth 2023-2028 (%)
- Exhibits64: Chart on Sports and fitness - Market size and forecast 2023-2028 ($ billion)
- Exhibits65: Data Table on Sports and fitness - Market size and forecast 2023-2028 ($ billion)
- Exhibits66: Chart on Sports and fitness - Year-over-year growth 2023-2028 (%)
- Exhibits67: Data Table on Sports and fitness - Year-over-year growth 2023-2028 (%)
- Exhibits68: Chart on Remote patient monitoring - Market size and forecast 2023-2028 ($ billion)
- Exhibits69: Data Table on Remote patient monitoring - Market size and forecast 2023-2028 ($ billion)
- Exhibits70: Chart on Remote patient monitoring - Year-over-year growth 2023-2028 (%)
- Exhibits71: Data Table on Remote patient monitoring - Year-over-year growth 2023-2028 (%)
- Exhibits72: Market opportunity by Application ($ billion)
- Exhibits73: Data Table on Market opportunity by Application ($ billion)
- Exhibits74: Analysis of price sensitivity, lifecycle, customer purchase basket, adoption rates, and purchase criteria
- Exhibits75: Chart on Market share By Geographical Landscape 2023-2028 (%)
- Exhibits76: Data Table on Market share By Geographical Landscape 2023-2028 (%)
- Exhibits77: Chart on Geographic comparison
- Exhibits78: Data Table on Geographic comparison
- Exhibits79: Chart on North America - Market size and forecast 2023-2028 ($ billion)
- Exhibits80: Data Table on North America - Market size and forecast 2023-2028 ($ billion)
- Exhibits81: Chart on North America - Year-over-year growth 2023-2028 (%)
- Exhibits82: Data Table on North America - Year-over-year growth 2023-2028 (%)
- Exhibits83: Chart on Europe - Market size and forecast 2023-2028 ($ billion)
- Exhibits84: Data Table on Europe - Market size and forecast 2023-2028 ($ billion)
- Exhibits85: Chart on Europe - Year-over-year growth 2023-2028 (%)
- Exhibits86: Data Table on Europe - Year-over-year growth 2023-2028 (%)
- Exhibits87: Chart on Asia - Market size and forecast 2023-2028 ($ billion)
- Exhibits88: Data Table on Asia - Market size and forecast 2023-2028 ($ billion)
- Exhibits89: Chart on Asia - Year-over-year growth 2023-2028 (%)
- Exhibits90: Data Table on Asia - Year-over-year growth 2023-2028 (%)
- Exhibits91: Chart on Rest of World (ROW) - Market size and forecast 2023-2028 ($ billion)
- Exhibits92: Data Table on Rest of World (ROW) - Market size and forecast 2023-2028 ($ billion)
- Exhibits93: Chart on Rest of World (ROW) - Year-over-year growth 2023-2028 (%)
- Exhibits94: Data Table on Rest of World (ROW) - Year-over-year growth 2023-2028 (%)
- Exhibits95: Chart on US - Market size and forecast 2023-2028 ($ billion)
- Exhibits96: Data Table on US - Market size and forecast 2023-2028 ($ billion)
- Exhibits97: Chart on US - Year-over-year growth 2023-2028 (%)
- Exhibits98: Data Table on US - Year-over-year growth 2023-2028 (%)
- Exhibits99: Chart on China - Market size and forecast 2023-2028 ($ billion)
- Exhibits100: Data Table on China - Market size and forecast 2023-2028 ($ billion)
- Exhibits101: Chart on China - Year-over-year growth 2023-2028 (%)
- Exhibits102: Data Table on China - Year-over-year growth 2023-2028 (%)
- Exhibits103: Chart on UK - Market size and forecast 2023-2028 ($ billion)
- Exhibits104: Data Table on UK - Market size and forecast 2023-2028 ($ billion)
- Exhibits105: Chart on UK - Year-over-year growth 2023-2028 (%)
- Exhibits106: Data Table on UK - Year-over-year growth 2023-2028 (%)
- Exhibits107: Chart on Germany - Market size and forecast 2023-2028 ($ billion)
- Exhibits108: Data Table on Germany - Market size and forecast 2023-2028 ($ billion)
- Exhibits109: Chart on Germany - Year-over-year growth 2023-2028 (%)
- Exhibits110: Data Table on Germany - Year-over-year growth 2023-2028 (%)
- Exhibits111: Chart on Japan - Market size and forecast 2023-2028 ($ billion)
- Exhibits112: Data Table on Japan - Market size and forecast 2023-2028 ($ billion)
- Exhibits113: Chart on Japan - Year-over-year growth 2023-2028 (%)
- Exhibits114: Data Table on Japan - Year-over-year growth 2023-2028 (%)
- Exhibits115: Market opportunity By Geographical Landscape ($ billion)
- Exhibits116: Data Tables on Market opportunity By Geographical Landscape ($ billion)
- Exhibits117: Impact of drivers and challenges in 2023 and 2028
- Exhibits118: Overview on Criticality of inputs and Factors of differentiation
- Exhibits119: Overview on factors of disruption
- Exhibits120: Impact of key risks on business
- Exhibits121: Vendors covered
- Exhibits122: Matrix on vendor position and classification
- Exhibits123: Activinsights Ltd. - Overview
- Exhibits124: Activinsights Ltd. - Product / Service
- Exhibits125: Activinsights Ltd. - Key offerings
- Exhibits126: AliveCor Inc. - Overview
- Exhibits127: AliveCor Inc. - Product / Service
- Exhibits128: AliveCor Inc. - Key offerings
- Exhibits129: Alphabet Inc. - Overview
- Exhibits130: Alphabet Inc. - Business segments
- Exhibits131: Alphabet Inc. - Key news
- Exhibits132: Alphabet Inc. - Key offerings
- Exhibits133: Alphabet Inc. - Segment focus
- Exhibits134: BTS Bioengineering Corp. - Overview
- Exhibits135: BTS Bioengineering Corp. - Product / Service
- Exhibits136: BTS Bioengineering Corp. - Key offerings
- Exhibits137: Cleveland Medical Devices Inc. - Overview
- Exhibits138: Cleveland Medical Devices Inc. - Product / Service
- Exhibits139: Cleveland Medical Devices Inc. - Key offerings
- Exhibits140: Dragerwerk AG and Co. KGaA - Overview
- Exhibits141: Dragerwerk AG and Co. KGaA - Business segments
- Exhibits142: Dragerwerk AG and Co. KGaA - Key offerings
- Exhibits143: Dragerwerk AG and Co. KGaA - Segment focus
- Exhibits144: Intelesens Ltd. - Overview
- Exhibits145: Intelesens Ltd. - Product / Service
- Exhibits146: Intelesens Ltd. - Key offerings
- Exhibits147: Koninklijke Philips N.V. - Overview
- Exhibits148: Koninklijke Philips N.V. - Business segments
- Exhibits149: Koninklijke Philips N.V. - Key news
- Exhibits150: Koninklijke Philips N.V. - Key offerings
- Exhibits151: Koninklijke Philips N.V. - Segment focus
- Exhibits152: Medtronic Plc - Overview
- Exhibits153: Medtronic Plc - Business segments
- Exhibits154: Medtronic Plc - Key news
- Exhibits155: Medtronic Plc - Key offerings
- Exhibits156: Medtronic Plc - Segment focus
- Exhibits157: Molex LLC - Overview
- Exhibits158: Molex LLC - Product / Service
- Exhibits159: Molex LLC - Key offerings
- Exhibits160: Murata Vios, Inc. - Overview
- Exhibits161: Murata Vios, Inc. - Product / Service
- Exhibits162: Murata Vios, Inc. - Key offerings
- Exhibits163: OMRON Corp. - Overview
- Exhibits164: OMRON Corp. - Business segments
- Exhibits165: OMRON Corp. - Key news
- Exhibits166: OMRON Corp. - Key offerings
- Exhibits167: OMRON Corp. - Segment focus
- Exhibits168: ResMed Inc. - Overview
- Exhibits169: ResMed Inc. - Business segments
- Exhibits170: ResMed Inc. - Key news
- Exhibits171: ResMed Inc. - Key offerings
- Exhibits172: ResMed Inc. - Segment focus
- Exhibits173: VitalConnect Inc. - Overview
- Exhibits174: VitalConnect Inc. - Product / Service
- Exhibits175: VitalConnect Inc. - Key offerings
- Exhibits176: Wellue Health - Overview
- Exhibits177: Wellue Health - Product / Service
- Exhibits178: Wellue Health - Key offerings
- Exhibits179: Inclusions checklist
- Exhibits180: Exclusions checklist
- Exhibits181: Currency conversion rates for US$
- Exhibits182: Research methodology
- Exhibits183: Validation techniques employed for market sizing
- Exhibits184: Information sources
- Exhibits185: List of abbreviations
The diagnostic wearable medical devices market is forecasted to grow by USD 8.76 bn during 2023-2028, accelerating at a CAGR of 15.69% during the forecast period. The report on the diagnostic wearable medical devices market provides a holistic analysis, market size and forecast, trends, growth drivers, and challenges, as well as vendor analysis covering around 25 vendors.
The report offers an up-to-date analysis regarding the current market scenario, the latest trends and drivers, and the overall market environment. The market is driven by the increasing prevalence of chronic diseases, growing demand for early diagnosis and preventive medicine, and increased need for cost-effective diagnosis.
Technavio's diagnostic wearable medical devices market is segmented as below:
| Market Scope | |
|---|---|
| Base Year | 2024 |
| End Year | 2028 |
| Series Year | 2024-2028 |
| Growth Momentum | Accelerate |
| YOY 2024 | 14.82% |
| CAGR | 15.69% |
| Incremental Value | $8.76bn |
By Device
- Vital signs monitors
- Sleep and activity monitors
- Fetal and obstetric monitoring devices
- Neuromonitoring devices
- ECG monitors
By Application
- Home healthcare
- Sports and fitness
- Remote patient monitoring
By Geographical Landscape
- North America
- Europe
- Asia
- Rest of World (ROW)
This study identifies the increasing penetration of diagnostic wearable medical devices in medical sector as one of the prime reasons driving the diagnostic wearable medical devices market growth during the next few years. Also, rising focus on mental health monitoring and miniaturization of diagnostic wearable medical devices will lead to sizable demand in the market.
The report on the diagnostic wearable medical devices market covers the following areas:
- Diagnostic wearable medical devices market sizing
- Diagnostic wearable medical devices market forecast
- Diagnostic wearable medical devices market industry analysis
The robust vendor analysis is designed to help clients improve their market position, and in line with this, this report provides a detailed analysis of several leading diagnostic wearable medical devices market vendors that include Activinsights Ltd., AliveCor Inc., Alphabet Inc., Apple Inc., Boyd Corp., BTS Bioengineering Corp., Cleveland Medical Devices Inc., Dragerwerk AG and Co. KGaA, Johari Digital India Ltd., Koninklijke Philips N.V., Medtronic Plc, Meril Life Sciences Pvt. Ltd., Molex LLC, Murata Vios, Inc., OMRON Corp., ResMed Inc., Sanmina Corp., VitalConnect Inc., Wellue Health, and Intelesens Ltd.. Also, the diagnostic wearable medical devices market analysis report includes information on upcoming trends and challenges that will influence market growth. This is to help companies strategize and leverage all forthcoming growth opportunities.
The study was conducted using an objective combination of primary and secondary information including inputs from key participants in the industry. The report contains a comprehensive market and vendor landscape in addition to an analysis of the key vendors.
The publisher presents a detailed picture of the market by the way of study, synthesis, and summation of data from multiple sources by an analysis of key parameters such as profit, pricing, competition, and promotions. It presents various market facets by identifying the key industry influencers. The data presented is comprehensive, reliable, and a result of extensive research - both primary and secondary. The market research reports provide a complete competitive landscape and an in-depth vendor selection methodology and analysis using qualitative and quantitative research to forecast the accurate market growth.
Table of Contents
1 Executive Summary
- 1.1 Market overview
2 Market Landscape
- 2.1 Market ecosystem
3 Market Sizing
- 3.1 Market definition
- 3.2 Market segment analysis
- 3.3 Market size 2023
- 3.4 Market outlook: Forecast for 2023-2028
4 Historic Market Size
- 4.1 Global diagnostic wearable medical devices market 2018 - 2022
- 4.2 Device Segment Analysis 2018 - 2022
- 4.3 Application Segment Analysis 2018 - 2022
- 4.4 Geography Segment Analysis 2018 - 2022
- 4.5 Country Segment Analysis 2018 - 2022
5 Five Forces Analysis
- 5.1 Five forces summary
- 5.2 Bargaining power of buyers
- 5.3 Bargaining power of suppliers
- 5.4 Threat of new entrants
- 5.5 Threat of substitutes
- 5.6 Threat of rivalry
- 5.7 Market condition
6 Market Segmentation by Device
- 6.1 Market segments
- 6.2 Comparison by Device
- 6.3 Vital signs monitors - Market size and forecast 2023-2028
- 6.4 Sleep and activity monitors - Market size and forecast 2023-2028
- 6.5 Fetal and obstetric monitoring devices - Market size and forecast 2023-2028
- 6.6 Neuromonitoring devices - Market size and forecast 2023-2028
- 6.7 ECG monitors - Market size and forecast 2023-2028
- 6.8 Market opportunity by Device
7 Market Segmentation by Application
- 7.1 Market segments
- 7.2 Comparison by Application
- 7.3 Home healthcare - Market size and forecast 2023-2028
- 7.4 Sports and fitness - Market size and forecast 2023-2028
- 7.5 Remote patient monitoring - Market size and forecast 2023-2028
- 7.6 Market opportunity by Application
8 Customer Landscape
- 8.1 Customer landscape overview
9 Geographic Landscape
- 9.1 Geographic segmentation
- 9.2 Geographic comparison
- 9.3 North America - Market size and forecast 2023-2028
- 9.4 Europe - Market size and forecast 2023-2028
- 9.5 Asia - Market size and forecast 2023-2028
- 9.6 Rest of World (ROW) - Market size and forecast 2023-2028
- 9.7 US - Market size and forecast 2023-2028
- 9.8 China - Market size and forecast 2023-2028
- 9.9 UK - Market size and forecast 2023-2028
- 9.10 Germany - Market size and forecast 2023-2028
- 9.11 Japan - Market size and forecast 2023-2028
- 9.12 Market opportunity By Geographical Landscape
10 Drivers, Challenges, and Trends
- 10.1 Market drivers
- 10.2 Market challenges
- 10.3 Impact of drivers and challenges
- 10.4 Market trends
11 Vendor Landscape
- 11.1 Overview
- 11.2 Vendor landscape
- 11.3 Landscape disruption
- 11.4 Industry risks
12 Vendor Analysis
- 12.1 Vendors covered
- 12.2 Market positioning of vendors
- 12.3 Activinsights Ltd.
- 12.4 AliveCor Inc.
- 12.5 Alphabet Inc.
- 12.6 BTS Bioengineering Corp.
- 12.7 Cleveland Medical Devices Inc.
- 12.8 Dragerwerk AG and Co. KGaA
- 12.9 Intelesens Ltd.
- 12.10 Koninklijke Philips N.V.
- 12.11 Medtronic Plc
- 12.12 Molex LLC
- 12.13 Murata Vios, Inc.
- 12.14 OMRON Corp.
- 12.15 ResMed Inc.
- 12.16 VitalConnect Inc.
- 12.17 Wellue Health
13 Appendix
- 13.1 Scope of the report
- 13.2 Inclusions and exclusions checklist
- 13.3 Currency conversion rates for US$
- 13.4 Research methodology
- 13.5 List of abbreviations

