|
|
市場調査レポート
商品コード
1583741
民間航空機乗員管理システムの世界市場 (2024~2028年)Global Commercial Aviation Crew Management Systems Market 2024-2028 |
||||||

|
|||||||
カスタマイズ可能
|
|||||||


| 民間航空機乗員管理システムの世界市場 (2024~2028年) |
|
出版日: 2024年08月19日
発行: TechNavio
ページ情報: 英文 166 Pages
納期: 即納可能
|

全表示
- 概要
- 図表
- 目次
民間航空機乗員管理システム市場 (2024~2028年)
民間航空機乗員管理システム市場は2023年から2028年に19億6,910万米ドル分拡大し、予測期間中に10.85%のCAGRで成長すると予測されます。当レポートでは、民間航空機乗員管理システム市場の全体分析、市場規模・予測、動向、成長促進要因、課題、約25社のベンダーを網羅したベンダー分析などを掲載しています。
当レポートでは、現在の市場シナリオ、最新動向と促進要因、市場環境全体に関する最新分析を提供しています。同市場は、運航効率の改善ニーズ、運航の完全性のニーズ、低コスト長距離便の増加などが牽引しています。
| 市場範囲 | |
|---|---|
| 基準年 | 2024年 |
| 終了年 | 2028年 |
| 予測期間 | 2024~2028年 |
| 成長モメンタム | 加速 |
| 前年比 (2024年) | 9.42% |
| CAGR | 10.85% |
| 増分額 | 19億6,910万米ドル |
当レポートでは、モバイルベース・アプリケーションの進化が、今後数年間の民間航空機乗員管理システム市場の成長を牽引する主要因の1つであると分析しています。また、中小企業の参入や、飛行時間制限(FTL)スキームに影響された動向が、市場の大きな需要につながります。
目次
第1章 エグゼクティブサマリー
- 市場概要
第2章 市場情勢
- 市場エコシステム
- 市場の特徴
- バリューチェーン分析
第3章 市場規模の評価
- 市場の定義
- 市場セグメント分析
- 市場規模 (2023年)
- 市場の見通し (2023~2028年)
第4章 市場規模実績
- 民間航空機乗員管理システムの世界市場 (2018~2022年)
- 用途別分析 (2018~2022年)
- 種類別分析 (2018~2022年)
- 地域別分析 (2018~2022年)
- 国別分析 (2018~2022年)
第5章 ファイブフォース分析
- ファイブフォースの要約
- 買い手の交渉力
- 供給企業の交渉力
- 新規参入業者の脅威
- 代替品の脅威
- 競争の脅威
- 市況
第6章 用途別の市場セグメンテーション
- 市場セグメンテーション
- 比較:用途別
- 計画:市場規模と予測 (2023~2028年)
- トレーニング:市場規模と予測 (2023~2028年)
- オペレーション:市場規模と予測 (2023~2028年)
- その他:市場規模と予測 (2023~2028年)
- 用途別の市場機会
第7章 種類別市場セグメンテーション
- 市場セグメンテーション
- 比較:種類別
- 中核システム:市場規模と予測 (2023~2028年)
- 追加システム:市場規模と予測 (2023~2028年)
- 種類別の市場機会
第8章 顧客情勢
- 顧客情勢の概要
第9章 地域別情勢
- 地域別セグメンテーション
- 地域別比較
- 北米:市場規模と予測 (2023~2028年)
- 欧州:市場規模と予測 (2023~2028年)
- アジア太平洋:市場規模と予測 (2023~2028年)
- 中東・アフリカ:市場規模と予測 (2023~2028年)
- 南米:市場規模と予測 (2023~2028年)
- 米国:市場規模と予測 (2023~2028年)
- フランス:市場規模と予測 (2023~2028年)
- ドイツ:市場規模と予測 (2023~2028年)
- 中国:市場規模と予測 (2023~2028年)
- カナダ:市場規模と予測 (2023~2028年)
- 地域別の市場機会
第10章 促進要因・課題・機会・抑制要因
- 市場促進要因
- 市場の課題
- 促進要因と課題の影響
- 市場の機会・抑制要因
第11章 競合情勢
- 概要
- 競合情勢
- 混乱の状況
- 業界のリスク
第12章 競合分析
- 企業プロファイル
- 企業の市場ポジショニング
- AIMS International Ltd.
- Airbus SE
- ARCOS LLC
- Awery Software FZ LLC
- Blue One Management S.A.
- BytzSoft Technologies Pvt. Ltd.
- CAE Inc.
- Deutsche Lufthansa AG
- Hexaware Technologies Ltd.
- Hitit Computer Services
- IBS Software Pvt. Ltd.
- Information Systems Associates FZE
- Laminaar Aviation Pte. Ltd.
- PDC AS
- The Boeing Co.
第13章 付録
Exhibits:
- Exhibits1: Executive Summary - Chart on Market Overview
- Exhibits2: Executive Summary - Data Table on Market Overview
- Exhibits3: Executive Summary - Chart on Global Market Characteristics
- Exhibits4: Executive Summary - Chart on Market By Geographical Landscape
- Exhibits5: Executive Summary - Chart on Market Segmentation by Application
- Exhibits6: Executive Summary - Chart on Market Segmentation by Type
- Exhibits7: Executive Summary - Chart on Incremental Growth
- Exhibits8: Executive Summary - Data Table on Incremental Growth
- Exhibits9: Executive Summary - Chart on Company Market Positioning
- Exhibits10: Parent Market
- Exhibits11: Data Table on - Parent Market
- Exhibits12: Market characteristics analysis
- Exhibits13: Value Chain Analysis
- Exhibits14: Offerings of companies included in the market definition
- Exhibits15: Market segments
- Exhibits16: Chart on Global - Market size and forecast 2023-2028 ($ million)
- Exhibits17: Data Table on Global - Market size and forecast 2023-2028 ($ million)
- Exhibits18: Chart on Global Market: Year-over-year growth 2023-2028 (%)
- Exhibits19: Data Table on Global Market: Year-over-year growth 2023-2028 (%)
- Exhibits20: Historic Market Size - Data Table on Global Commercial Aviation Crew Management Systems Market 2018 - 2022 ($ million)
- Exhibits21: Historic Market Size - Application Segment 2018 - 2022 ($ million)
- Exhibits22: Historic Market Size - Type Segment 2018 - 2022 ($ million)
- Exhibits23: Historic Market Size - Geography Segment 2018 - 2022 ($ million)
- Exhibits24: Historic Market Size - Country Segment 2018 - 2022 ($ million)
- Exhibits25: Five forces analysis - Comparison between 2023 and 2028
- Exhibits26: Bargaining power of buyers - Impact of key factors 2023 and 2028
- Exhibits27: Bargaining power of suppliers - Impact of key factors in 2023 and 2028
- Exhibits28: Threat of new entrants - Impact of key factors in 2023 and 2028
- Exhibits29: Threat of substitutes - Impact of key factors in 2023 and 2028
- Exhibits30: Threat of rivalry - Impact of key factors in 2023 and 2028
- Exhibits31: Chart on Market condition - Five forces 2023 and 2028
- Exhibits32: Chart on Application - Market share 2023-2028 (%)
- Exhibits33: Data Table on Application - Market share 2023-2028 (%)
- Exhibits34: Chart on Comparison by Application
- Exhibits35: Data Table on Comparison by Application
- Exhibits36: Chart on Planning - Market size and forecast 2023-2028 ($ million)
- Exhibits37: Data Table on Planning - Market size and forecast 2023-2028 ($ million)
- Exhibits38: Chart on Planning - Year-over-year growth 2023-2028 (%)
- Exhibits39: Data Table on Planning - Year-over-year growth 2023-2028 (%)
- Exhibits40: Chart on Training - Market size and forecast 2023-2028 ($ million)
- Exhibits41: Data Table on Training - Market size and forecast 2023-2028 ($ million)
- Exhibits42: Chart on Training - Year-over-year growth 2023-2028 (%)
- Exhibits43: Data Table on Training - Year-over-year growth 2023-2028 (%)
- Exhibits44: Chart on Operations - Market size and forecast 2023-2028 ($ million)
- Exhibits45: Data Table on Operations - Market size and forecast 2023-2028 ($ million)
- Exhibits46: Chart on Operations - Year-over-year growth 2023-2028 (%)
- Exhibits47: Data Table on Operations - Year-over-year growth 2023-2028 (%)
- Exhibits48: Chart on Others - Market size and forecast 2023-2028 ($ million)
- Exhibits49: Data Table on Others - Market size and forecast 2023-2028 ($ million)
- Exhibits50: Chart on Others - Year-over-year growth 2023-2028 (%)
- Exhibits51: Data Table on Others - Year-over-year growth 2023-2028 (%)
- Exhibits52: Market opportunity by Application ($ million)
- Exhibits53: Data Table on Market opportunity by Application ($ million)
- Exhibits54: Chart on Type - Market share 2023-2028 (%)
- Exhibits55: Data Table on Type - Market share 2023-2028 (%)
- Exhibits56: Chart on Comparison by Type
- Exhibits57: Data Table on Comparison by Type
- Exhibits58: Chart on Core systems - Market size and forecast 2023-2028 ($ million)
- Exhibits59: Data Table on Core systems - Market size and forecast 2023-2028 ($ million)
- Exhibits60: Chart on Core systems - Year-over-year growth 2023-2028 (%)
- Exhibits61: Data Table on Core systems - Year-over-year growth 2023-2028 (%)
- Exhibits62: Chart on Additional systems - Market size and forecast 2023-2028 ($ million)
- Exhibits63: Data Table on Additional systems - Market size and forecast 2023-2028 ($ million)
- Exhibits64: Chart on Additional systems - Year-over-year growth 2023-2028 (%)
- Exhibits65: Data Table on Additional systems - Year-over-year growth 2023-2028 (%)
- Exhibits66: Market opportunity by Type ($ million)
- Exhibits67: Data Table on Market opportunity by Type ($ million)
- Exhibits68: Analysis of price sensitivity, lifecycle, customer purchase basket, adoption rates, and purchase criteria
- Exhibits69: Chart on Market share By Geographical Landscape 2023-2028 (%)
- Exhibits70: Data Table on Market share By Geographical Landscape 2023-2028 (%)
- Exhibits71: Chart on Geographic comparison
- Exhibits72: Data Table on Geographic comparison
- Exhibits73: Chart on North America - Market size and forecast 2023-2028 ($ million)
- Exhibits74: Data Table on North America - Market size and forecast 2023-2028 ($ million)
- Exhibits75: Chart on North America - Year-over-year growth 2023-2028 (%)
- Exhibits76: Data Table on North America - Year-over-year growth 2023-2028 (%)
- Exhibits77: Chart on Europe - Market size and forecast 2023-2028 ($ million)
- Exhibits78: Data Table on Europe - Market size and forecast 2023-2028 ($ million)
- Exhibits79: Chart on Europe - Year-over-year growth 2023-2028 (%)
- Exhibits80: Data Table on Europe - Year-over-year growth 2023-2028 (%)
- Exhibits81: Chart on APAC - Market size and forecast 2023-2028 ($ million)
- Exhibits82: Data Table on APAC - Market size and forecast 2023-2028 ($ million)
- Exhibits83: Chart on APAC - Year-over-year growth 2023-2028 (%)
- Exhibits84: Data Table on APAC - Year-over-year growth 2023-2028 (%)
- Exhibits85: Chart on Middle East and Africa - Market size and forecast 2023-2028 ($ million)
- Exhibits86: Data Table on Middle East and Africa - Market size and forecast 2023-2028 ($ million)
- Exhibits87: Chart on Middle East and Africa - Year-over-year growth 2023-2028 (%)
- Exhibits88: Data Table on Middle East and Africa - Year-over-year growth 2023-2028 (%)
- Exhibits89: Chart on South America - Market size and forecast 2023-2028 ($ million)
- Exhibits90: Data Table on South America - Market size and forecast 2023-2028 ($ million)
- Exhibits91: Chart on South America - Year-over-year growth 2023-2028 (%)
- Exhibits92: Data Table on South America - Year-over-year growth 2023-2028 (%)
- Exhibits93: Chart on US - Market size and forecast 2023-2028 ($ million)
- Exhibits94: Data Table on US - Market size and forecast 2023-2028 ($ million)
- Exhibits95: Chart on US - Year-over-year growth 2023-2028 (%)
- Exhibits96: Data Table on US - Year-over-year growth 2023-2028 (%)
- Exhibits97: Chart on France - Market size and forecast 2023-2028 ($ million)
- Exhibits98: Data Table on France - Market size and forecast 2023-2028 ($ million)
- Exhibits99: Chart on France - Year-over-year growth 2023-2028 (%)
- Exhibits100: Data Table on France - Year-over-year growth 2023-2028 (%)
- Exhibits101: Chart on Germany - Market size and forecast 2023-2028 ($ million)
- Exhibits102: Data Table on Germany - Market size and forecast 2023-2028 ($ million)
- Exhibits103: Chart on Germany - Year-over-year growth 2023-2028 (%)
- Exhibits104: Data Table on Germany - Year-over-year growth 2023-2028 (%)
- Exhibits105: Chart on China - Market size and forecast 2023-2028 ($ million)
- Exhibits106: Data Table on China - Market size and forecast 2023-2028 ($ million)
- Exhibits107: Chart on China - Year-over-year growth 2023-2028 (%)
- Exhibits108: Data Table on China - Year-over-year growth 2023-2028 (%)
- Exhibits109: Chart on Canada - Market size and forecast 2023-2028 ($ million)
- Exhibits110: Data Table on Canada - Market size and forecast 2023-2028 ($ million)
- Exhibits111: Chart on Canada - Year-over-year growth 2023-2028 (%)
- Exhibits112: Data Table on Canada - Year-over-year growth 2023-2028 (%)
- Exhibits113: Market opportunity By Geographical Landscape ($ million)
- Exhibits114: Data Tables on Market opportunity By Geographical Landscape ($ million)
- Exhibits115: Impact of drivers and challenges in 2023 and 2028
- Exhibits116: Overview on criticality of inputs and factors of differentiation
- Exhibits117: Overview on factors of disruption
- Exhibits118: Impact of key risks on business
- Exhibits119: Companies covered
- Exhibits120: Matrix on companies position and classification
- Exhibits121: AIMS International Ltd. - Overview
- Exhibits122: AIMS International Ltd. - Product / Service
- Exhibits123: AIMS International Ltd. - Key offerings
- Exhibits124: Airbus SE - Overview
- Exhibits125: Airbus SE - Business segments
- Exhibits126: Airbus SE - Key news
- Exhibits127: Airbus SE - Key offerings
- Exhibits128: Airbus SE - Segment focus
- Exhibits129: ARCOS LLC - Overview
- Exhibits130: ARCOS LLC - Product / Service
- Exhibits131: ARCOS LLC - Key offerings
- Exhibits132: Awery Software FZ LLC - Overview
- Exhibits133: Awery Software FZ LLC - Product / Service
- Exhibits134: Awery Software FZ LLC - Key offerings
- Exhibits135: Blue One Management S.A. - Overview
- Exhibits136: Blue One Management S.A. - Product / Service
- Exhibits137: Blue One Management S.A. - Key offerings
- Exhibits138: BytzSoft Technologies Pvt. Ltd. - Overview
- Exhibits139: BytzSoft Technologies Pvt. Ltd. - Product / Service
- Exhibits140: BytzSoft Technologies Pvt. Ltd. - Key offerings
- Exhibits141: CAE Inc. - Overview
- Exhibits142: CAE Inc. - Business segments
- Exhibits143: CAE Inc. - Key offerings
- Exhibits144: CAE Inc. - Segment focus
- Exhibits145: Deutsche Lufthansa AG - Overview
- Exhibits146: Deutsche Lufthansa AG - Business segments
- Exhibits147: Deutsche Lufthansa AG - Key news
- Exhibits148: Deutsche Lufthansa AG - Key offerings
- Exhibits149: Deutsche Lufthansa AG - Segment focus
- Exhibits150: Hexaware Technologies Ltd. - Overview
- Exhibits151: Hexaware Technologies Ltd. - Product / Service
- Exhibits152: Hexaware Technologies Ltd. - Key offerings
- Exhibits153: Hitit Computer Services - Overview
- Exhibits154: Hitit Computer Services - Product / Service
- Exhibits155: Hitit Computer Services - Key offerings
- Exhibits156: IBS Software Pvt. Ltd. - Overview
- Exhibits157: IBS Software Pvt. Ltd. - Product / Service
- Exhibits158: IBS Software Pvt. Ltd. - Key offerings
- Exhibits159: Information Systems Associates FZE - Overview
- Exhibits160: Information Systems Associates FZE - Product / Service
- Exhibits161: Information Systems Associates FZE - Key offerings
- Exhibits162: Laminaar Aviation Pte. Ltd. - Overview
- Exhibits163: Laminaar Aviation Pte. Ltd. - Product / Service
- Exhibits164: Laminaar Aviation Pte. Ltd. - Key offerings
- Exhibits165: PDC AS - Overview
- Exhibits166: PDC AS - Product / Service
- Exhibits167: PDC AS - Key offerings
- Exhibits168: The Boeing Co. - Overview
- Exhibits169: The Boeing Co. - Business segments
- Exhibits170: The Boeing Co. - Key news
- Exhibits171: The Boeing Co. - Key offerings
- Exhibits172: The Boeing Co. - Segment focus
- Exhibits173: Inclusions checklist
- Exhibits174: Exclusions checklist
- Exhibits175: Currency conversion rates for US$
- Exhibits176: Research methodology
- Exhibits177: Information sources
- Exhibits178: Data validation
- Exhibits179: Validation techniques employed for market sizing
- Exhibits180: Data synthesis
- Exhibits181: 360 degree market analysis
- Exhibits182: List of abbreviations
Commercial Aviation Crew Management Systems Market 2024-2028
The commercial aviation crew management systems market is forecasted to grow by USD 1969.1 mn during 2023-2028, accelerating at a CAGR of 10.85% during the forecast period. The report on the commercial aviation crew management systems market provides a holistic analysis, market size and forecast, trends, growth drivers, and challenges, as well as vendor analysis covering around 25 vendors.
The report offers an up-to-date analysis regarding the current market scenario, the latest trends and drivers, and the overall market environment. The market is driven by need for improved operational efficiency, need for operational integrity, and increasing number of low-cost long-haul flights.
| Market Scope | |
|---|---|
| Base Year | 2024 |
| End Year | 2028 |
| Series Year | 2024-2028 |
| Growth Momentum | Accelerate |
| YOY 2024 | 9.42% |
| CAGR | 10.85% |
| Incremental Value | $1969.1 mn |
Technavio's commercial aviation crew management systems market is segmented as below:
By Application
- Planning
- Training
- Operations
- Others
By Type
- Core systems
- Additional systems
By Geographical Landscape
- North America
- Europe
- APAC
- Middle East and Africa
- South America
This study identifies the evolution of mobile-based applications as one of the prime reasons driving the commercial aviation crew management systems market growth during the next few years. Also, emergence of smes and flight time limitations (FTL) scheme-influenced developments will lead to sizable demand in the market.
The report on the commercial aviation crew management systems market covers the following areas:
- Commercial aviation crew management systems market sizing
- Commercial aviation crew management systems market forecast
- Commercial aviation crew management systems market industry analysis
The robust vendor analysis is designed to help clients improve their market position, and in line with this, this report provides a detailed analysis of several leading commercial aviation crew management systems market vendors that include Advanced Optimization Systems Inc., AIMS International Ltd., Airbus SE, ARCOS LLC, Awery Software FZ LLC, Blue One Management S.A., BytzSoft Technologies Pvt. Ltd., CAE Inc., Deutsche Lufthansa AG, Hexaware Technologies Ltd., Hitit Computer Services, IBS Software Pvt. Ltd., Information Systems Associates FZE, Laminaar Aviation Pte. Ltd., Leon Software sp. z o.o, Maureva Ltd., PDC AS, RadiantFleet, and The Boeing Co.. Also, the commercial aviation crew management systems market analysis report includes information on upcoming trends and challenges that will influence market growth. This is to help companies strategize and leverage all forthcoming growth opportunities.
The study was conducted using an objective combination of primary and secondary information including inputs from key participants in the industry. The report contains a comprehensive market and vendor landscape in addition to an analysis of the key vendors.
The publisher presents a detailed picture of the market by the way of study, synthesis, and summation of data from multiple sources by an analysis of key parameters such as profit, pricing, competition, and promotions. It presents various market facets by identifying the key industry influencers. The data presented is comprehensive, reliable, and a result of extensive primary and secondary research. The market research reports provide a complete competitive landscape and an in-depth vendor selection methodology and analysis using qualitative and quantitative research to forecast accurate market growth.
Table of Contents
1 Executive Summary
- 1.1 Market overview
- Executive Summary - Chart on Market Overview
- Executive Summary - Data Table on Market Overview
- Executive Summary - Chart on Global Market Characteristics
- Executive Summary - Chart on Market By Geographical Landscape
- Executive Summary - Chart on Market Segmentation by Application
- Executive Summary - Chart on Market Segmentation by Type
- Executive Summary - Chart on Incremental Growth
- Executive Summary - Data Table on Incremental Growth
- Executive Summary - Chart on Company Market Positioning
2 Market Landscape
- 2.1 Market ecosystem
- Parent Market
- Data Table on - Parent Market
- 2.2 Market characteristics
- Market characteristics analysis
- 2.3 Value chain analysis
- Value Chain Analysis
3 Market Sizing
- 3.1 Market definition
- Offerings of companies included in the market definition
- 3.2 Market segment analysis
- Market segments
- 3.3 Market size 2023
- 3.4 Market outlook: Forecast for 2023-2028
- Chart on Global - Market size and forecast 2023-2028 ($ million)
- Data Table on Global - Market size and forecast 2023-2028 ($ million)
- Chart on Global Market: Year-over-year growth 2023-2028 (%)
- Data Table on Global Market: Year-over-year growth 2023-2028 (%)
4 Historic Market Size
- 4.1 Global Commercial Aviation Crew Management Systems Market 2018 - 2022
- Historic Market Size - Data Table on Global Commercial Aviation Crew Management Systems Market 2018 - 2022 ($ million)
- 4.2 Application segment analysis 2018 - 2022
- Historic Market Size - Application Segment 2018 - 2022 ($ million)
- 4.3 Type segment analysis 2018 - 2022
- Historic Market Size - Type Segment 2018 - 2022 ($ million)
- 4.4 Geography segment analysis 2018 - 2022
- Historic Market Size - Geography Segment 2018 - 2022 ($ million)
- 4.5 Country segment analysis 2018 - 2022
- Historic Market Size - Country Segment 2018 - 2022 ($ million)
5 Five Forces Analysis
- 5.1 Five forces summary
- Five forces analysis - Comparison between 2023 and 2028
- 5.2 Bargaining power of buyers
- Bargaining power of buyers - Impact of key factors 2023 and 2028
- 5.3 Bargaining power of suppliers
- Bargaining power of suppliers - Impact of key factors in 2023 and 2028
- 5.4 Threat of new entrants
- Threat of new entrants - Impact of key factors in 2023 and 2028
- 5.5 Threat of substitutes
- Threat of substitutes - Impact of key factors in 2023 and 2028
- 5.6 Threat of rivalry
- Threat of rivalry - Impact of key factors in 2023 and 2028
- 5.7 Market condition
- Chart on Market condition - Five forces 2023 and 2028
6 Market Segmentation by Application
- 6.1 Market segments
- Chart on Application - Market share 2023-2028 (%)
- Data Table on Application - Market share 2023-2028 (%)
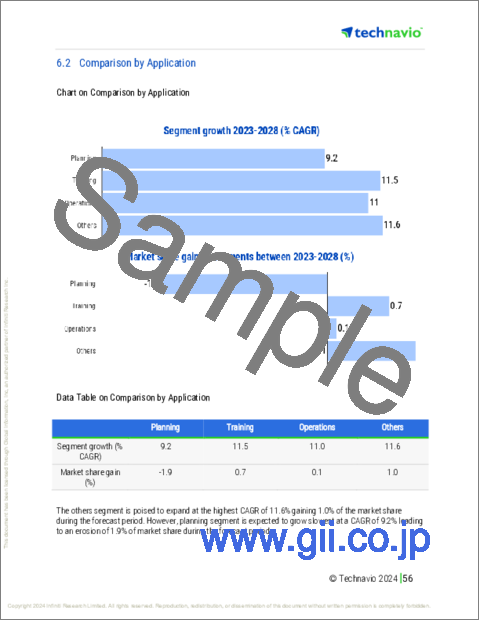
- 6.2 Comparison by Application
- Chart on Comparison by Application
- Data Table on Comparison by Application
- 6.3 Planning - Market size and forecast 2023-2028
- Chart on Planning - Market size and forecast 2023-2028 ($ million)
- Data Table on Planning - Market size and forecast 2023-2028 ($ million)
- Chart on Planning - Year-over-year growth 2023-2028 (%)
- Data Table on Planning - Year-over-year growth 2023-2028 (%)
- 6.4 Training - Market size and forecast 2023-2028
- Chart on Training - Market size and forecast 2023-2028 ($ million)
- Data Table on Training - Market size and forecast 2023-2028 ($ million)
- Chart on Training - Year-over-year growth 2023-2028 (%)
- Data Table on Training - Year-over-year growth 2023-2028 (%)
- 6.5 Operations - Market size and forecast 2023-2028
- Chart on Operations - Market size and forecast 2023-2028 ($ million)
- Data Table on Operations - Market size and forecast 2023-2028 ($ million)
- Chart on Operations - Year-over-year growth 2023-2028 (%)
- Data Table on Operations - Year-over-year growth 2023-2028 (%)
- 6.6 Others - Market size and forecast 2023-2028
- Chart on Others - Market size and forecast 2023-2028 ($ million)
- Data Table on Others - Market size and forecast 2023-2028 ($ million)
- Chart on Others - Year-over-year growth 2023-2028 (%)
- Data Table on Others - Year-over-year growth 2023-2028 (%)
- 6.7 Market opportunity by Application
- Market opportunity by Application ($ million)
- Data Table on Market opportunity by Application ($ million)
7 Market Segmentation by Type
- 7.1 Market segments
- Chart on Type - Market share 2023-2028 (%)
- Data Table on Type - Market share 2023-2028 (%)
- 7.2 Comparison by Type
- Chart on Comparison by Type
- Data Table on Comparison by Type
- 7.3 Core systems - Market size and forecast 2023-2028
- Chart on Core systems - Market size and forecast 2023-2028 ($ million)
- Data Table on Core systems - Market size and forecast 2023-2028 ($ million)
- Chart on Core systems - Year-over-year growth 2023-2028 (%)
- Data Table on Core systems - Year-over-year growth 2023-2028 (%)
- 7.4 Additional systems - Market size and forecast 2023-2028
- Chart on Additional systems - Market size and forecast 2023-2028 ($ million)
- Data Table on Additional systems - Market size and forecast 2023-2028 ($ million)
- Chart on Additional systems - Year-over-year growth 2023-2028 (%)
- Data Table on Additional systems - Year-over-year growth 2023-2028 (%)
- 7.5 Market opportunity by Type
- Market opportunity by Type ($ million)
- Data Table on Market opportunity by Type ($ million)
8 Customer Landscape
- 8.1 Customer landscape overview
- Analysis of price sensitivity, lifecycle, customer purchase basket, adoption rates, and purchase criteria
9 Geographic Landscape
- 9.1 Geographic segmentation
- Chart on Market share By Geographical Landscape 2023-2028 (%)
- Data Table on Market share By Geographical Landscape 2023-2028 (%)
- 9.2 Geographic comparison
- Chart on Geographic comparison
- Data Table on Geographic comparison
- 9.3 North America - Market size and forecast 2023-2028
- Chart on North America - Market size and forecast 2023-2028 ($ million)
- Data Table on North America - Market size and forecast 2023-2028 ($ million)
- Chart on North America - Year-over-year growth 2023-2028 (%)
- Data Table on North America - Year-over-year growth 2023-2028 (%)
- 9.4 Europe - Market size and forecast 2023-2028
- Chart on Europe - Market size and forecast 2023-2028 ($ million)
- Data Table on Europe - Market size and forecast 2023-2028 ($ million)
- Chart on Europe - Year-over-year growth 2023-2028 (%)
- Data Table on Europe - Year-over-year growth 2023-2028 (%)
- 9.5 APAC - Market size and forecast 2023-2028
- Chart on APAC - Market size and forecast 2023-2028 ($ million)
- Data Table on APAC - Market size and forecast 2023-2028 ($ million)
- Chart on APAC - Year-over-year growth 2023-2028 (%)
- Data Table on APAC - Year-over-year growth 2023-2028 (%)
- 9.6 Middle East and Africa - Market size and forecast 2023-2028
- Chart on Middle East and Africa - Market size and forecast 2023-2028 ($ million)
- Data Table on Middle East and Africa - Market size and forecast 2023-2028 ($ million)
- Chart on Middle East and Africa - Year-over-year growth 2023-2028 (%)
- Data Table on Middle East and Africa - Year-over-year growth 2023-2028 (%)
- 9.7 South America - Market size and forecast 2023-2028
- Chart on South America - Market size and forecast 2023-2028 ($ million)
- Data Table on South America - Market size and forecast 2023-2028 ($ million)
- Chart on South America - Year-over-year growth 2023-2028 (%)
- Data Table on South America - Year-over-year growth 2023-2028 (%)
- 9.8 US - Market size and forecast 2023-2028
- Chart on US - Market size and forecast 2023-2028 ($ million)
- Data Table on US - Market size and forecast 2023-2028 ($ million)
- Chart on US - Year-over-year growth 2023-2028 (%)
- Data Table on US - Year-over-year growth 2023-2028 (%)
- 9.9 France - Market size and forecast 2023-2028
- Chart on France - Market size and forecast 2023-2028 ($ million)
- Data Table on France - Market size and forecast 2023-2028 ($ million)
- Chart on France - Year-over-year growth 2023-2028 (%)
- Data Table on France - Year-over-year growth 2023-2028 (%)
- 9.10 Germany - Market size and forecast 2023-2028
- Chart on Germany - Market size and forecast 2023-2028 ($ million)
- Data Table on Germany - Market size and forecast 2023-2028 ($ million)
- Chart on Germany - Year-over-year growth 2023-2028 (%)
- Data Table on Germany - Year-over-year growth 2023-2028 (%)
- 9.11 China - Market size and forecast 2023-2028
- Chart on China - Market size and forecast 2023-2028 ($ million)
- Data Table on China - Market size and forecast 2023-2028 ($ million)
- Chart on China - Year-over-year growth 2023-2028 (%)
- Data Table on China - Year-over-year growth 2023-2028 (%)
- 9.12 Canada - Market size and forecast 2023-2028
- Chart on Canada - Market size and forecast 2023-2028 ($ million)
- Data Table on Canada - Market size and forecast 2023-2028 ($ million)
- Chart on Canada - Year-over-year growth 2023-2028 (%)
- Data Table on Canada - Year-over-year growth 2023-2028 (%)
- 9.13 Market opportunity By Geographical Landscape
- Market opportunity By Geographical Landscape ($ million)
- Data Tables on Market opportunity By Geographical Landscape ($ million)
10 Drivers, Challenges, and Opportunity/Restraints
- 10.1 Market drivers
- 10.2 Market challenges
- 10.3 Impact of drivers and challenges
- Impact of drivers and challenges in 2023 and 2028
- 10.4 Market opportunities/restraints
11 Competitive Landscape
- 11.1 Overview
- 11.2 Competitive Landscape
- Overview on criticality of inputs and factors of differentiation
- 11.3 Landscape disruption
- Overview on factors of disruption
- 11.4 Industry risks
- Impact of key risks on business
12 Competitive Analysis
- 12.1 Companies profiled
- Companies covered
- 12.2 Market positioning of companies
- Matrix on companies position and classification
- 12.3 AIMS International Ltd.
- AIMS International Ltd. - Overview
- AIMS International Ltd. - Product / Service
- AIMS International Ltd. - Key offerings
- 12.4 Airbus SE
- Airbus SE - Overview
- Airbus SE - Business segments
- Airbus SE - Key news
- Airbus SE - Key offerings
- Airbus SE - Segment focus
- 12.5 ARCOS LLC
- ARCOS LLC - Overview
- ARCOS LLC - Product / Service
- ARCOS LLC - Key offerings
- 12.6 Awery Software FZ LLC
- Awery Software FZ LLC - Overview
- Awery Software FZ LLC - Product / Service
- Awery Software FZ LLC - Key offerings
- 12.7 Blue One Management S.A.
- Blue One Management S.A. - Overview
- Blue One Management S.A. - Product / Service
- Blue One Management S.A. - Key offerings
- 12.8 BytzSoft Technologies Pvt. Ltd.
- BytzSoft Technologies Pvt. Ltd. - Overview
- BytzSoft Technologies Pvt. Ltd. - Product / Service
- BytzSoft Technologies Pvt. Ltd. - Key offerings
- 12.9 CAE Inc.
- CAE Inc. - Overview
- CAE Inc. - Business segments
- CAE Inc. - Key offerings
- CAE Inc. - Segment focus
- 12.10 Deutsche Lufthansa AG
- Deutsche Lufthansa AG - Overview
- Deutsche Lufthansa AG - Business segments
- Deutsche Lufthansa AG - Key news
- Deutsche Lufthansa AG - Key offerings
- Deutsche Lufthansa AG - Segment focus
- 12.11 Hexaware Technologies Ltd.
- Hexaware Technologies Ltd. - Overview
- Hexaware Technologies Ltd. - Product / Service
- Hexaware Technologies Ltd. - Key offerings
- 12.12 Hitit Computer Services
- Hitit Computer Services - Overview
- Hitit Computer Services - Product / Service
- Hitit Computer Services - Key offerings
- 12.13 IBS Software Pvt. Ltd.
- IBS Software Pvt. Ltd. - Overview
- IBS Software Pvt. Ltd. - Product / Service
- IBS Software Pvt. Ltd. - Key offerings
- 12.14 Information Systems Associates FZE
- Information Systems Associates FZE - Overview
- Information Systems Associates FZE - Product / Service
- Information Systems Associates FZE - Key offerings
- 12.15 Laminaar Aviation Pte. Ltd.
- Laminaar Aviation Pte. Ltd. - Overview
- Laminaar Aviation Pte. Ltd. - Product / Service
- Laminaar Aviation Pte. Ltd. - Key offerings
- 12.16 PDC AS
- PDC AS - Overview
- PDC AS - Product / Service
- PDC AS - Key offerings
- 12.17 The Boeing Co.
- The Boeing Co. - Overview
- The Boeing Co. - Business segments
- The Boeing Co. - Key news
- The Boeing Co. - Key offerings
- The Boeing Co. - Segment focus
13 Appendix
- 13.1 Scope of the report
- 13.2 Inclusions and exclusions checklist
- Inclusions checklist
- Exclusions checklist
- 13.3 Currency conversion rates for US$
- Currency conversion rates for US$
- 13.4 Research methodology
- Research methodology
- 13.5 Data procurement
- Information sources
- 13.6 Data validation
- Data validation
- 13.7 Validation techniques employed for market sizing
- Validation techniques employed for market sizing
- 13.8 Data synthesis
- Data synthesis
- 13.9 360 degree market analysis
- 360 degree market analysis
- 13.10 List of abbreviations
- List of abbreviations

