|
|
市場調査レポート
商品コード
1583583
バイオポリマーの世界市場、2024~2028年Global Biopolymers Market 2024-2028 |
||||||

|
|||||||
カスタマイズ可能
|
|||||||

| バイオポリマーの世界市場、2024~2028年 |
|
出版日: 2024年08月15日
発行: TechNavio
ページ情報: 英文 199 Pages
納期: 即納可能
|

全表示
- 概要
- 図表
- 目次
バイオポリマー市場、2024~2028年
バイオポリマー市場は2023~2028年に17兆1,146億米ドル、予測期間中のCAGRは10.52%で成長すると予測されます。当レポートでは、バイオポリマー市場の全体的な分析、市場規模・予測、動向、成長促進要因、課題、約25のベンダーを網羅したベンダー分析などを掲載しています。
現在の市場シナリオ、最新動向と促進要因、市場環境全体に関する最新分析を提供しています。市場は、原油価格の変動、厳しい環境規制と政策、PHAベースの生分解性プラスチックの需要増加によって牽引されています。
| 市場範囲 | |
|---|---|
| 基準年 | 2024年 |
| 終了年 | 2028年 |
| 予測期間 | 2024~2028年 |
| 成長モメンタム | 加速 |
| 前年比[2024年] | 9.78% |
| CAGR | 10.52% |
| 増分額 | 17兆1,146億米ドル |
本調査では、今後数年間のバイオポリマー市場成長を牽引する主要要因の一つとして、環境に優しい包装への嗜好の高まりを挙げています。また、バイオメディカル産業におけるバイオポリマーの需要の増加や、費用対効果の高さからコーンスターチの需要が高いことも、市場の大きな需要につながると考えられます。
目次
第1章 エグゼクティブサマリー
- 市場概要
第2章 市場情勢
- 市場エコシステム
- 市場の特徴
- バリューチェーン分析
第3章 市場規模の評価
- 市場の定義
- 市場セグメント分析
- 市場規模 2023年
- 市場の展望 2023~2028年
第4章 市場規模実績
- バイオポリマーの世界市場 2018~2022年
- タイプ別セグメント分析 2018~2022年
- エンドユーザー別セグメント分析 2018~2022年
- 地域別セグメント分析 2018~2022年
- 国別セグメント分析 2018~2022年
第5章 ファイブフォース分析
- ファイブフォースの要約
- 買い手の交渉力
- 供給企業の交渉力
- 新規参入業者の脅威
- 代替品の脅威
- 競争の脅威
- 市況
第6章 タイプ別市場セグメンテーション
- 市場セグメンテーション
- 比較:タイプ別
- PLA:市場規模と予測 2023~2028年
- バイオPE:市場規模と予測 2023~2028年
- バイオPET:市場規模と予測 2023~2028年
- PHA:市場規模と予測 2023~2028年
- その他:市場規模と予測 2023~2028年
- タイプ別の市場機会
第7章 エンドユーザー別市場セグメンテーション
- 市場セグメンテーション
- 比較:エンドユーザー別
- 包装と食品サービス部門:市場規模と予測 2023~2028年
- 農業と園芸:市場規模と予測 2023~2028年
- 消費財:市場規模と予測 2023~2028年
- 自動車:市場規模と予測 2023~2028年
- その他:市場規模と予測 2023~2028年
- エンドユーザー別の市場機会
第8章 顧客情勢
- 顧客情勢概要
第9章 地域別情勢
- 地域別セグメンテーション
- 比較:地域別
- 欧州:市場規模と予測 2023~2028年
- 北米:市場規模と予測 2023~2028年
- アジア太平洋:市場規模と予測 2023~2028年
- 中東・アフリカ:市場規模と予測 2023~2028年
- 南米:市場規模と予測 2023~2028年
- 米国:市場規模と予測 2023~2028年
- ドイツ:市場規模と予測 2023~2028年
- 中国:市場規模と予測 2023~2028年
- 英国:市場規模と予測 2023~2028年
- 日本:市場規模と予測 2023~2028年
- 地域情勢別の市場機会
第10章 促進要因・課題・機会・抑制要因
- 市場促進要因
- 市場課題
- 促進要因と課題の影響
- 市場機会・抑制要因
第11章 競合情勢
- 概要
- 競合情勢
- 混乱の状況
- 業界のリスク
第12章 競合分析
- 企業プロファイル
- 企業の市場ポジショニング
- Archer Daniels Midland Co.
- Arkema Group.
- BASF SE
- Biome Technologies plc
- Braskem SA
- Danimer Scientific Inc.
- DuPont de Nemours Inc.
- Evonik Industries AG
- Galatea Bio Tech Srl
- KURARAY Co. Ltd.
- Merck KGaA
- NatureWorks LLC
- Novamont S.p.A.
- Toray Industries Inc.
- TotalEnergies Corbion bv
第13章 付録
Exhibits:
- Exhibits1: Executive Summary - Chart on Market Overview
- Exhibits2: Executive Summary - Data Table on Market Overview
- Exhibits3: Executive Summary - Chart on Global Market Characteristics
- Exhibits4: Executive Summary - Chart on Market By Geographical Landscape
- Exhibits5: Executive Summary - Chart on Market Segmentation by Type
- Exhibits6: Executive Summary - Chart on Market Segmentation by End-user
- Exhibits7: Executive Summary - Chart on Incremental Growth
- Exhibits8: Executive Summary - Data Table on Incremental Growth
- Exhibits9: Executive Summary - Chart on Company Market Positioning
- Exhibits10: Parent Market
- Exhibits11: Data Table on - Parent Market
- Exhibits12: Market characteristics analysis
- Exhibits13: Value Chain Analysis
- Exhibits14: Offerings of companies included in the market definition
- Exhibits15: Market segments
- Exhibits16: Chart on Global - Market size and forecast 2023-2028 ($ billion)
- Exhibits17: Data Table on Global - Market size and forecast 2023-2028 ($ billion)
- Exhibits18: Chart on Global Market: Year-over-year growth 2023-2028 (%)
- Exhibits19: Data Table on Global Market: Year-over-year growth 2023-2028 (%)
- Exhibits20: Historic Market Size - Data Table on Global Biopolymers Market 2018 - 2022 ($ billion)
- Exhibits21: Historic Market Size - Type Segment 2018 - 2022 ($ billion)
- Exhibits22: Historic Market Size - End-user Segment 2018 - 2022 ($ billion)
- Exhibits23: Historic Market Size - Geography Segment 2018 - 2022 ($ billion)
- Exhibits24: Historic Market Size - Country Segment 2018 - 2022 ($ billion)
- Exhibits25: Five forces analysis - Comparison between 2023 and 2028
- Exhibits26: Bargaining power of buyers - Impact of key factors 2023 and 2028
- Exhibits27: Bargaining power of suppliers - Impact of key factors in 2023 and 2028
- Exhibits28: Threat of new entrants - Impact of key factors in 2023 and 2028
- Exhibits29: Threat of substitutes - Impact of key factors in 2023 and 2028
- Exhibits30: Threat of rivalry - Impact of key factors in 2023 and 2028
- Exhibits31: Chart on Market condition - Five forces 2023 and 2028
- Exhibits32: Chart on Type - Market share 2023-2028 (%)
- Exhibits33: Data Table on Type - Market share 2023-2028 (%)
- Exhibits34: Chart on Comparison by Type
- Exhibits35: Data Table on Comparison by Type
- Exhibits36: Chart on PLA - Market size and forecast 2023-2028 ($ billion)
- Exhibits37: Data Table on PLA - Market size and forecast 2023-2028 ($ billion)
- Exhibits38: Chart on PLA - Year-over-year growth 2023-2028 (%)
- Exhibits39: Data Table on PLA - Year-over-year growth 2023-2028 (%)
- Exhibits40: Chart on Bio-PE - Market size and forecast 2023-2028 ($ billion)
- Exhibits41: Data Table on Bio-PE - Market size and forecast 2023-2028 ($ billion)
- Exhibits42: Chart on Bio-PE - Year-over-year growth 2023-2028 (%)
- Exhibits43: Data Table on Bio-PE - Year-over-year growth 2023-2028 (%)
- Exhibits44: Chart on Bio-PET - Market size and forecast 2023-2028 ($ billion)
- Exhibits45: Data Table on Bio-PET - Market size and forecast 2023-2028 ($ billion)
- Exhibits46: Chart on Bio-PET - Year-over-year growth 2023-2028 (%)
- Exhibits47: Data Table on Bio-PET - Year-over-year growth 2023-2028 (%)
- Exhibits48: Chart on PHA - Market size and forecast 2023-2028 ($ billion)
- Exhibits49: Data Table on PHA - Market size and forecast 2023-2028 ($ billion)
- Exhibits50: Chart on PHA - Year-over-year growth 2023-2028 (%)
- Exhibits51: Data Table on PHA - Year-over-year growth 2023-2028 (%)
- Exhibits52: Chart on Others - Market size and forecast 2023-2028 ($ billion)
- Exhibits53: Data Table on Others - Market size and forecast 2023-2028 ($ billion)
- Exhibits54: Chart on Others - Year-over-year growth 2023-2028 (%)
- Exhibits55: Data Table on Others - Year-over-year growth 2023-2028 (%)
- Exhibits56: Market opportunity by Type ($ billion)
- Exhibits57: Data Table on Market opportunity by Type ($ billion)
- Exhibits58: Chart on End-user - Market share 2023-2028 (%)
- Exhibits59: Data Table on End-user - Market share 2023-2028 (%)
- Exhibits60: Chart on Comparison by End-user
- Exhibits61: Data Table on Comparison by End-user
- Exhibits62: Chart on Packaging and food services sector - Market size and forecast 2023-2028 ($ billion)
- Exhibits63: Data Table on Packaging and food services sector - Market size and forecast 2023-2028 ($ billion)
- Exhibits64: Chart on Packaging and food services sector - Year-over-year growth 2023-2028 (%)
- Exhibits65: Data Table on Packaging and food services sector - Year-over-year growth 2023-2028 (%)
- Exhibits66: Chart on Agriculture and horticulture - Market size and forecast 2023-2028 ($ billion)
- Exhibits67: Data Table on Agriculture and horticulture - Market size and forecast 2023-2028 ($ billion)
- Exhibits68: Chart on Agriculture and horticulture - Year-over-year growth 2023-2028 (%)
- Exhibits69: Data Table on Agriculture and horticulture - Year-over-year growth 2023-2028 (%)
- Exhibits70: Chart on Consumer goods - Market size and forecast 2023-2028 ($ billion)
- Exhibits71: Data Table on Consumer goods - Market size and forecast 2023-2028 ($ billion)
- Exhibits72: Chart on Consumer goods - Year-over-year growth 2023-2028 (%)
- Exhibits73: Data Table on Consumer goods - Year-over-year growth 2023-2028 (%)
- Exhibits74: Chart on Automotive - Market size and forecast 2023-2028 ($ billion)
- Exhibits75: Data Table on Automotive - Market size and forecast 2023-2028 ($ billion)
- Exhibits76: Chart on Automotive - Year-over-year growth 2023-2028 (%)
- Exhibits77: Data Table on Automotive - Year-over-year growth 2023-2028 (%)
- Exhibits78: Chart on Others - Market size and forecast 2023-2028 ($ billion)
- Exhibits79: Data Table on Others - Market size and forecast 2023-2028 ($ billion)
- Exhibits80: Chart on Others - Year-over-year growth 2023-2028 (%)
- Exhibits81: Data Table on Others - Year-over-year growth 2023-2028 (%)
- Exhibits82: Market opportunity by End-user ($ billion)
- Exhibits83: Data Table on Market opportunity by End-user ($ billion)
- Exhibits84: Analysis of price sensitivity, lifecycle, customer purchase basket, adoption rates, and purchase criteria
- Exhibits85: Chart on Market share By Geographical Landscape 2023-2028 (%)
- Exhibits86: Data Table on Market share By Geographical Landscape 2023-2028 (%)
- Exhibits87: Chart on Geographic comparison
- Exhibits88: Data Table on Geographic comparison
- Exhibits89: Chart on Europe - Market size and forecast 2023-2028 ($ billion)
- Exhibits90: Data Table on Europe - Market size and forecast 2023-2028 ($ billion)
- Exhibits91: Chart on Europe - Year-over-year growth 2023-2028 (%)
- Exhibits92: Data Table on Europe - Year-over-year growth 2023-2028 (%)
- Exhibits93: Chart on North America - Market size and forecast 2023-2028 ($ billion)
- Exhibits94: Data Table on North America - Market size and forecast 2023-2028 ($ billion)
- Exhibits95: Chart on North America - Year-over-year growth 2023-2028 (%)
- Exhibits96: Data Table on North America - Year-over-year growth 2023-2028 (%)
- Exhibits97: Chart on APAC - Market size and forecast 2023-2028 ($ billion)
- Exhibits98: Data Table on APAC - Market size and forecast 2023-2028 ($ billion)
- Exhibits99: Chart on APAC - Year-over-year growth 2023-2028 (%)
- Exhibits100: Data Table on APAC - Year-over-year growth 2023-2028 (%)
- Exhibits101: Chart on Middle East and Africa - Market size and forecast 2023-2028 ($ billion)
- Exhibits102: Data Table on Middle East and Africa - Market size and forecast 2023-2028 ($ billion)
- Exhibits103: Chart on Middle East and Africa - Year-over-year growth 2023-2028 (%)
- Exhibits104: Data Table on Middle East and Africa - Year-over-year growth 2023-2028 (%)
- Exhibits105: Chart on South America - Market size and forecast 2023-2028 ($ billion)
- Exhibits106: Data Table on South America - Market size and forecast 2023-2028 ($ billion)
- Exhibits107: Chart on South America - Year-over-year growth 2023-2028 (%)
- Exhibits108: Data Table on South America - Year-over-year growth 2023-2028 (%)
- Exhibits109: Chart on US - Market size and forecast 2023-2028 ($ billion)
- Exhibits110: Data Table on US - Market size and forecast 2023-2028 ($ billion)
- Exhibits111: Chart on US - Year-over-year growth 2023-2028 (%)
- Exhibits112: Data Table on US - Year-over-year growth 2023-2028 (%)
- Exhibits113: Chart on Germany - Market size and forecast 2023-2028 ($ billion)
- Exhibits114: Data Table on Germany - Market size and forecast 2023-2028 ($ billion)
- Exhibits115: Chart on Germany - Year-over-year growth 2023-2028 (%)
- Exhibits116: Data Table on Germany - Year-over-year growth 2023-2028 (%)
- Exhibits117: Chart on China - Market size and forecast 2023-2028 ($ billion)
- Exhibits118: Data Table on China - Market size and forecast 2023-2028 ($ billion)
- Exhibits119: Chart on China - Year-over-year growth 2023-2028 (%)
- Exhibits120: Data Table on China - Year-over-year growth 2023-2028 (%)
- Exhibits121: Chart on UK - Market size and forecast 2023-2028 ($ billion)
- Exhibits122: Data Table on UK - Market size and forecast 2023-2028 ($ billion)
- Exhibits123: Chart on UK - Year-over-year growth 2023-2028 (%)
- Exhibits124: Data Table on UK - Year-over-year growth 2023-2028 (%)
- Exhibits125: Chart on Japan - Market size and forecast 2023-2028 ($ billion)
- Exhibits126: Data Table on Japan - Market size and forecast 2023-2028 ($ billion)
- Exhibits127: Chart on Japan - Year-over-year growth 2023-2028 (%)
- Exhibits128: Data Table on Japan - Year-over-year growth 2023-2028 (%)
- Exhibits129: Market opportunity By Geographical Landscape ($ billion)
- Exhibits130: Data Tables on Market opportunity By Geographical Landscape ($ billion)
- Exhibits131: Impact of drivers and challenges in 2023 and 2028
- Exhibits132: Overview on criticality of inputs and factors of differentiation
- Exhibits133: Overview on factors of disruption
- Exhibits134: Impact of key risks on business
- Exhibits135: Companies covered
- Exhibits136: Matrix on companies position and classification
- Exhibits137: Archer Daniels Midland Co. - Overview
- Exhibits138: Archer Daniels Midland Co. - Business segments
- Exhibits139: Archer Daniels Midland Co. - Key news
- Exhibits140: Archer Daniels Midland Co. - Key offerings
- Exhibits141: Archer Daniels Midland Co. - Segment focus
- Exhibits142: Arkema Group. - Overview
- Exhibits143: Arkema Group. - Business segments
- Exhibits144: Arkema Group. - Key news
- Exhibits145: Arkema Group. - Key offerings
- Exhibits146: Arkema Group. - Segment focus
- Exhibits147: BASF SE - Overview
- Exhibits148: BASF SE - Business segments
- Exhibits149: BASF SE - Key news
- Exhibits150: BASF SE - Key offerings
- Exhibits151: BASF SE - Segment focus
- Exhibits152: Biome Technologies plc - Overview
- Exhibits153: Biome Technologies plc - Business segments
- Exhibits154: Biome Technologies plc - Key offerings
- Exhibits155: Biome Technologies plc - Segment focus
- Exhibits156: Braskem SA - Overview
- Exhibits157: Braskem SA - Business segments
- Exhibits158: Braskem SA - Key offerings
- Exhibits159: Braskem SA - Segment focus
- Exhibits160: Danimer Scientific Inc. - Overview
- Exhibits161: Danimer Scientific Inc. - Product / Service
- Exhibits162: Danimer Scientific Inc. - Key offerings
- Exhibits163: DuPont de Nemours Inc. - Overview
- Exhibits164: DuPont de Nemours Inc. - Business segments
- Exhibits165: DuPont de Nemours Inc. - Key news
- Exhibits166: DuPont de Nemours Inc. - Key offerings
- Exhibits167: DuPont de Nemours Inc. - Segment focus
- Exhibits168: Evonik Industries AG - Overview
- Exhibits169: Evonik Industries AG - Business segments
- Exhibits170: Evonik Industries AG - Key news
- Exhibits171: Evonik Industries AG - Key offerings
- Exhibits172: Evonik Industries AG - Segment focus
- Exhibits173: Galatea Bio Tech Srl - Overview
- Exhibits174: Galatea Bio Tech Srl - Product / Service
- Exhibits175: Galatea Bio Tech Srl - Key offerings
- Exhibits176: KURARAY Co. Ltd. - Overview
- Exhibits177: KURARAY Co. Ltd. - Business segments
- Exhibits178: KURARAY Co. Ltd. - Key news
- Exhibits179: KURARAY Co. Ltd. - Key offerings
- Exhibits180: KURARAY Co. Ltd. - Segment focus
- Exhibits181: Merck KGaA - Overview
- Exhibits182: Merck KGaA - Business segments
- Exhibits183: Merck KGaA - Key news
- Exhibits184: Merck KGaA - Key offerings
- Exhibits185: Merck KGaA - Segment focus
- Exhibits186: NatureWorks LLC - Overview
- Exhibits187: NatureWorks LLC - Product / Service
- Exhibits188: NatureWorks LLC - Key offerings
- Exhibits189: Novamont S.p.A. - Overview
- Exhibits190: Novamont S.p.A. - Product / Service
- Exhibits191: Novamont S.p.A. - Key offerings
- Exhibits192: Toray Industries Inc. - Overview
- Exhibits193: Toray Industries Inc. - Business segments
- Exhibits194: Toray Industries Inc. - Key news
- Exhibits195: Toray Industries Inc. - Key offerings
- Exhibits196: Toray Industries Inc. - Segment focus
- Exhibits197: TotalEnergies Corbion bv - Overview
- Exhibits198: TotalEnergies Corbion bv - Product / Service
- Exhibits199: TotalEnergies Corbion bv - Key offerings
- Exhibits200: Inclusions checklist
- Exhibits201: Exclusions checklist
- Exhibits202: Currency conversion rates for US$
- Exhibits203: Research methodology
- Exhibits204: Information sources
- Exhibits205: Data validation
- Exhibits206: Validation techniques employed for market sizing
- Exhibits207: Data synthesis
- Exhibits208: 360 degree market analysis
- Exhibits209: List of abbreviations
Biopolymers Market 2024-2028
The biopolymers market is forecasted to grow by USD 17114.6 bn during 2023-2028, accelerating at a CAGR of 10.52% during the forecast period. The report on the biopolymers market provides a holistic analysis, market size and forecast, trends, growth drivers, and challenges, as well as vendor analysis covering around 25 vendors.
The report offers an up-to-date analysis regarding the current market scenario, the latest trends and drivers, and the overall market environment. The market is driven by volatility in crude oil prices, stringent environmental regulations and policies, and increasing demand for PHA-based biodegradable plastics.
| Market Scope | |
|---|---|
| Base Year | 2024 |
| End Year | 2028 |
| Series Year | 2024-2028 |
| Growth Momentum | Accelerate |
| YOY 2024 | 9.78% |
| CAGR | 10.52% |
| Incremental Value | $17114.6 bn |
Technavio's biopolymers market is segmented as below:
By Type
- PLA
- Bio-PE
- Bio-PET
- PHA
- Others
By End-user
- Packaging and food services sector
- Agriculture and horticulture
- Consumer goods
- Automotive
- Others
By Geographical Landscape
- Europe
- North America
- APAC
- Middle East and Africa
- South America
This study identifies the increasing preference for eco-friendly packaging as one of the prime reasons driving the biopolymers market growth during the next few years. Also, increasing demand for biopolymers in biomedical industry and high demand for cornstarch due to its cost-effective nature will lead to sizable demand in the market.
The report on the biopolymers market covers the following areas:
- Biopolymers market sizing
- Biopolymers market forecast
- Biopolymers market industry analysis
The robust vendor analysis is designed to help clients improve their market position, and in line with this, this report provides a detailed analysis of several leading biopolymers market vendors that include Archer Daniels Midland Co., Arkema Group., BASF SE, Biome Technologies plc, Braskem SA, Danimer Scientific Inc., DuPont de Nemours Inc., Eastman Chemical Co., Evonik Industries AG, Galatea Bio Tech Srl, KURARAY Co. Ltd., Merck KGaA, Mitsubishi Chemical Corp., NatureWorks LLC, Novamont S.p.A., Rodenburg Biopolymers B.V., Solanyl Biopolymers Inc., Toray Industries Inc., TotalEnergies Corbion bv, and Yield10 Bioscience Inc.. Also, the biopolymers market analysis report includes information on upcoming trends and challenges that will influence market growth. This is to help companies strategize and leverage all forthcoming growth opportunities.
The study was conducted using an objective combination of primary and secondary information including inputs from key participants in the industry. The report contains a comprehensive market and vendor landscape in addition to an analysis of the key vendors.
The publisher presents a detailed picture of the market by the way of study, synthesis, and summation of data from multiple sources by an analysis of key parameters such as profit, pricing, competition, and promotions. It presents various market facets by identifying the key industry influencers. The data presented is comprehensive, reliable, and a result of extensive primary and secondary research. The market research reports provide a complete competitive landscape and an in-depth vendor selection methodology and analysis using qualitative and quantitative research to forecast accurate market growth.
Table of Contents
1 Executive Summary
- 1.1 Market overview
- Executive Summary - Chart on Market Overview
- Executive Summary - Data Table on Market Overview
- Executive Summary - Chart on Global Market Characteristics
- Executive Summary - Chart on Market By Geographical Landscape
- Executive Summary - Chart on Market Segmentation by Type
- Executive Summary - Chart on Market Segmentation by End-user
- Executive Summary - Chart on Incremental Growth
- Executive Summary - Data Table on Incremental Growth
- Executive Summary - Chart on Company Market Positioning
2 Market Landscape
- 2.1 Market ecosystem
- Parent Market
- Data Table on - Parent Market
- 2.2 Market characteristics
- Market characteristics analysis
- 2.3 Value chain analysis
- Value Chain Analysis
3 Market Sizing
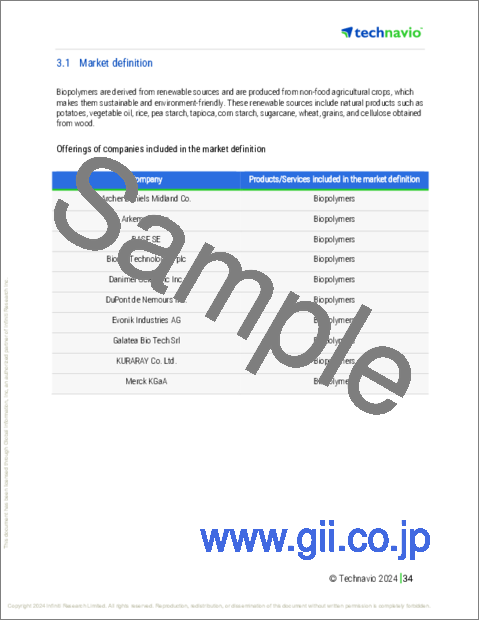
- 3.1 Market definition
- Offerings of companies included in the market definition
- 3.2 Market segment analysis
- Market segments
- 3.3 Market size 2023
- 3.4 Market outlook: Forecast for 2023-2028
- Chart on Global - Market size and forecast 2023-2028 ($ billion)
- Data Table on Global - Market size and forecast 2023-2028 ($ billion)
- Chart on Global Market: Year-over-year growth 2023-2028 (%)
- Data Table on Global Market: Year-over-year growth 2023-2028 (%)
4 Historic Market Size
- 4.1 Global Biopolymers Market 2018 - 2022
- Historic Market Size - Data Table on Global Biopolymers Market 2018 - 2022 ($ billion)
- 4.2 Type segment analysis 2018 - 2022
- Historic Market Size - Type Segment 2018 - 2022 ($ billion)
- 4.3 End-user segment analysis 2018 - 2022
- Historic Market Size - End-user Segment 2018 - 2022 ($ billion)
- 4.4 Geography segment analysis 2018 - 2022
- Historic Market Size - Geography Segment 2018 - 2022 ($ billion)
- 4.5 Country segment analysis 2018 - 2022
- Historic Market Size - Country Segment 2018 - 2022 ($ billion)
5 Five Forces Analysis
- 5.1 Five forces summary
- Five forces analysis - Comparison between 2023 and 2028
- 5.2 Bargaining power of buyers
- Bargaining power of buyers - Impact of key factors 2023 and 2028
- 5.3 Bargaining power of suppliers
- Bargaining power of suppliers - Impact of key factors in 2023 and 2028
- 5.4 Threat of new entrants
- Threat of new entrants - Impact of key factors in 2023 and 2028
- 5.5 Threat of substitutes
- Threat of substitutes - Impact of key factors in 2023 and 2028
- 5.6 Threat of rivalry
- Threat of rivalry - Impact of key factors in 2023 and 2028
- 5.7 Market condition
- Chart on Market condition - Five forces 2023 and 2028
6 Market Segmentation by Type
- 6.1 Market segments
- Chart on Type - Market share 2023-2028 (%)
- Data Table on Type - Market share 2023-2028 (%)
- 6.2 Comparison by Type
- Chart on Comparison by Type
- Data Table on Comparison by Type
- 6.3 PLA - Market size and forecast 2023-2028
- Chart on PLA - Market size and forecast 2023-2028 ($ billion)
- Data Table on PLA - Market size and forecast 2023-2028 ($ billion)
- Chart on PLA - Year-over-year growth 2023-2028 (%)
- Data Table on PLA - Year-over-year growth 2023-2028 (%)
- 6.4 Bio-PE - Market size and forecast 2023-2028
- Chart on Bio-PE - Market size and forecast 2023-2028 ($ billion)
- Data Table on Bio-PE - Market size and forecast 2023-2028 ($ billion)
- Chart on Bio-PE - Year-over-year growth 2023-2028 (%)
- Data Table on Bio-PE - Year-over-year growth 2023-2028 (%)
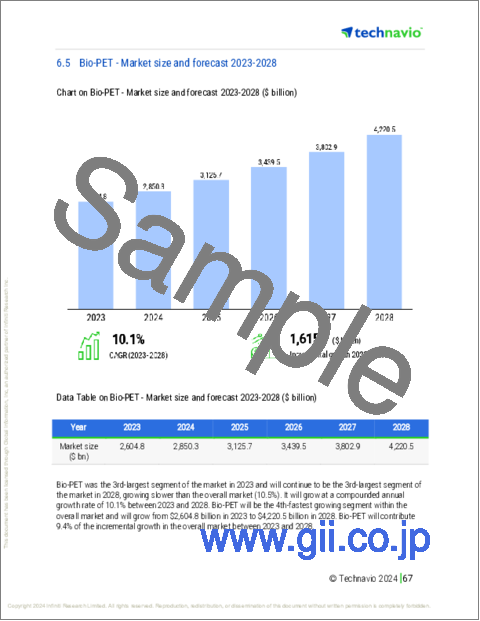
- 6.5 Bio-PET - Market size and forecast 2023-2028
- Chart on Bio-PET - Market size and forecast 2023-2028 ($ billion)
- Data Table on Bio-PET - Market size and forecast 2023-2028 ($ billion)
- Chart on Bio-PET - Year-over-year growth 2023-2028 (%)
- Data Table on Bio-PET - Year-over-year growth 2023-2028 (%)
- 6.6 PHA - Market size and forecast 2023-2028
- Chart on PHA - Market size and forecast 2023-2028 ($ billion)
- Data Table on PHA - Market size and forecast 2023-2028 ($ billion)
- Chart on PHA - Year-over-year growth 2023-2028 (%)
- Data Table on PHA - Year-over-year growth 2023-2028 (%)
- 6.7 Others - Market size and forecast 2023-2028
- Chart on Others - Market size and forecast 2023-2028 ($ billion)
- Data Table on Others - Market size and forecast 2023-2028 ($ billion)
- Chart on Others - Year-over-year growth 2023-2028 (%)
- Data Table on Others - Year-over-year growth 2023-2028 (%)
- 6.8 Market opportunity by Type
- Market opportunity by Type ($ billion)
- Data Table on Market opportunity by Type ($ billion)
7 Market Segmentation by End-user
- 7.1 Market segments
- Chart on End-user - Market share 2023-2028 (%)
- Data Table on End-user - Market share 2023-2028 (%)
- 7.2 Comparison by End-user
- Chart on Comparison by End-user
- Data Table on Comparison by End-user
- 7.3 Packaging and food services sector - Market size and forecast 2023-2028
- Chart on Packaging and food services sector - Market size and forecast 2023-2028 ($ billion)
- Data Table on Packaging and food services sector - Market size and forecast 2023-2028 ($ billion)
- Chart on Packaging and food services sector - Year-over-year growth 2023-2028 (%)
- Data Table on Packaging and food services sector - Year-over-year growth 2023-2028 (%)
- 7.4 Agriculture and horticulture - Market size and forecast 2023-2028
- Chart on Agriculture and horticulture - Market size and forecast 2023-2028 ($ billion)
- Data Table on Agriculture and horticulture - Market size and forecast 2023-2028 ($ billion)
- Chart on Agriculture and horticulture - Year-over-year growth 2023-2028 (%)
- Data Table on Agriculture and horticulture - Year-over-year growth 2023-2028 (%)
- 7.5 Consumer goods - Market size and forecast 2023-2028
- Chart on Consumer goods - Market size and forecast 2023-2028 ($ billion)
- Data Table on Consumer goods - Market size and forecast 2023-2028 ($ billion)
- Chart on Consumer goods - Year-over-year growth 2023-2028 (%)
- Data Table on Consumer goods - Year-over-year growth 2023-2028 (%)
- 7.6 Automotive - Market size and forecast 2023-2028
- Chart on Automotive - Market size and forecast 2023-2028 ($ billion)
- Data Table on Automotive - Market size and forecast 2023-2028 ($ billion)
- Chart on Automotive - Year-over-year growth 2023-2028 (%)
- Data Table on Automotive - Year-over-year growth 2023-2028 (%)
- 7.7 Others - Market size and forecast 2023-2028
- Chart on Others - Market size and forecast 2023-2028 ($ billion)
- Data Table on Others - Market size and forecast 2023-2028 ($ billion)
- Chart on Others - Year-over-year growth 2023-2028 (%)
- Data Table on Others - Year-over-year growth 2023-2028 (%)
- 7.8 Market opportunity by End-user
- Market opportunity by End-user ($ billion)
- Data Table on Market opportunity by End-user ($ billion)
8 Customer Landscape
- 8.1 Customer landscape overview
- Analysis of price sensitivity, lifecycle, customer purchase basket, adoption rates, and purchase criteria
9 Geographic Landscape
- 9.1 Geographic segmentation
- Chart on Market share By Geographical Landscape 2023-2028 (%)
- Data Table on Market share By Geographical Landscape 2023-2028 (%)
- 9.2 Geographic comparison
- Chart on Geographic comparison
- Data Table on Geographic comparison
- 9.3 Europe - Market size and forecast 2023-2028
- Chart on Europe - Market size and forecast 2023-2028 ($ billion)
- Data Table on Europe - Market size and forecast 2023-2028 ($ billion)
- Chart on Europe - Year-over-year growth 2023-2028 (%)
- Data Table on Europe - Year-over-year growth 2023-2028 (%)
- 9.4 North America - Market size and forecast 2023-2028
- Chart on North America - Market size and forecast 2023-2028 ($ billion)
- Data Table on North America - Market size and forecast 2023-2028 ($ billion)
- Chart on North America - Year-over-year growth 2023-2028 (%)
- Data Table on North America - Year-over-year growth 2023-2028 (%)
- 9.5 APAC - Market size and forecast 2023-2028
- Chart on APAC - Market size and forecast 2023-2028 ($ billion)
- Data Table on APAC - Market size and forecast 2023-2028 ($ billion)
- Chart on APAC - Year-over-year growth 2023-2028 (%)
- Data Table on APAC - Year-over-year growth 2023-2028 (%)
- 9.6 Middle East and Africa - Market size and forecast 2023-2028
- Chart on Middle East and Africa - Market size and forecast 2023-2028 ($ billion)
- Data Table on Middle East and Africa - Market size and forecast 2023-2028 ($ billion)
- Chart on Middle East and Africa - Year-over-year growth 2023-2028 (%)
- Data Table on Middle East and Africa - Year-over-year growth 2023-2028 (%)
- 9.7 South America - Market size and forecast 2023-2028
- Chart on South America - Market size and forecast 2023-2028 ($ billion)
- Data Table on South America - Market size and forecast 2023-2028 ($ billion)
- Chart on South America - Year-over-year growth 2023-2028 (%)
- Data Table on South America - Year-over-year growth 2023-2028 (%)
- 9.8 US - Market size and forecast 2023-2028
- Chart on US - Market size and forecast 2023-2028 ($ billion)
- Data Table on US - Market size and forecast 2023-2028 ($ billion)
- Chart on US - Year-over-year growth 2023-2028 (%)
- Data Table on US - Year-over-year growth 2023-2028 (%)
- 9.9 Germany - Market size and forecast 2023-2028
- Chart on Germany - Market size and forecast 2023-2028 ($ billion)
- Data Table on Germany - Market size and forecast 2023-2028 ($ billion)
- Chart on Germany - Year-over-year growth 2023-2028 (%)
- Data Table on Germany - Year-over-year growth 2023-2028 (%)
- 9.10 China - Market size and forecast 2023-2028
- Chart on China - Market size and forecast 2023-2028 ($ billion)
- Data Table on China - Market size and forecast 2023-2028 ($ billion)
- Chart on China - Year-over-year growth 2023-2028 (%)
- Data Table on China - Year-over-year growth 2023-2028 (%)
- 9.11 UK - Market size and forecast 2023-2028
- Chart on UK - Market size and forecast 2023-2028 ($ billion)
- Data Table on UK - Market size and forecast 2023-2028 ($ billion)
- Chart on UK - Year-over-year growth 2023-2028 (%)
- Data Table on UK - Year-over-year growth 2023-2028 (%)
- 9.12 Japan - Market size and forecast 2023-2028
- Chart on Japan - Market size and forecast 2023-2028 ($ billion)
- Data Table on Japan - Market size and forecast 2023-2028 ($ billion)
- Chart on Japan - Year-over-year growth 2023-2028 (%)
- Data Table on Japan - Year-over-year growth 2023-2028 (%)
- 9.13 Market opportunity By Geographical Landscape
- Market opportunity By Geographical Landscape ($ billion)
- Data Tables on Market opportunity By Geographical Landscape ($ billion)
10 Drivers, Challenges, and Opportunity/Restraints
- 10.1 Market drivers
- 10.2 Market challenges
- 10.3 Impact of drivers and challenges
- Impact of drivers and challenges in 2023 and 2028
- 10.4 Market opportunities/restraints
11 Competitive Landscape
- 11.1 Overview
- 11.2 Competitive Landscape
- Overview on criticality of inputs and factors of differentiation
- 11.3 Landscape disruption
- Overview on factors of disruption
- 11.4 Industry risks
- Impact of key risks on business
12 Competitive Analysis
- 12.1 Companies profiled
- Companies covered
- 12.2 Market positioning of companies
- Matrix on companies position and classification
- 12.3 Archer Daniels Midland Co.
- Archer Daniels Midland Co. - Overview
- Archer Daniels Midland Co. - Business segments
- Archer Daniels Midland Co. - Key news
- Archer Daniels Midland Co. - Key offerings
- Archer Daniels Midland Co. - Segment focus
- 12.4 Arkema Group.
- Arkema Group. - Overview
- Arkema Group. - Business segments
- Arkema Group. - Key news
- Arkema Group. - Key offerings
- Arkema Group. - Segment focus
- 12.5 BASF SE
- BASF SE - Overview
- BASF SE - Business segments
- BASF SE - Key news
- BASF SE - Key offerings
- BASF SE - Segment focus
- 12.6 Biome Technologies plc
- Biome Technologies plc - Overview
- Biome Technologies plc - Business segments
- Biome Technologies plc - Key offerings
- Biome Technologies plc - Segment focus
- 12.7 Braskem SA
- Braskem SA - Overview
- Braskem SA - Business segments
- Braskem SA - Key offerings
- Braskem SA - Segment focus
- 12.8 Danimer Scientific Inc.
- Danimer Scientific Inc. - Overview
- Danimer Scientific Inc. - Product / Service
- Danimer Scientific Inc. - Key offerings
- 12.9 DuPont de Nemours Inc.
- DuPont de Nemours Inc. - Overview
- DuPont de Nemours Inc. - Business segments
- DuPont de Nemours Inc. - Key news
- DuPont de Nemours Inc. - Key offerings
- DuPont de Nemours Inc. - Segment focus
- 12.10 Evonik Industries AG
- Evonik Industries AG - Overview
- Evonik Industries AG - Business segments
- Evonik Industries AG - Key news
- Evonik Industries AG - Key offerings
- Evonik Industries AG - Segment focus
- 12.11 Galatea Bio Tech Srl
- Galatea Bio Tech Srl - Overview
- Galatea Bio Tech Srl - Product / Service
- Galatea Bio Tech Srl - Key offerings
- 12.12 KURARAY Co. Ltd.
- KURARAY Co. Ltd. - Overview
- KURARAY Co. Ltd. - Business segments
- KURARAY Co. Ltd. - Key news
- KURARAY Co. Ltd. - Key offerings
- KURARAY Co. Ltd. - Segment focus
- 12.13 Merck KGaA
- Merck KGaA - Overview
- Merck KGaA - Business segments
- Merck KGaA - Key news
- Merck KGaA - Key offerings
- Merck KGaA - Segment focus
- 12.14 NatureWorks LLC
- NatureWorks LLC - Overview
- NatureWorks LLC - Product / Service
- NatureWorks LLC - Key offerings
- 12.15 Novamont S.p.A.
- Novamont S.p.A. - Overview
- Novamont S.p.A. - Product / Service
- Novamont S.p.A. - Key offerings
- 12.16 Toray Industries Inc.
- Toray Industries Inc. - Overview
- Toray Industries Inc. - Business segments
- Toray Industries Inc. - Key news
- Toray Industries Inc. - Key offerings
- Toray Industries Inc. - Segment focus
- 12.17 TotalEnergies Corbion bv
- TotalEnergies Corbion bv - Overview
- TotalEnergies Corbion bv - Product / Service
- TotalEnergies Corbion bv - Key offerings
13 Appendix
- 13.1 Scope of the report
- 13.2 Inclusions and exclusions checklist
- Inclusions checklist
- Exclusions checklist
- 13.3 Currency conversion rates for US$
- Currency conversion rates for US$
- 13.4 Research methodology
- Research methodology
- 13.5 Data procurement
- Information sources
- 13.6 Data validation
- Data validation
- 13.7 Validation techniques employed for market sizing
- Validation techniques employed for market sizing
- 13.8 Data synthesis
- Data synthesis
- 13.9 360 degree market analysis
- 360 degree market analysis
- 13.10 List of abbreviations
- List of abbreviations

