|
|
市場調査レポート
商品コード
1626465
プレスブレーキの世界市場 2025-2029年Global Press Brakes Market 2025-2029 |
||||||

|
|||||||
カスタマイズ可能
|
|||||||


| プレスブレーキの世界市場 2025-2029年 |
|
出版日: 2024年12月19日
発行: TechNavio
ページ情報: 英文 210 Pages
納期: 即納可能
|

全表示
- 概要
- 図表
- 目次
プレスブレーキの世界市場 2025-2029年
プレスブレーキ市場は2024-2029年に4億6,350万米ドル、予測期間中のCAGRは4.7%で成長すると予測されます。当レポートでは、プレスブレーキ市場の全体的な分析、市場規模・予測、動向、成長促進要因、課題、約25のベンダーを網羅したベンダー分析などを掲載しています。
現在の市場シナリオ、最新動向と促進要因、市場環境全体に関する最新分析を提供しています。市場は、CNCプレスブレーキの需要増加、SUVやピックアップトラックの需要増加、金属加工製品の需要増加が牽引しています。
| 市場範囲 | |
|---|---|
| 基準年 | 2025 |
| 終了年 | 2029 |
| 予測期間 | 2025-2029 |
| 成長モメンタム | 加速 |
| 前年比2025年 | 4.5% |
| CAGR | 4.7% |
| 増分額 | 4億6,350万米ドル |
本調査では、プレスブレーキとIoTの融合が、今後数年間のプレスブレーキ市場成長を牽引する主要因の1つであるとしています。また、プレスブレーキ用ロボットアームの開発と3Dプリントプレスブレーキツールの普及が市場の大きな需要につながります。
目次
第1章 エグゼクティブサマリー
- 市場概要
第2章 Technavio別分析
- 価格・ライフサイクル・顧客購入バスケット・採用率・購入基準の分析
- インプットの重要性と差別化の要因
- 混乱の要因
- 促進要因と課題の影響
第3章 市場情勢
- 市場エコシステム
- 市場の特徴
- バリューチェーン分析
第4章 市場規模
- 市場の定義
- 市場セグメント分析
- 市場規模 2024
- 市場の見通し 2024-2029
第5章 市場規模実績
- プレスブレーキの世界市場 2019-2023
- 用途別セグメント分析 2019-2023
- 製品別セグメント分析 2019-2023
- 地域別セグメント分析 2019-2023
- 国別セグメント分析 2019-2023
第6章 定性分析
- AIの影響プレスブレーキの世界市場
第7章 ファイブフォース分析
- ファイブフォースの要約
- 買い手の交渉力
- 供給企業の交渉力
- 新規参入業者の脅威
- 代替品の脅威
- 競争の脅威
- 市況
第8章 市場セグメンテーション:用途別
- 市場セグメント
- 比較:用途別
- 自動車産業:市場規模と予測 2024-2029
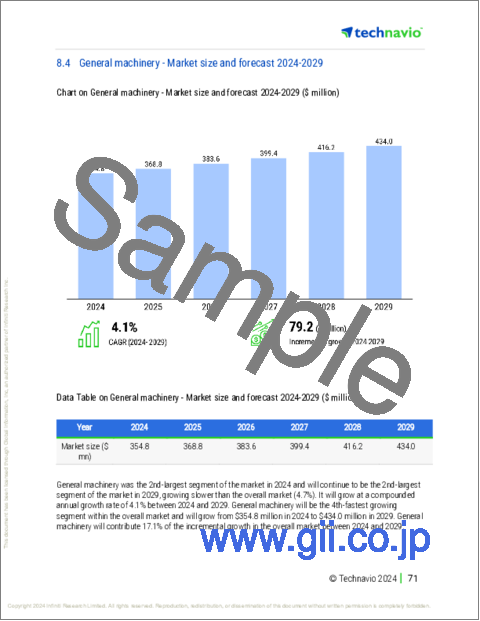
- 一般機械:市場規模と予測 2024-2029
- 輸送機器:市場規模と予測 2024-2029
- 精密工学:市場規模と予測 2024-2029
- その他:市場規模と予測 2024-2029
- 市場機会:用途別
第9章 市場セグメンテーション:製品別
- 市場セグメント
- 比較:製品別
- 油圧式:市場規模と予測 2024-2029
- ハイブリッド:市場規模と予測 2024-2029
- サーボ電動:市場規模と予測 2024-2029
- その他:市場規模と予測 2024-2029
- 市場機会:製品別
第10章 顧客情勢
- 顧客情勢の概要
第11章 地域別情勢
- 地域別セグメンテーション
- 比較:地域別
- アジア太平洋:市場規模と予測 2024-2029
- 欧州:市場規模と予測 2024-2029
- 北米:市場規模と予測 2024-2029
- 南米:市場規模と予測 2024-2029
- 中東・アフリカ:市場規模と予測 2024-2029
- 中国:市場規模と予測 2024-2029
- 米国:市場規模と予測 2024-2029
- ドイツ:市場規模と予測 2024-2029
- 日本:市場規模と予測 2024-2029
- カナダ:市場規模と予測 2024-2029
- インド:市場規模と予測 2024-2029
- 韓国:市場規模と予測 2024-2029
- 英国:市場規模と予測 2024-2029
- フランス:市場規模と予測 2024-2029
- イタリア:市場規模と予測 2024-2029
- 市場機会:地域情勢別
第12章 促進要因・課題・機会・抑制要因
- 市場促進要因
- 市場の課題
- 促進要因と課題の影響
- 市場の機会・抑制要因
第13章 競合情勢
- 概要
- 競合情勢
- 混乱の状況
- 業界のリスク
第14章 競合分析
- 企業プロファイル
- 企業ランキング指数
- 企業の市場ポジショニング
- Accurl CNC Machine Anhui Manufactory Co. Ltd.
- Accurpress Product Sales
- ADIRA METAL FORMING SOLUTIONS S.A.
- Amada Co. Ltd.
- ATM Deutschland Maschinen u. Werkzeuge Vertriebs GmbH
- CINCINNATI Inc.
- Durmazlar Makina AS
- EUROMAC Spa
- Gasparini Industries Srl
- Hindustan Hydraulics Pvt. Ltd.
- JPW Industries Inc.
- LVD Co. nv
- Mitsubishi Corp.
- Prada Nargesa SL
- TRUMPF SE Co. KG
第15章 付録
Exhibits:
- Exhibits1: Executive Summary - Chart on Market Overview
- Exhibits2: Executive Summary - Data Table on Market Overview
- Exhibits3: Executive Summary - Chart on Global Market Characteristics
- Exhibits4: Executive Summary - Chart on Market By Geographical Landscape
- Exhibits5: Executive Summary - Chart on Market Segmentation by Application
- Exhibits6: Executive Summary - Chart on Market Segmentation by Product
- Exhibits7: Executive Summary - Chart on Incremental Growth
- Exhibits8: Executive Summary - Data Table on Incremental Growth
- Exhibits9: Executive Summary - Chart on Company Market Positioning
- Exhibits10: Analysis of price sensitivity, lifecycle, customer purchase basket, adoption rates, and purchase criteria
- Exhibits11: Overview on criticality of inputs and factors of differentiation
- Exhibits12: Overview on factors of disruption
- Exhibits13: Impact of drivers and challenges in 2024 and 2029
- Exhibits14: Parent Market
- Exhibits15: Data Table on - Parent Market
- Exhibits16: Market characteristics analysis
- Exhibits17: Value chain analysis
- Exhibits18: Offerings of companies included in the market definition
- Exhibits19: Market segments
- Exhibits20: Chart on Global - Market size and forecast 2024-2029 ($ million)
- Exhibits21: Data Table on Global - Market size and forecast 2024-2029 ($ million)
- Exhibits22: Chart on Global Market: Year-over-year growth 2024-2029 (%)
- Exhibits23: Data Table on Global Market: Year-over-year growth 2024-2029 (%)
- Exhibits24: Historic Market Size - Data Table on Global Press Brakes Market 2019 - 2023 ($ million)
- Exhibits25: Historic Market Size - Application Segment 2019 - 2023 ($ million)
- Exhibits26: Historic Market Size - Product Segment 2019 - 2023 ($ million)
- Exhibits27: Historic Market Size - Geography Segment 2019 - 2023 ($ million)
- Exhibits28: Historic Market Size - Country Segment 2019 - 2023 ($ million)
- Exhibits29: Five forces analysis - Comparison between 2024 and 2029
- Exhibits30: Bargaining power of buyers - Impact of key factors 2024 and 2029
- Exhibits31: Bargaining power of suppliers - Impact of key factors in 2024 and 2029
- Exhibits32: Threat of new entrants - Impact of key factors in 2024 and 2029
- Exhibits33: Threat of substitutes - Impact of key factors in 2024 and 2029
- Exhibits34: Threat of rivalry - Impact of key factors in 2024 and 2029
- Exhibits35: Chart on Market condition - Five forces 2024 and 2029
- Exhibits36: Chart on Application - Market share 2024-2029 (%)
- Exhibits37: Data Table on Application - Market share 2024-2029 (%)
- Exhibits38: Chart on Comparison by Application
- Exhibits39: Data Table on Comparison by Application
- Exhibits40: Chart on Automotive industry - Market size and forecast 2024-2029 ($ million)
- Exhibits41: Data Table on Automotive industry - Market size and forecast 2024-2029 ($ million)
- Exhibits42: Chart on Automotive industry - Year-over-year growth 2024-2029 (%)
- Exhibits43: Data Table on Automotive industry - Year-over-year growth 2024-2029 (%)
- Exhibits44: Chart on General machinery - Market size and forecast 2024-2029 ($ million)
- Exhibits45: Data Table on General machinery - Market size and forecast 2024-2029 ($ million)
- Exhibits46: Chart on General machinery - Year-over-year growth 2024-2029 (%)
- Exhibits47: Data Table on General machinery - Year-over-year growth 2024-2029 (%)
- Exhibits48: Chart on Transportation equipment - Market size and forecast 2024-2029 ($ million)
- Exhibits49: Data Table on Transportation equipment - Market size and forecast 2024-2029 ($ million)
- Exhibits50: Chart on Transportation equipment - Year-over-year growth 2024-2029 (%)
- Exhibits51: Data Table on Transportation equipment - Year-over-year growth 2024-2029 (%)
- Exhibits52: Chart on Precision engineering - Market size and forecast 2024-2029 ($ million)
- Exhibits53: Data Table on Precision engineering - Market size and forecast 2024-2029 ($ million)
- Exhibits54: Chart on Precision engineering - Year-over-year growth 2024-2029 (%)
- Exhibits55: Data Table on Precision engineering - Year-over-year growth 2024-2029 (%)
- Exhibits56: Chart on Others - Market size and forecast 2024-2029 ($ million)
- Exhibits57: Data Table on Others - Market size and forecast 2024-2029 ($ million)
- Exhibits58: Chart on Others - Year-over-year growth 2024-2029 (%)
- Exhibits59: Data Table on Others - Year-over-year growth 2024-2029 (%)
- Exhibits60: Market opportunity by Application ($ million)
- Exhibits61: Data Table on Market opportunity by Application ($ million)
- Exhibits62: Chart on Product - Market share 2024-2029 (%)
- Exhibits63: Data Table on Product - Market share 2024-2029 (%)
- Exhibits64: Chart on Comparison by Product
- Exhibits65: Data Table on Comparison by Product
- Exhibits66: Chart on Hydraulic - Market size and forecast 2024-2029 ($ million)
- Exhibits67: Data Table on Hydraulic - Market size and forecast 2024-2029 ($ million)
- Exhibits68: Chart on Hydraulic - Year-over-year growth 2024-2029 (%)
- Exhibits69: Data Table on Hydraulic - Year-over-year growth 2024-2029 (%)
- Exhibits70: Chart on Hybrid - Market size and forecast 2024-2029 ($ million)
- Exhibits71: Data Table on Hybrid - Market size and forecast 2024-2029 ($ million)
- Exhibits72: Chart on Hybrid - Year-over-year growth 2024-2029 (%)
- Exhibits73: Data Table on Hybrid - Year-over-year growth 2024-2029 (%)
- Exhibits74: Chart on Servo-electric - Market size and forecast 2024-2029 ($ million)
- Exhibits75: Data Table on Servo-electric - Market size and forecast 2024-2029 ($ million)
- Exhibits76: Chart on Servo-electric - Year-over-year growth 2024-2029 (%)
- Exhibits77: Data Table on Servo-electric - Year-over-year growth 2024-2029 (%)
- Exhibits78: Chart on Others - Market size and forecast 2024-2029 ($ million)
- Exhibits79: Data Table on Others - Market size and forecast 2024-2029 ($ million)
- Exhibits80: Chart on Others - Year-over-year growth 2024-2029 (%)
- Exhibits81: Data Table on Others - Year-over-year growth 2024-2029 (%)
- Exhibits82: Market opportunity by Product ($ million)
- Exhibits83: Data Table on Market opportunity by Product ($ million)
- Exhibits84: Analysis of price sensitivity, lifecycle, customer purchase basket, adoption rates, and purchase criteria
- Exhibits85: Chart on Market share By Geographical Landscape 2024-2029 (%)
- Exhibits86: Data Table on Market share By Geographical Landscape 2024-2029 (%)
- Exhibits87: Chart on Geographic comparison
- Exhibits88: Data Table on Geographic comparison
- Exhibits89: Chart on APAC - Market size and forecast 2024-2029 ($ million)
- Exhibits90: Data Table on APAC - Market size and forecast 2024-2029 ($ million)
- Exhibits91: Chart on APAC - Year-over-year growth 2024-2029 (%)
- Exhibits92: Data Table on APAC - Year-over-year growth 2024-2029 (%)
- Exhibits93: Chart on Europe - Market size and forecast 2024-2029 ($ million)
- Exhibits94: Data Table on Europe - Market size and forecast 2024-2029 ($ million)
- Exhibits95: Chart on Europe - Year-over-year growth 2024-2029 (%)
- Exhibits96: Data Table on Europe - Year-over-year growth 2024-2029 (%)
- Exhibits97: Chart on North America - Market size and forecast 2024-2029 ($ million)
- Exhibits98: Data Table on North America - Market size and forecast 2024-2029 ($ million)
- Exhibits99: Chart on North America - Year-over-year growth 2024-2029 (%)
- Exhibits100: Data Table on North America - Year-over-year growth 2024-2029 (%)
- Exhibits101: Chart on South America - Market size and forecast 2024-2029 ($ million)
- Exhibits102: Data Table on South America - Market size and forecast 2024-2029 ($ million)
- Exhibits103: Chart on South America - Year-over-year growth 2024-2029 (%)
- Exhibits104: Data Table on South America - Year-over-year growth 2024-2029 (%)
- Exhibits105: Chart on Middle East and Africa - Market size and forecast 2024-2029 ($ million)
- Exhibits106: Data Table on Middle East and Africa - Market size and forecast 2024-2029 ($ million)
- Exhibits107: Chart on Middle East and Africa - Year-over-year growth 2024-2029 (%)
- Exhibits108: Data Table on Middle East and Africa - Year-over-year growth 2024-2029 (%)
- Exhibits109: Chart on China - Market size and forecast 2024-2029 ($ million)
- Exhibits110: Data Table on China - Market size and forecast 2024-2029 ($ million)
- Exhibits111: Chart on China - Year-over-year growth 2024-2029 (%)
- Exhibits112: Data Table on China - Year-over-year growth 2024-2029 (%)
- Exhibits113: Chart on US - Market size and forecast 2024-2029 ($ million)
- Exhibits114: Data Table on US - Market size and forecast 2024-2029 ($ million)
- Exhibits115: Chart on US - Year-over-year growth 2024-2029 (%)
- Exhibits116: Data Table on US - Year-over-year growth 2024-2029 (%)
- Exhibits117: Chart on Germany - Market size and forecast 2024-2029 ($ million)
- Exhibits118: Data Table on Germany - Market size and forecast 2024-2029 ($ million)
- Exhibits119: Chart on Germany - Year-over-year growth 2024-2029 (%)
- Exhibits120: Data Table on Germany - Year-over-year growth 2024-2029 (%)
- Exhibits121: Chart on Japan - Market size and forecast 2024-2029 ($ million)
- Exhibits122: Data Table on Japan - Market size and forecast 2024-2029 ($ million)
- Exhibits123: Chart on Japan - Year-over-year growth 2024-2029 (%)
- Exhibits124: Data Table on Japan - Year-over-year growth 2024-2029 (%)
- Exhibits125: Chart on Canada - Market size and forecast 2024-2029 ($ million)
- Exhibits126: Data Table on Canada - Market size and forecast 2024-2029 ($ million)
- Exhibits127: Chart on Canada - Year-over-year growth 2024-2029 (%)
- Exhibits128: Data Table on Canada - Year-over-year growth 2024-2029 (%)
- Exhibits129: Chart on India - Market size and forecast 2024-2029 ($ million)
- Exhibits130: Data Table on India - Market size and forecast 2024-2029 ($ million)
- Exhibits131: Chart on India - Year-over-year growth 2024-2029 (%)
- Exhibits132: Data Table on India - Year-over-year growth 2024-2029 (%)
- Exhibits133: Chart on South Korea - Market size and forecast 2024-2029 ($ million)
- Exhibits134: Data Table on South Korea - Market size and forecast 2024-2029 ($ million)
- Exhibits135: Chart on South Korea - Year-over-year growth 2024-2029 (%)
- Exhibits136: Data Table on South Korea - Year-over-year growth 2024-2029 (%)
- Exhibits137: Chart on UK - Market size and forecast 2024-2029 ($ million)
- Exhibits138: Data Table on UK - Market size and forecast 2024-2029 ($ million)
- Exhibits139: Chart on UK - Year-over-year growth 2024-2029 (%)
- Exhibits140: Data Table on UK - Year-over-year growth 2024-2029 (%)
- Exhibits141: Chart on France - Market size and forecast 2024-2029 ($ million)
- Exhibits142: Data Table on France - Market size and forecast 2024-2029 ($ million)
- Exhibits143: Chart on France - Year-over-year growth 2024-2029 (%)
- Exhibits144: Data Table on France - Year-over-year growth 2024-2029 (%)
- Exhibits145: Chart on Italy - Market size and forecast 2024-2029 ($ million)
- Exhibits146: Data Table on Italy - Market size and forecast 2024-2029 ($ million)
- Exhibits147: Chart on Italy - Year-over-year growth 2024-2029 (%)
- Exhibits148: Data Table on Italy - Year-over-year growth 2024-2029 (%)
- Exhibits149: Market opportunity By Geographical Landscape ($ million)
- Exhibits150: Data Tables on Market opportunity By Geographical Landscape ($ million)
- Exhibits151: Impact of drivers and challenges in 2024 and 2029
- Exhibits152: Overview on criticality of inputs and factors of differentiation
- Exhibits153: Overview on factors of disruption
- Exhibits154: Impact of key risks on business
- Exhibits155: Companies covered
- Exhibits156: Company ranking index
- Exhibits157: Matrix on companies position and classification
- Exhibits158: Accurl CNC Machine Anhui Manufactory Co. Ltd. - Overview
- Exhibits159: Accurl CNC Machine Anhui Manufactory Co. Ltd. - Product / Service
- Exhibits160: Accurl CNC Machine Anhui Manufactory Co. Ltd. - Key offerings
- Exhibits161: SWOT
- Exhibits162: Accurpress Product Sales - Overview
- Exhibits163: Accurpress Product Sales - Product / Service
- Exhibits164: Accurpress Product Sales - Key offerings
- Exhibits165: SWOT
- Exhibits166: ADIRA METAL FORMING SOLUTIONS S.A. - Overview
- Exhibits167: ADIRA METAL FORMING SOLUTIONS S.A. - Product / Service
- Exhibits168: ADIRA METAL FORMING SOLUTIONS S.A. - Key offerings
- Exhibits169: SWOT
- Exhibits170: Amada Co. Ltd. - Overview
- Exhibits171: Amada Co. Ltd. - Business segments
- Exhibits172: Amada Co. Ltd. - Key offerings
- Exhibits173: Amada Co. Ltd. - Segment focus
- Exhibits174: SWOT
- Exhibits175: ATM Deutschland Maschinen u. Werkzeuge Vertriebs GmbH - Overview
- Exhibits176: ATM Deutschland Maschinen u. Werkzeuge Vertriebs GmbH - Product / Service
- Exhibits177: ATM Deutschland Maschinen u. Werkzeuge Vertriebs GmbH - Key offerings
- Exhibits178: SWOT
- Exhibits179: CINCINNATI Inc. - Overview
- Exhibits180: CINCINNATI Inc. - Product / Service
- Exhibits181: CINCINNATI Inc. - Key offerings
- Exhibits182: SWOT
- Exhibits183: Durmazlar Makina AS - Overview
- Exhibits184: Durmazlar Makina AS - Product / Service
- Exhibits185: Durmazlar Makina AS - Key offerings
- Exhibits186: SWOT
- Exhibits187: EUROMAC Spa - Overview
- Exhibits188: EUROMAC Spa - Product / Service
- Exhibits189: EUROMAC Spa - Key offerings
- Exhibits190: SWOT
- Exhibits191: Gasparini Industries Srl - Overview
- Exhibits192: Gasparini Industries Srl - Product / Service
- Exhibits193: Gasparini Industries Srl - Key offerings
- Exhibits194: SWOT
- Exhibits195: Hindustan Hydraulics Pvt. Ltd. - Overview
- Exhibits196: Hindustan Hydraulics Pvt. Ltd. - Product / Service
- Exhibits197: Hindustan Hydraulics Pvt. Ltd. - Key offerings
- Exhibits198: SWOT
- Exhibits199: JPW Industries Inc. - Overview
- Exhibits200: JPW Industries Inc. - Product / Service
- Exhibits201: JPW Industries Inc. - Key news
- Exhibits202: JPW Industries Inc. - Key offerings
- Exhibits203: SWOT
- Exhibits204: LVD Co. nv - Overview
- Exhibits205: LVD Co. nv - Product / Service
- Exhibits206: LVD Co. nv - Key offerings
- Exhibits207: SWOT
- Exhibits208: Mitsubishi Corp. - Overview
- Exhibits209: Mitsubishi Corp. - Business segments
- Exhibits210: Mitsubishi Corp. - Key news
- Exhibits211: Mitsubishi Corp. - Key offerings
- Exhibits212: Mitsubishi Corp. - Segment focus
- Exhibits213: SWOT
- Exhibits214: Prada Nargesa SL - Overview
- Exhibits215: Prada Nargesa SL - Product / Service
- Exhibits216: Prada Nargesa SL - Key offerings
- Exhibits217: SWOT
- Exhibits218: TRUMPF SE Co. KG - Overview
- Exhibits219: TRUMPF SE Co. KG - Product / Service
- Exhibits220: TRUMPF SE Co. KG - Key offerings
- Exhibits221: SWOT
- Exhibits222: Inclusions checklist
- Exhibits223: Exclusions checklist
- Exhibits224: Currency conversion rates for US$
- Exhibits225: Research methodology
- Exhibits226: Information sources
- Exhibits227: Data validation
- Exhibits228: Validation techniques employed for market sizing
- Exhibits229: Data synthesis
- Exhibits230: 360 degree market analysis
- Exhibits231: List of abbreviations
Press Brakes Market 2025-2029
The press brakes market is forecasted to grow by USD 463.5 mn during 2024-2029, accelerating at a CAGR of 4.7% during the forecast period. The report on the press brakes market provides a holistic analysis, market size and forecast, trends, growth drivers, and challenges, as well as vendor analysis covering around 25 vendors.
The report offers an up-to-date analysis regarding the current market scenario, the latest trends and drivers, and the overall market environment. The market is driven by increase in demand for cnc press brakes, growing demand for suvs and pick-up trucks, and growing demand for fabricated metal products.
| Market Scope | |
|---|---|
| Base Year | 2025 |
| End Year | 2029 |
| Series Year | 2025-2029 |
| Growth Momentum | Accelerate |
| YOY 2025 | 4.5% |
| CAGR | 4.7% |
| Incremental Value | $463.5 mn |
Technavio's press brakes market is segmented as below:
By Application
- Automotive industry
- General machinery
- Transportation equipment
- Precision engineering
- Others
By Product
- Hydraulic
- Hybrid
- Servo-electric
- Others
By Geographical Landscape
- APAC
- Europe
- North America
- South America
- Middle East and Africa
This study identifies the incorporation of press brakes with iot as one of the prime reasons driving the press brakes market growth during the next few years. Also, development of robotic arms for press brakes and prevalence of 3d-printed press brake tools will lead to sizable demand in the market.
The report on the press brakes market covers the following areas:
- Press Brakes Market sizing
- Press Brakes Market forecast
- Press Brakes Market industry analysis
The robust vendor analysis is designed to help clients improve their market position, and in line with this, this report provides a detailed analysis of several leading press brakes market vendors that include Accurl CNC Machine Anhui Manufactory Co. Ltd., Accurpress Product Sales, ADIRA METAL FORMING SOLUTIONS S.A., Amada Co. Ltd., ATM Deutschland Maschinen u. Werkzeuge Vertriebs GmbH, Betenbender Manufacturing Inc., CINCINNATI Inc., Durmazlar Makina AS, EUROMAC Spa, Gasparini Industries Srl, Haco NV, Hindustan Hydraulics Pvt. Ltd., JPW Industries Inc., Lodesani and Carreri Srl, LVD Co. nv, Mitsubishi Corp., Prada Nargesa SL, SafanDarley BV, Salvagnini Italia Spa, and TRUMPF SE Co. KG. Also, the press brakes market analysis report includes information on upcoming trends and challenges that will influence market growth. This is to help companies strategize and leverage all forthcoming growth opportunities.
The study was conducted using an objective combination of primary and secondary information including inputs from key participants in the industry. The report contains a comprehensive market and vendor landscape in addition to an analysis of the key vendors.
The publisher presents a detailed picture of the market by the way of study, synthesis, and summation of data from multiple sources by an analysis of key parameters such as profit, pricing, competition, and promotions. It presents various market facets by identifying the key industry influencers. The data presented is comprehensive, reliable, and a result of extensive primary and secondary research. The market research reports provide a complete competitive landscape and an in-depth vendor selection methodology and analysis using qualitative and quantitative research to forecast accurate market growth.
Table of Contents
1 Executive Summary
- 1.1 Market overview
- Executive Summary - Chart on Market Overview
- Executive Summary - Data Table on Market Overview
- Executive Summary - Chart on Global Market Characteristics
- Executive Summary - Chart on Market By Geographical Landscape
- Executive Summary - Chart on Market Segmentation by Application
- Executive Summary - Chart on Market Segmentation by Product
- Executive Summary - Chart on Incremental Growth
- Executive Summary - Data Table on Incremental Growth
- Executive Summary - Chart on Company Market Positioning
2 Technavio Analysis
- 2.1 Analysis of price sensitivity, lifecycle, customer purchase basket, adoption rates, and purchase criteria
- Analysis of price sensitivity, lifecycle, customer purchase basket, adoption rates, and purchase criteria
- 2.2 Criticality of inputs and Factors of differentiation
- Overview on criticality of inputs and factors of differentiation
- 2.3 Factors of disruption
- Overview on factors of disruption
- 2.4 Impact of drivers and challenges
- Impact of drivers and challenges in 2024 and 2029
3 Market Landscape
- 3.1 Market ecosystem
- Parent Market
- Data Table on - Parent Market
- 3.2 Market characteristics
- Market characteristics analysis
- 3.3 Value chain analysis
- Value chain analysis
4 Market Sizing
- 4.1 Market definition
- Offerings of companies included in the market definition
- 4.2 Market segment analysis
- Market segments
- 4.3 Market size 2024
- 4.4 Market outlook: Forecast for 2024-2029
- Chart on Global - Market size and forecast 2024-2029 ($ million)
- Data Table on Global - Market size and forecast 2024-2029 ($ million)
- Chart on Global Market: Year-over-year growth 2024-2029 (%)
- Data Table on Global Market: Year-over-year growth 2024-2029 (%)
5 Historic Market Size
- 5.1 Global Press Brakes Market 2019 - 2023
- Historic Market Size - Data Table on Global Press Brakes Market 2019 - 2023 ($ million)
- 5.2 Application segment analysis 2019 - 2023
- Historic Market Size - Application Segment 2019 - 2023 ($ million)
- 5.3 Product segment analysis 2019 - 2023
- Historic Market Size - Product Segment 2019 - 2023 ($ million)
- 5.4 Geography segment analysis 2019 - 2023
- Historic Market Size - Geography Segment 2019 - 2023 ($ million)
- 5.5 Country segment analysis 2019 - 2023
- Historic Market Size - Country Segment 2019 - 2023 ($ million)
6 Qualitative Analysis
- 6.1 The impact of AI in Global Press Brakes Market
7 Five Forces Analysis
- 7.1 Five forces summary
- Five forces analysis - Comparison between 2024 and 2029
- 7.2 Bargaining power of buyers
- Bargaining power of buyers - Impact of key factors 2024 and 2029
- 7.3 Bargaining power of suppliers
- Bargaining power of suppliers - Impact of key factors in 2024 and 2029
- 7.4 Threat of new entrants
- Threat of new entrants - Impact of key factors in 2024 and 2029
- 7.5 Threat of substitutes
- Threat of substitutes - Impact of key factors in 2024 and 2029
- 7.6 Threat of rivalry
- Threat of rivalry - Impact of key factors in 2024 and 2029
- 7.7 Market condition
- Chart on Market condition - Five forces 2024 and 2029
8 Market Segmentation by Application
- 8.1 Market segments
- Chart on Application - Market share 2024-2029 (%)
- Data Table on Application - Market share 2024-2029 (%)
- 8.2 Comparison by Application
- Chart on Comparison by Application
- Data Table on Comparison by Application
- 8.3 Automotive industry - Market size and forecast 2024-2029
- Chart on Automotive industry - Market size and forecast 2024-2029 ($ million)
- Data Table on Automotive industry - Market size and forecast 2024-2029 ($ million)
- Chart on Automotive industry - Year-over-year growth 2024-2029 (%)
- Data Table on Automotive industry - Year-over-year growth 2024-2029 (%)
- 8.4 General machinery - Market size and forecast 2024-2029
- Chart on General machinery - Market size and forecast 2024-2029 ($ million)
- Data Table on General machinery - Market size and forecast 2024-2029 ($ million)
- Chart on General machinery - Year-over-year growth 2024-2029 (%)
- Data Table on General machinery - Year-over-year growth 2024-2029 (%)
- 8.5 Transportation equipment - Market size and forecast 2024-2029
- Chart on Transportation equipment - Market size and forecast 2024-2029 ($ million)
- Data Table on Transportation equipment - Market size and forecast 2024-2029 ($ million)
- Chart on Transportation equipment - Year-over-year growth 2024-2029 (%)
- Data Table on Transportation equipment - Year-over-year growth 2024-2029 (%)
- 8.6 Precision engineering - Market size and forecast 2024-2029
- Chart on Precision engineering - Market size and forecast 2024-2029 ($ million)
- Data Table on Precision engineering - Market size and forecast 2024-2029 ($ million)
- Chart on Precision engineering - Year-over-year growth 2024-2029 (%)
- Data Table on Precision engineering - Year-over-year growth 2024-2029 (%)
- 8.7 Others - Market size and forecast 2024-2029
- Chart on Others - Market size and forecast 2024-2029 ($ million)
- Data Table on Others - Market size and forecast 2024-2029 ($ million)
- Chart on Others - Year-over-year growth 2024-2029 (%)
- Data Table on Others - Year-over-year growth 2024-2029 (%)
- 8.8 Market opportunity by Application
- Market opportunity by Application ($ million)
- Data Table on Market opportunity by Application ($ million)
9 Market Segmentation by Product
- 9.1 Market segments
- Chart on Product - Market share 2024-2029 (%)
- Data Table on Product - Market share 2024-2029 (%)
- 9.2 Comparison by Product
- Chart on Comparison by Product
- Data Table on Comparison by Product
- 9.3 Hydraulic - Market size and forecast 2024-2029
- Chart on Hydraulic - Market size and forecast 2024-2029 ($ million)
- Data Table on Hydraulic - Market size and forecast 2024-2029 ($ million)
- Chart on Hydraulic - Year-over-year growth 2024-2029 (%)
- Data Table on Hydraulic - Year-over-year growth 2024-2029 (%)
- 9.4 Hybrid - Market size and forecast 2024-2029
- Chart on Hybrid - Market size and forecast 2024-2029 ($ million)
- Data Table on Hybrid - Market size and forecast 2024-2029 ($ million)
- Chart on Hybrid - Year-over-year growth 2024-2029 (%)
- Data Table on Hybrid - Year-over-year growth 2024-2029 (%)
- 9.5 Servo-electric - Market size and forecast 2024-2029
- Chart on Servo-electric - Market size and forecast 2024-2029 ($ million)
- Data Table on Servo-electric - Market size and forecast 2024-2029 ($ million)
- Chart on Servo-electric - Year-over-year growth 2024-2029 (%)
- Data Table on Servo-electric - Year-over-year growth 2024-2029 (%)
- 9.6 Others - Market size and forecast 2024-2029
- Chart on Others - Market size and forecast 2024-2029 ($ million)
- Data Table on Others - Market size and forecast 2024-2029 ($ million)
- Chart on Others - Year-over-year growth 2024-2029 (%)
- Data Table on Others - Year-over-year growth 2024-2029 (%)
- 9.7 Market opportunity by Product
- Market opportunity by Product ($ million)
- Data Table on Market opportunity by Product ($ million)
10 Customer Landscape
- 10.1 Customer landscape overview
- Analysis of price sensitivity, lifecycle, customer purchase basket, adoption rates, and purchase criteria
11 Geographic Landscape
- 11.1 Geographic segmentation
- Chart on Market share By Geographical Landscape 2024-2029 (%)
- Data Table on Market share By Geographical Landscape 2024-2029 (%)
- 11.2 Geographic comparison
- Chart on Geographic comparison
- Data Table on Geographic comparison
- 11.3 APAC - Market size and forecast 2024-2029
- Chart on APAC - Market size and forecast 2024-2029 ($ million)
- Data Table on APAC - Market size and forecast 2024-2029 ($ million)
- Chart on APAC - Year-over-year growth 2024-2029 (%)
- Data Table on APAC - Year-over-year growth 2024-2029 (%)
- 11.4 Europe - Market size and forecast 2024-2029
- Chart on Europe - Market size and forecast 2024-2029 ($ million)
- Data Table on Europe - Market size and forecast 2024-2029 ($ million)
- Chart on Europe - Year-over-year growth 2024-2029 (%)
- Data Table on Europe - Year-over-year growth 2024-2029 (%)
- 11.5 North America - Market size and forecast 2024-2029
- Chart on North America - Market size and forecast 2024-2029 ($ million)
- Data Table on North America - Market size and forecast 2024-2029 ($ million)
- Chart on North America - Year-over-year growth 2024-2029 (%)
- Data Table on North America - Year-over-year growth 2024-2029 (%)
- 11.6 South America - Market size and forecast 2024-2029
- Chart on South America - Market size and forecast 2024-2029 ($ million)
- Data Table on South America - Market size and forecast 2024-2029 ($ million)
- Chart on South America - Year-over-year growth 2024-2029 (%)
- Data Table on South America - Year-over-year growth 2024-2029 (%)
- 11.7 Middle East and Africa - Market size and forecast 2024-2029
- Chart on Middle East and Africa - Market size and forecast 2024-2029 ($ million)
- Data Table on Middle East and Africa - Market size and forecast 2024-2029 ($ million)
- Chart on Middle East and Africa - Year-over-year growth 2024-2029 (%)
- Data Table on Middle East and Africa - Year-over-year growth 2024-2029 (%)
- 11.8 China - Market size and forecast 2024-2029
- Chart on China - Market size and forecast 2024-2029 ($ million)
- Data Table on China - Market size and forecast 2024-2029 ($ million)
- Chart on China - Year-over-year growth 2024-2029 (%)
- Data Table on China - Year-over-year growth 2024-2029 (%)
- 11.9 US - Market size and forecast 2024-2029
- Chart on US - Market size and forecast 2024-2029 ($ million)
- Data Table on US - Market size and forecast 2024-2029 ($ million)
- Chart on US - Year-over-year growth 2024-2029 (%)
- Data Table on US - Year-over-year growth 2024-2029 (%)
- 11.10 Germany - Market size and forecast 2024-2029
- Chart on Germany - Market size and forecast 2024-2029 ($ million)
- Data Table on Germany - Market size and forecast 2024-2029 ($ million)
- Chart on Germany - Year-over-year growth 2024-2029 (%)
- Data Table on Germany - Year-over-year growth 2024-2029 (%)
- 11.11 Japan - Market size and forecast 2024-2029
- Chart on Japan - Market size and forecast 2024-2029 ($ million)
- Data Table on Japan - Market size and forecast 2024-2029 ($ million)
- Chart on Japan - Year-over-year growth 2024-2029 (%)
- Data Table on Japan - Year-over-year growth 2024-2029 (%)
- 11.12 Canada - Market size and forecast 2024-2029
- Chart on Canada - Market size and forecast 2024-2029 ($ million)
- Data Table on Canada - Market size and forecast 2024-2029 ($ million)
- Chart on Canada - Year-over-year growth 2024-2029 (%)
- Data Table on Canada - Year-over-year growth 2024-2029 (%)
- 11.13 India - Market size and forecast 2024-2029
- Chart on India - Market size and forecast 2024-2029 ($ million)
- Data Table on India - Market size and forecast 2024-2029 ($ million)
- Chart on India - Year-over-year growth 2024-2029 (%)
- Data Table on India - Year-over-year growth 2024-2029 (%)
- 11.14 South Korea - Market size and forecast 2024-2029
- Chart on South Korea - Market size and forecast 2024-2029 ($ million)
- Data Table on South Korea - Market size and forecast 2024-2029 ($ million)
- Chart on South Korea - Year-over-year growth 2024-2029 (%)
- Data Table on South Korea - Year-over-year growth 2024-2029 (%)
- 11.15 UK - Market size and forecast 2024-2029
- Chart on UK - Market size and forecast 2024-2029 ($ million)
- Data Table on UK - Market size and forecast 2024-2029 ($ million)
- Chart on UK - Year-over-year growth 2024-2029 (%)
- Data Table on UK - Year-over-year growth 2024-2029 (%)
- 11.16 France - Market size and forecast 2024-2029
- Chart on France - Market size and forecast 2024-2029 ($ million)
- Data Table on France - Market size and forecast 2024-2029 ($ million)
- Chart on France - Year-over-year growth 2024-2029 (%)
- Data Table on France - Year-over-year growth 2024-2029 (%)
- 11.17 Italy - Market size and forecast 2024-2029
- Chart on Italy - Market size and forecast 2024-2029 ($ million)
- Data Table on Italy - Market size and forecast 2024-2029 ($ million)
- Chart on Italy - Year-over-year growth 2024-2029 (%)
- Data Table on Italy - Year-over-year growth 2024-2029 (%)
- 11.18 Market opportunity By Geographical Landscape
- Market opportunity By Geographical Landscape ($ million)
- Data Tables on Market opportunity By Geographical Landscape ($ million)
12 Drivers, Challenges, and Opportunity/Restraints
- 12.1 Market drivers
- 12.2 Market challenges
- 12.3 Impact of drivers and challenges
- Impact of drivers and challenges in 2024 and 2029
- 12.4 Market opportunities/restraints
13 Competitive Landscape
- 13.1 Overview
- 13.2 Competitive Landscape
- Overview on criticality of inputs and factors of differentiation
- 13.3 Landscape disruption
- Overview on factors of disruption
- 13.4 Industry risks
- Impact of key risks on business
14 Competitive Analysis
- 14.1 Companies profiled
- Companies covered
- 14.2 Company ranking index
- Company ranking index
- 14.3 Market positioning of companies
- Matrix on companies position and classification
- 14.4 Accurl CNC Machine Anhui Manufactory Co. Ltd.
- Accurl CNC Machine Anhui Manufactory Co. Ltd. - Overview
- Accurl CNC Machine Anhui Manufactory Co. Ltd. - Product / Service
- Accurl CNC Machine Anhui Manufactory Co. Ltd. - Key offerings
- SWOT
- 14.5 Accurpress Product Sales
- Accurpress Product Sales - Overview
- Accurpress Product Sales - Product / Service
- Accurpress Product Sales - Key offerings
- SWOT
- 14.6 ADIRA METAL FORMING SOLUTIONS S.A.
- ADIRA METAL FORMING SOLUTIONS S.A. - Overview
- ADIRA METAL FORMING SOLUTIONS S.A. - Product / Service
- ADIRA METAL FORMING SOLUTIONS S.A. - Key offerings
- SWOT
- 14.7 Amada Co. Ltd.
- Amada Co. Ltd. - Overview
- Amada Co. Ltd. - Business segments
- Amada Co. Ltd. - Key offerings
- Amada Co. Ltd. - Segment focus
- SWOT
- 14.8 ATM Deutschland Maschinen u. Werkzeuge Vertriebs GmbH
- ATM Deutschland Maschinen u. Werkzeuge Vertriebs GmbH - Overview
- ATM Deutschland Maschinen u. Werkzeuge Vertriebs GmbH - Product / Service
- ATM Deutschland Maschinen u. Werkzeuge Vertriebs GmbH - Key offerings
- SWOT
- 14.9 CINCINNATI Inc.
- CINCINNATI Inc. - Overview
- CINCINNATI Inc. - Product / Service
- CINCINNATI Inc. - Key offerings
- SWOT
- 14.10 Durmazlar Makina AS
- Durmazlar Makina AS - Overview
- Durmazlar Makina AS - Product / Service
- Durmazlar Makina AS - Key offerings
- SWOT
- 14.11 EUROMAC Spa
- EUROMAC Spa - Overview
- EUROMAC Spa - Product / Service
- EUROMAC Spa - Key offerings
- SWOT
- 14.12 Gasparini Industries Srl
- Gasparini Industries Srl - Overview
- Gasparini Industries Srl - Product / Service
- Gasparini Industries Srl - Key offerings
- SWOT
- 14.13 Hindustan Hydraulics Pvt. Ltd.
- Hindustan Hydraulics Pvt. Ltd. - Overview
- Hindustan Hydraulics Pvt. Ltd. - Product / Service
- Hindustan Hydraulics Pvt. Ltd. - Key offerings
- SWOT
- 14.14 JPW Industries Inc.
- JPW Industries Inc. - Overview
- JPW Industries Inc. - Product / Service
- JPW Industries Inc. - Key news
- JPW Industries Inc. - Key offerings
- SWOT
- 14.15 LVD Co. nv
- LVD Co. nv - Overview
- LVD Co. nv - Product / Service
- LVD Co. nv - Key offerings
- SWOT
- 14.16 Mitsubishi Corp.
- Mitsubishi Corp. - Overview
- Mitsubishi Corp. - Business segments
- Mitsubishi Corp. - Key news
- Mitsubishi Corp. - Key offerings
- Mitsubishi Corp. - Segment focus
- SWOT
- 14.17 Prada Nargesa SL
- Prada Nargesa SL - Overview
- Prada Nargesa SL - Product / Service
- Prada Nargesa SL - Key offerings
- SWOT
- 14.18 TRUMPF SE Co. KG
- TRUMPF SE Co. KG - Overview
- TRUMPF SE Co. KG - Product / Service
- TRUMPF SE Co. KG - Key offerings
- SWOT
15 Appendix
- 15.1 Scope of the report
- 15.2 Inclusions and exclusions checklist
- Inclusions checklist
- Exclusions checklist
- 15.3 Currency conversion rates for US$
- Currency conversion rates for US$
- 15.4 Research methodology
- Research methodology
- 15.5 Data procurement
- Information sources
- 15.6 Data validation
- Data validation
- 15.7 Validation techniques employed for market sizing
- Validation techniques employed for market sizing
- 15.8 Data synthesis
- Data synthesis
- 15.9 360 degree market analysis
- 360 degree market analysis
- 15.10 List of abbreviations
- List of abbreviations
- o Strong financial performance

