|
|
市場調査レポート
商品コード
1524741
低発泡界面活性剤の世界市場 2024-2028Global low foam surfactants market 2024-2028 |
||||||
|
|||||||
カスタマイズ可能
|
|||||||

| 低発泡界面活性剤の世界市場 2024-2028 |
|
出版日: 2024年07月09日
発行: TechNavio
ページ情報: 英文 191 Pages
納期: 即納可能
|

全表示
- 概要
- 図表
- 目次
低発泡界面活性剤市場は2023-2028年に62億2,730万米ドル、予測期間中のCAGRは6.26%で成長すると予測されます。
当レポートでは、低発泡界面活性剤市場の全体的な分析、市場規模・予測、動向、成長促進要因、課題、約25のベンダーを網羅したベンダー分析などを掲載しています。
現在の市場シナリオ、最新動向と促進要因、市場環境全体に関する最新分析を提供しています。市場は、パーソナルケア製品に対する需要の高まり、新興経済諸国からの需要の高まり、洗剤や洗浄剤における低発泡界面活性剤の使用の増加によって牽引されています。
| 市場範囲 | |
|---|---|
| 基準年 | 2024 |
| 終了年 | 2028 |
| 予測期間 | 2024-2028 |
| 成長モメンタム | 加速 |
| 前年比2024年 | 5.79% |
| CAGR | 6.26% |
| 増分額 | 62億2,730万米ドル |
本調査では、研究開発活動の活発化が今後数年間の低発泡界面活性剤市場成長を牽引する主要因の1つであるとしています。また、ニッチ用途からの需要の高まりとバイオベースの界面活性剤への需要の高まりは、市場の大きな需要につながります。
目次
第1章 エグゼクティブサマリー
- 市場概要
第2章 市場情勢
- 市場エコシステム
- 市場の特徴
- バリューチェーン分析
第3章 市場規模の評価
- 市場の定義
- 市場セグメント分析
- 市場規模 2023
- 市場の見通し 2023-2028
第4章 市場規模実績
- 世界低発泡界面活性剤市場 2018-2022
- 用途別セグメント分析 2018-2022
- タイプ別セグメント分析 2018-2022
- 地域別セグメント分析 2018-2022
- 国別セグメント分析 2018-2022
第5章 ファイブフォース分析
- ファイブフォースの要約
- 買い手の交渉力
- 供給企業の交渉力
- 新規参入業者の脅威
- 代替品の脅威
- 競争の脅威
- 市況
第6章 市場セグメンテーション:用途別
- 市場セグメンテーション
- 比較:用途別
- ホームケアとパーソナルケア:市場規模と予測 2023-2028
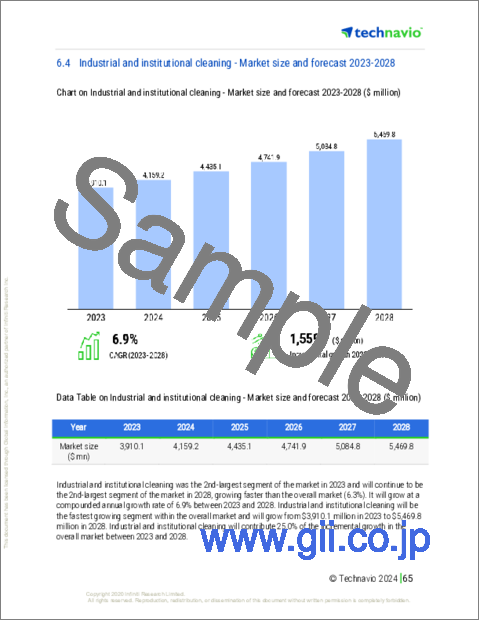
- 産業および施設の清掃:市場規模と予測 2023-2028
- 食品・乳製品の清掃:市場規模と予測 2023-2028
- その他:市場規模と予測 2023-2028
- 市場機会:用途別
第7章 市場セグメンテーション:タイプ別
- 市場セグメンテーション
- 比較:タイプ別
- 非イオン性:市場規模と予測 2023-2028
- カチオン:市場規模と予測 2023-2028
- 両性:市場規模と予測 2023-2028
- 市場機会:タイプ別
第8章 顧客情勢
- 顧客情勢の概要
第9章 地域別情勢
- 地域別セグメンテーション
- 地域別比較
- アジア太平洋:市場規模と予測 2023-2028
- 欧州:市場規模と予測 2023-2028
- 北米:市場規模と予測 2023-2028
- 中東・アフリカ:市場規模と予測 2023-2028
- 南米:市場規模と予測 2023-2028
- 中国:市場規模と予測 2023-2028
- ドイツ:市場規模と予測 2023-2028
- 米国:市場規模と予測 2023-2028
- ロシア:市場規模と予測 2023-2028
- 日本:市場規模と予測 2023-2028
- 市場機会:地域情勢別
第10章 促進要因・課題・機会・抑制要因
- 市場促進要因
- 市場の課題
- 促進要因と課題の影響
- 市場の機会・抑制要因
第11章 競合情勢
- 概要
- 競合情勢
- 混乱の状況
- 業界のリスク
第12章 競合分析
- 企業プロファイル
- 企業の市場ポジショニング
- Air Products and Chemicals Inc.
- Akzo Nobel NV
- Arkema SA
- Ashland Inc.
- BASF SE
- Clariant International Ltd.
- Croda International Plc
- Dow Inc.
- Galaxy Surfactants Ltd.
- Huntsman Corp
- Innospec Inc.
- Kao Corp.
- RAG Stiftung
- Solvay SA
- Stepan Co.
第13章 付録
Exhibits:
- Exhibits1: Executive Summary - Chart on Market Overview
- Exhibits2: Executive Summary - Data Table on Market Overview
- Exhibits3: Executive Summary - Chart on Global Market Characteristics
- Exhibits4: Executive Summary - Chart on Market By Geographical Landscape
- Exhibits5: Executive Summary - Chart on Market Segmentation by Application
- Exhibits6: Executive Summary - Chart on Market Segmentation by Type
- Exhibits7: Executive Summary - Chart on Incremental Growth
- Exhibits8: Executive Summary - Data Table on Incremental Growth
- Exhibits9: Executive Summary - Chart on Company Market Positioning
- Exhibits10: Parent Market
- Exhibits11: Data Table on - Parent Market
- Exhibits12: Market characteristics analysis
- Exhibits13: Value Chain Analysis
- Exhibits14: Offerings of companies included in the market definition
- Exhibits15: Market segments
- Exhibits16: Chart on Global - Market size and forecast 2023-2028 ($ million)
- Exhibits17: Data Table on Global - Market size and forecast 2023-2028 ($ million)
- Exhibits18: Chart on Global Market: Year-over-year growth 2023-2028 (%)
- Exhibits19: Data Table on Global Market: Year-over-year growth 2023-2028 (%)
- Exhibits20: Historic Market Size - Data Table on Global Low Foam Surfactants Market 2018 - 2022 ($ million)
- Exhibits21: Historic Market Size - Application Segment 2018 - 2022 ($ million)
- Exhibits22: Historic Market Size - Type Segment 2018 - 2022 ($ million)
- Exhibits23: Historic Market Size - Geography Segment 2018 - 2022 ($ million)
- Exhibits24: Historic Market Size - Country Segment 2018 - 2022 ($ million)
- Exhibits25: Five forces analysis - Comparison between 2023 and 2028
- Exhibits26: Bargaining power of buyers - Impact of key factors 2023 and 2028
- Exhibits27: Bargaining power of suppliers - Impact of key factors in 2023 and 2028
- Exhibits28: Threat of new entrants - Impact of key factors in 2023 and 2028
- Exhibits29: Threat of substitutes - Impact of key factors in 2023 and 2028
- Exhibits30: Threat of rivalry - Impact of key factors in 2023 and 2028
- Exhibits31: Chart on Market condition - Five forces 2023 and 2028
- Exhibits32: Chart on Application - Market share 2023-2028 (%)
- Exhibits33: Data Table on Application - Market share 2023-2028 (%)
- Exhibits34: Chart on Comparison by Application
- Exhibits35: Data Table on Comparison by Application
- Exhibits36: Chart on Home and personal care - Market size and forecast 2023-2028 ($ million)
- Exhibits37: Data Table on Home and personal care - Market size and forecast 2023-2028 ($ million)
- Exhibits38: Chart on Home and personal care - Year-over-year growth 2023-2028 (%)
- Exhibits39: Data Table on Home and personal care - Year-over-year growth 2023-2028 (%)
- Exhibits40: Chart on Industrial and institutional cleaning - Market size and forecast 2023-2028 ($ million)
- Exhibits41: Data Table on Industrial and institutional cleaning - Market size and forecast 2023-2028 ($ million)
- Exhibits42: Chart on Industrial and institutional cleaning - Year-over-year growth 2023-2028 (%)
- Exhibits43: Data Table on Industrial and institutional cleaning - Year-over-year growth 2023-2028 (%)
- Exhibits44: Chart on Food and dairy cleaning - Market size and forecast 2023-2028 ($ million)
- Exhibits45: Data Table on Food and dairy cleaning - Market size and forecast 2023-2028 ($ million)
- Exhibits46: Chart on Food and dairy cleaning - Year-over-year growth 2023-2028 (%)
- Exhibits47: Data Table on Food and dairy cleaning - Year-over-year growth 2023-2028 (%)
- Exhibits48: Chart on Others - Market size and forecast 2023-2028 ($ million)
- Exhibits49: Data Table on Others - Market size and forecast 2023-2028 ($ million)
- Exhibits50: Chart on Others - Year-over-year growth 2023-2028 (%)
- Exhibits51: Data Table on Others - Year-over-year growth 2023-2028 (%)
- Exhibits52: Market opportunity by Application ($ million)
- Exhibits53: Data Table on Market opportunity by Application ($ million)
- Exhibits54: Chart on Type - Market share 2023-2028 (%)
- Exhibits55: Data Table on Type - Market share 2023-2028 (%)
- Exhibits56: Chart on Comparison by Type
- Exhibits57: Data Table on Comparison by Type
- Exhibits58: Chart on Non-ionic - Market size and forecast 2023-2028 ($ million)
- Exhibits59: Data Table on Non-ionic - Market size and forecast 2023-2028 ($ million)
- Exhibits60: Chart on Non-ionic - Year-over-year growth 2023-2028 (%)
- Exhibits61: Data Table on Non-ionic - Year-over-year growth 2023-2028 (%)
- Exhibits62: Chart on Cationic - Market size and forecast 2023-2028 ($ million)
- Exhibits63: Data Table on Cationic - Market size and forecast 2023-2028 ($ million)
- Exhibits64: Chart on Cationic - Year-over-year growth 2023-2028 (%)
- Exhibits65: Data Table on Cationic - Year-over-year growth 2023-2028 (%)
- Exhibits66: Chart on Amphoteric - Market size and forecast 2023-2028 ($ million)
- Exhibits67: Data Table on Amphoteric - Market size and forecast 2023-2028 ($ million)
- Exhibits68: Chart on Amphoteric - Year-over-year growth 2023-2028 (%)
- Exhibits69: Data Table on Amphoteric - Year-over-year growth 2023-2028 (%)
- Exhibits70: Market opportunity by Type ($ million)
- Exhibits71: Data Table on Market opportunity by Type ($ million)
- Exhibits72: Analysis of price sensitivity, lifecycle, customer purchase basket, adoption rates, and purchase criteria
- Exhibits73: Chart on Market share By Geographical Landscape 2023-2028 (%)
- Exhibits74: Data Table on Market share By Geographical Landscape 2023-2028 (%)
- Exhibits75: Chart on Geographic comparison
- Exhibits76: Data Table on Geographic comparison
- Exhibits77: Chart on APAC - Market size and forecast 2023-2028 ($ million)
- Exhibits78: Data Table on APAC - Market size and forecast 2023-2028 ($ million)
- Exhibits79: Chart on APAC - Year-over-year growth 2023-2028 (%)
- Exhibits80: Data Table on APAC - Year-over-year growth 2023-2028 (%)
- Exhibits81: Chart on Europe - Market size and forecast 2023-2028 ($ million)
- Exhibits82: Data Table on Europe - Market size and forecast 2023-2028 ($ million)
- Exhibits83: Chart on Europe - Year-over-year growth 2023-2028 (%)
- Exhibits84: Data Table on Europe - Year-over-year growth 2023-2028 (%)
- Exhibits85: Chart on North America - Market size and forecast 2023-2028 ($ million)
- Exhibits86: Data Table on North America - Market size and forecast 2023-2028 ($ million)
- Exhibits87: Chart on North America - Year-over-year growth 2023-2028 (%)
- Exhibits88: Data Table on North America - Year-over-year growth 2023-2028 (%)
- Exhibits89: Chart on Middle East and Africa - Market size and forecast 2023-2028 ($ million)
- Exhibits90: Data Table on Middle East and Africa - Market size and forecast 2023-2028 ($ million)
- Exhibits91: Chart on Middle East and Africa - Year-over-year growth 2023-2028 (%)
- Exhibits92: Data Table on Middle East and Africa - Year-over-year growth 2023-2028 (%)
- Exhibits93: Chart on South America - Market size and forecast 2023-2028 ($ million)
- Exhibits94: Data Table on South America - Market size and forecast 2023-2028 ($ million)
- Exhibits95: Chart on South America - Year-over-year growth 2023-2028 (%)
- Exhibits96: Data Table on South America - Year-over-year growth 2023-2028 (%)
- Exhibits97: Chart on China - Market size and forecast 2023-2028 ($ million)
- Exhibits98: Data Table on China - Market size and forecast 2023-2028 ($ million)
- Exhibits99: Chart on China - Year-over-year growth 2023-2028 (%)
- Exhibits100: Data Table on China - Year-over-year growth 2023-2028 (%)
- Exhibits101: Chart on Germany - Market size and forecast 2023-2028 ($ million)
- Exhibits102: Data Table on Germany - Market size and forecast 2023-2028 ($ million)
- Exhibits103: Chart on Germany - Year-over-year growth 2023-2028 (%)
- Exhibits104: Data Table on Germany - Year-over-year growth 2023-2028 (%)
- Exhibits105: Chart on US - Market size and forecast 2023-2028 ($ million)
- Exhibits106: Data Table on US - Market size and forecast 2023-2028 ($ million)
- Exhibits107: Chart on US - Year-over-year growth 2023-2028 (%)
- Exhibits108: Data Table on US - Year-over-year growth 2023-2028 (%)
- Exhibits109: Chart on Russia - Market size and forecast 2023-2028 ($ million)
- Exhibits110: Data Table on Russia - Market size and forecast 2023-2028 ($ million)
- Exhibits111: Chart on Russia - Year-over-year growth 2023-2028 (%)
- Exhibits112: Data Table on Russia - Year-over-year growth 2023-2028 (%)
- Exhibits113: Chart on Japan - Market size and forecast 2023-2028 ($ million)
- Exhibits114: Data Table on Japan - Market size and forecast 2023-2028 ($ million)
- Exhibits115: Chart on Japan - Year-over-year growth 2023-2028 (%)
- Exhibits116: Data Table on Japan - Year-over-year growth 2023-2028 (%)
- Exhibits117: Market opportunity By Geographical Landscape ($ million)
- Exhibits118: Data Tables on Market opportunity By Geographical Landscape ($ million)
- Exhibits119: Impact of drivers and challenges in 2023 and 2028
- Exhibits120: Overview on criticality of inputs and factors of differentiation
- Exhibits121: Overview on factors of disruption
- Exhibits122: Impact of key risks on business
- Exhibits123: Companies covered
- Exhibits124: Matrix on companies position and classification
- Exhibits125: Air Products and Chemicals Inc. - Overview
- Exhibits126: Air Products and Chemicals Inc. - Business segments
- Exhibits127: Air Products and Chemicals Inc. - Key news
- Exhibits128: Air Products and Chemicals Inc. - Key offerings
- Exhibits129: Air Products and Chemicals Inc. - Segment focus
- Exhibits130: Akzo Nobel NV - Overview
- Exhibits131: Akzo Nobel NV - Business segments
- Exhibits132: Akzo Nobel NV - Key news
- Exhibits133: Akzo Nobel NV - Key offerings
- Exhibits134: Akzo Nobel NV - Segment focus
- Exhibits135: Arkema SA - Overview
- Exhibits136: Arkema SA - Business segments
- Exhibits137: Arkema SA - Key news
- Exhibits138: Arkema SA - Key offerings
- Exhibits139: Arkema SA - Segment focus
- Exhibits140: Ashland Inc. - Overview
- Exhibits141: Ashland Inc. - Business segments
- Exhibits142: Ashland Inc. - Key news
- Exhibits143: Ashland Inc. - Key offerings
- Exhibits144: Ashland Inc. - Segment focus
- Exhibits145: BASF SE - Overview
- Exhibits146: BASF SE - Business segments
- Exhibits147: BASF SE - Key news
- Exhibits148: BASF SE - Key offerings
- Exhibits149: BASF SE - Segment focus
- Exhibits150: Clariant International Ltd. - Overview
- Exhibits151: Clariant International Ltd. - Business segments
- Exhibits152: Clariant International Ltd. - Key news
- Exhibits153: Clariant International Ltd. - Key offerings
- Exhibits154: Clariant International Ltd. - Segment focus
- Exhibits155: Croda International Plc - Overview
- Exhibits156: Croda International Plc - Business segments
- Exhibits157: Croda International Plc - Key news
- Exhibits158: Croda International Plc - Key offerings
- Exhibits159: Croda International Plc - Segment focus
- Exhibits160: Dow Inc. - Overview
- Exhibits161: Dow Inc. - Business segments
- Exhibits162: Dow Inc. - Key news
- Exhibits163: Dow Inc. - Key offerings
- Exhibits164: Dow Inc. - Segment focus
- Exhibits165: Galaxy Surfactants Ltd. - Overview
- Exhibits166: Galaxy Surfactants Ltd. - Product / Service
- Exhibits167: Galaxy Surfactants Ltd. - Key offerings
- Exhibits168: Huntsman Corp - Overview
- Exhibits169: Huntsman Corp - Business segments
- Exhibits170: Huntsman Corp - Key news
- Exhibits171: Huntsman Corp - Key offerings
- Exhibits172: Huntsman Corp - Segment focus
- Exhibits173: Innospec Inc. - Overview
- Exhibits174: Innospec Inc. - Business segments
- Exhibits175: Innospec Inc. - Key offerings
- Exhibits176: Innospec Inc. - Segment focus
- Exhibits177: Kao Corp. - Overview
- Exhibits178: Kao Corp. - Business segments
- Exhibits179: Kao Corp. - Key news
- Exhibits180: Kao Corp. - Key offerings
- Exhibits181: Kao Corp. - Segment focus
- Exhibits182: RAG Stiftung - Overview
- Exhibits183: RAG Stiftung - Product / Service
- Exhibits184: RAG Stiftung - Key offerings
- Exhibits185: Solvay SA - Overview
- Exhibits186: Solvay SA - Business segments
- Exhibits187: Solvay SA - Key news
- Exhibits188: Solvay SA - Key offerings
- Exhibits189: Solvay SA - Segment focus
- Exhibits190: Stepan Co. - Overview
- Exhibits191: Stepan Co. - Business segments
- Exhibits192: Stepan Co. - Key news
- Exhibits193: Stepan Co. - Key offerings
- Exhibits194: Stepan Co. - Segment focus
- Exhibits195: Inclusions checklist
- Exhibits196: Exclusions checklist
- Exhibits197: Currency conversion rates for US$
- Exhibits198: Research methodology
- Exhibits199: Information sources
- Exhibits200: Data validation
- Exhibits201: Validation techniques employed for market sizing
- Exhibits202: Data synthesis
- Exhibits203: 360 degree market analysis
- Exhibits204: List of abbreviations
The low foam surfactants market is forecasted to grow by USD 6227.3 mn during 2023-2028, accelerating at a CAGR of 6.26% during the forecast period. The report on the low foam surfactants market provides a holistic analysis, market size and forecast, trends, growth drivers, and challenges, as well as vendor analysis covering around 25 vendors.
The report offers an up-to-date analysis regarding the current market scenario, the latest trends and drivers, and the overall market environment. The market is driven by rising demand for personal care products, rising demand from developing economies., and increasing use of low foam surfactants in detergents and cleaning agents..
Technavio's low foam surfactants market is segmented as below:
| Market Scope | |
|---|---|
| Base Year | 2024 |
| End Year | 2028 |
| Series Year | 2024-2028 |
| Growth Momentum | Accelerate |
| YOY 2024 | 5.79% |
| CAGR | 6.26% |
| Incremental Value | $6227.3mn |
By Application
- Home and personal care
- Industrial and institutional cleaning
- Food and dairy cleaning
- Others
By Type
- Non-ionic
- Cationic
- Amphoteric
By Geographical Landscape
- APAC
- Europe
- North America
- Middle East and Africa
- South America
This study identifies the increasing r and d activities as one of the prime reasons driving the low foam surfactants market growth during the next few years. Also, rising demand from niche applications and growing demand for bio-based surfactants will lead to sizable demand in the market.
The report on the low foam surfactants market covers the following areas:
- Low foam surfactants market sizing
- Low foam surfactants market forecast
- Low foam surfactants market industry analysis
The robust vendor analysis is designed to help clients improve their market position, and in line with this, this report provides a detailed analysis of several leading low foam surfactants market vendors that include Air Products and Chemicals Inc., Akzo Nobel NV, Arkema SA, Ashland Inc., BASF SE, Clariant International Ltd., Croda International Plc, Dow Inc., Enaspol A.S., EOC Group, Galaxy Surfactants Ltd., Huntsman Corp, Innospec Inc., Kao Corp., KLK Oleo, Marubeni Corp., Nufarm Ltd., RAG Stiftung, Solvay SA, Stepan Co., and The Lubrizol Corp.. Also, the low foam surfactants market analysis report includes information on upcoming trends and challenges that will influence market growth. This is to help companies strategize and leverage all forthcoming growth opportunities.
The study was conducted using an objective combination of primary and secondary information including inputs from key participants in the industry. The report contains a comprehensive market and vendor landscape in addition to an analysis of the key vendors.
The publisher presents a detailed picture of the market by the way of study, synthesis, and summation of data from multiple sources by an analysis of key parameters such as profit, pricing, competition, and promotions. It presents various market facets by identifying the key industry influencers. The data presented is comprehensive, reliable, and a result of extensive research - both primary and secondary. The market research reports provide a complete competitive landscape and an in-depth vendor selection methodology and analysis using qualitative and quantitative research to forecast the accurate market growth.
Table of Contents
1 Executive Summary
- 1.1 Market overview
- Executive Summary - Chart on Market Overview
- Executive Summary - Data Table on Market Overview
- Executive Summary - Chart on Global Market Characteristics
- Executive Summary - Chart on Market By Geographical Landscape
- Executive Summary - Chart on Market Segmentation by Application
- Executive Summary - Chart on Market Segmentation by Type
- Executive Summary - Chart on Incremental Growth
- Executive Summary - Data Table on Incremental Growth
- Executive Summary - Chart on Company Market Positioning
2 Market Landscape
- 2.1 Market ecosystem
- Parent Market
- Data Table on - Parent Market
- 2.2 Market characteristics
- Market characteristics analysis
- 2.3 Value chain analysis
- Value Chain Analysis
3 Market Sizing
- 3.1 Market definition
- Offerings of companies included in the market definition
- 3.2 Market segment analysis
- Market segments
- 3.3 Market size 2023
- 3.4 Market outlook: Forecast for 2023-2028
- Chart on Global - Market size and forecast 2023-2028 ($ million)
- Data Table on Global - Market size and forecast 2023-2028 ($ million)
- Chart on Global Market: Year-over-year growth 2023-2028 (%)
- Data Table on Global Market: Year-over-year growth 2023-2028 (%)
4 Historic Market Size
- 4.1 Global Low Foam Surfactants Market 2018 - 2022
- Historic Market Size - Data Table on Global Low Foam Surfactants Market 2018 - 2022 ($ million)
- 4.2 Application segment analysis 2018 - 2022
- Historic Market Size - Application Segment 2018 - 2022 ($ million)
- 4.3 Type segment analysis 2018 - 2022
- Historic Market Size - Type Segment 2018 - 2022 ($ million)
- 4.4 Geography segment analysis 2018 - 2022
- Historic Market Size - Geography Segment 2018 - 2022 ($ million)
- 4.5 Country segment analysis 2018 - 2022
- Historic Market Size - Country Segment 2018 - 2022 ($ million)
5 Five Forces Analysis
- 5.1 Five forces summary
- Five forces analysis - Comparison between 2023 and 2028
- 5.2 Bargaining power of buyers
- Bargaining power of buyers - Impact of key factors 2023 and 2028
- 5.3 Bargaining power of suppliers
- Bargaining power of suppliers - Impact of key factors in 2023 and 2028
- 5.4 Threat of new entrants
- Threat of new entrants - Impact of key factors in 2023 and 2028
- 5.5 Threat of substitutes
- Threat of substitutes - Impact of key factors in 2023 and 2028
- 5.6 Threat of rivalry
- Threat of rivalry - Impact of key factors in 2023 and 2028
- 5.7 Market condition
- Chart on Market condition - Five forces 2023 and 2028
6 Market Segmentation by Application
- 6.1 Market segments
- Chart on Application - Market share 2023-2028 (%)
- Data Table on Application - Market share 2023-2028 (%)
- 6.2 Comparison by Application
- Chart on Comparison by Application
- Data Table on Comparison by Application
- 6.3 Home and personal care - Market size and forecast 2023-2028
- Chart on Home and personal care - Market size and forecast 2023-2028 ($ million)
- Data Table on Home and personal care - Market size and forecast 2023-2028 ($ million)
- Chart on Home and personal care - Year-over-year growth 2023-2028 (%)
- Data Table on Home and personal care - Year-over-year growth 2023-2028 (%)
- 6.4 Industrial and institutional cleaning - Market size and forecast 2023-2028
- Chart on Industrial and institutional cleaning - Market size and forecast 2023-2028 ($ million)
- Data Table on Industrial and institutional cleaning - Market size and forecast 2023-2028 ($ million)
- Chart on Industrial and institutional cleaning - Year-over-year growth 2023-2028 (%)
- Data Table on Industrial and institutional cleaning - Year-over-year growth 2023-2028 (%)
- 6.5 Food and dairy cleaning - Market size and forecast 2023-2028
- Chart on Food and dairy cleaning - Market size and forecast 2023-2028 ($ million)
- Data Table on Food and dairy cleaning - Market size and forecast 2023-2028 ($ million)
- Chart on Food and dairy cleaning - Year-over-year growth 2023-2028 (%)
- Data Table on Food and dairy cleaning - Year-over-year growth 2023-2028 (%)
- 6.6 Others - Market size and forecast 2023-2028
- Chart on Others - Market size and forecast 2023-2028 ($ million)
- Data Table on Others - Market size and forecast 2023-2028 ($ million)
- Chart on Others - Year-over-year growth 2023-2028 (%)
- Data Table on Others - Year-over-year growth 2023-2028 (%)
- 6.7 Market opportunity by Application
- Market opportunity by Application ($ million)
- Data Table on Market opportunity by Application ($ million)
7 Market Segmentation by Type
- 7.1 Market segments
- Chart on Type - Market share 2023-2028 (%)
- Data Table on Type - Market share 2023-2028 (%)
- 7.2 Comparison by Type
- Chart on Comparison by Type
- Data Table on Comparison by Type
- 7.3 Non-ionic - Market size and forecast 2023-2028
- Chart on Non-ionic - Market size and forecast 2023-2028 ($ million)
- Data Table on Non-ionic - Market size and forecast 2023-2028 ($ million)
- Chart on Non-ionic - Year-over-year growth 2023-2028 (%)
- Data Table on Non-ionic - Year-over-year growth 2023-2028 (%)
- 7.4 Cationic - Market size and forecast 2023-2028
- Chart on Cationic - Market size and forecast 2023-2028 ($ million)
- Data Table on Cationic - Market size and forecast 2023-2028 ($ million)
- Chart on Cationic - Year-over-year growth 2023-2028 (%)
- Data Table on Cationic - Year-over-year growth 2023-2028 (%)
- 7.5 Amphoteric - Market size and forecast 2023-2028
- Chart on Amphoteric - Market size and forecast 2023-2028 ($ million)
- Data Table on Amphoteric - Market size and forecast 2023-2028 ($ million)
- Chart on Amphoteric - Year-over-year growth 2023-2028 (%)
- Data Table on Amphoteric - Year-over-year growth 2023-2028 (%)
- 7.6 Market opportunity by Type
- Market opportunity by Type ($ million)
- Data Table on Market opportunity by Type ($ million)
8 Customer Landscape
- 8.1 Customer landscape overview
- Analysis of price sensitivity, lifecycle, customer purchase basket, adoption rates, and purchase criteria
9 Geographic Landscape
- 9.1 Geographic segmentation
- Chart on Market share By Geographical Landscape 2023-2028 (%)
- Data Table on Market share By Geographical Landscape 2023-2028 (%)
- 9.2 Geographic comparison
- Chart on Geographic comparison
- Data Table on Geographic comparison
- 9.3 APAC - Market size and forecast 2023-2028
- Chart on APAC - Market size and forecast 2023-2028 ($ million)
- Data Table on APAC - Market size and forecast 2023-2028 ($ million)
- Chart on APAC - Year-over-year growth 2023-2028 (%)
- Data Table on APAC - Year-over-year growth 2023-2028 (%)
- 9.4 Europe - Market size and forecast 2023-2028
- Chart on Europe - Market size and forecast 2023-2028 ($ million)
- Data Table on Europe - Market size and forecast 2023-2028 ($ million)
- Chart on Europe - Year-over-year growth 2023-2028 (%)
- Data Table on Europe - Year-over-year growth 2023-2028 (%)
- 9.5 North America - Market size and forecast 2023-2028
- Chart on North America - Market size and forecast 2023-2028 ($ million)
- Data Table on North America - Market size and forecast 2023-2028 ($ million)
- Chart on North America - Year-over-year growth 2023-2028 (%)
- Data Table on North America - Year-over-year growth 2023-2028 (%)
- 9.6 Middle East and Africa - Market size and forecast 2023-2028
- Chart on Middle East and Africa - Market size and forecast 2023-2028 ($ million)
- Data Table on Middle East and Africa - Market size and forecast 2023-2028 ($ million)
- Chart on Middle East and Africa - Year-over-year growth 2023-2028 (%)
- Data Table on Middle East and Africa - Year-over-year growth 2023-2028 (%)
- 9.7 South America - Market size and forecast 2023-2028
- Chart on South America - Market size and forecast 2023-2028 ($ million)
- Data Table on South America - Market size and forecast 2023-2028 ($ million)
- Chart on South America - Year-over-year growth 2023-2028 (%)
- Data Table on South America - Year-over-year growth 2023-2028 (%)
- 9.8 China - Market size and forecast 2023-2028
- Chart on China - Market size and forecast 2023-2028 ($ million)
- Data Table on China - Market size and forecast 2023-2028 ($ million)
- Chart on China - Year-over-year growth 2023-2028 (%)
- Data Table on China - Year-over-year growth 2023-2028 (%)
- 9.9 Germany - Market size and forecast 2023-2028
- Chart on Germany - Market size and forecast 2023-2028 ($ million)
- Data Table on Germany - Market size and forecast 2023-2028 ($ million)
- Chart on Germany - Year-over-year growth 2023-2028 (%)
- Data Table on Germany - Year-over-year growth 2023-2028 (%)
- 9.10 US - Market size and forecast 2023-2028
- Chart on US - Market size and forecast 2023-2028 ($ million)
- Data Table on US - Market size and forecast 2023-2028 ($ million)
- Chart on US - Year-over-year growth 2023-2028 (%)
- Data Table on US - Year-over-year growth 2023-2028 (%)
- 9.11 Russia - Market size and forecast 2023-2028
- Chart on Russia - Market size and forecast 2023-2028 ($ million)
- Data Table on Russia - Market size and forecast 2023-2028 ($ million)
- Chart on Russia - Year-over-year growth 2023-2028 (%)
- Data Table on Russia - Year-over-year growth 2023-2028 (%)
- 9.12 Japan - Market size and forecast 2023-2028
- Chart on Japan - Market size and forecast 2023-2028 ($ million)
- Data Table on Japan - Market size and forecast 2023-2028 ($ million)
- Chart on Japan - Year-over-year growth 2023-2028 (%)
- Data Table on Japan - Year-over-year growth 2023-2028 (%)
- 9.13 Market opportunity By Geographical Landscape
- Market opportunity By Geographical Landscape ($ million)
- Data Tables on Market opportunity By Geographical Landscape ($ million)
10 Drivers, Challenges, and Opportunity/Restraints
- 10.1 Market drivers
- 10.2 Market challenges
- 10.3 Impact of drivers and challenges
- Impact of drivers and challenges in 2023 and 2028
- 10.4 Market opportunities/restraints
11 Competitive Landscape
- 11.1 Overview
- 11.2 Competitive Landscape
- Overview on criticality of inputs and factors of differentiation
- 11.3 Landscape disruption
- Overview on factors of disruption
- 11.4 Industry risks
- Impact of key risks on business
12 Competitive Analysis
- 12.1 Companies profiled
- Companies covered
- 12.2 Market positioning of companies
- Matrix on companies position and classification
- 12.3 Air Products and Chemicals Inc.
- Air Products and Chemicals Inc. - Overview
- Air Products and Chemicals Inc. - Business segments
- Air Products and Chemicals Inc. - Key news
- Air Products and Chemicals Inc. - Key offerings
- Air Products and Chemicals Inc. - Segment focus
- 12.4 Akzo Nobel NV
- Akzo Nobel NV - Overview
- Akzo Nobel NV - Business segments
- Akzo Nobel NV - Key news
- Akzo Nobel NV - Key offerings
- Akzo Nobel NV - Segment focus
- 12.5 Arkema SA
- Arkema SA - Overview
- Arkema SA - Business segments
- Arkema SA - Key news
- Arkema SA - Key offerings
- Arkema SA - Segment focus
- 12.6 Ashland Inc.
- Ashland Inc. - Overview
- Ashland Inc. - Business segments
- Ashland Inc. - Key news
- Ashland Inc. - Key offerings
- Ashland Inc. - Segment focus
- 12.7 BASF SE
- BASF SE - Overview
- BASF SE - Business segments
- BASF SE - Key news
- BASF SE - Key offerings
- BASF SE - Segment focus
- 12.8 Clariant International Ltd.
- Clariant International Ltd. - Overview
- Clariant International Ltd. - Business segments
- Clariant International Ltd. - Key news
- Clariant International Ltd. - Key offerings
- Clariant International Ltd. - Segment focus
- 12.9 Croda International Plc
- Croda International Plc - Overview
- Croda International Plc - Business segments
- Croda International Plc - Key news
- Croda International Plc - Key offerings
- Croda International Plc - Segment focus
- 12.10 Dow Inc.
- Dow Inc. - Overview
- Dow Inc. - Business segments
- Dow Inc. - Key news
- Dow Inc. - Key offerings
- Dow Inc. - Segment focus
- 12.11 Galaxy Surfactants Ltd.
- Galaxy Surfactants Ltd. - Overview
- Galaxy Surfactants Ltd. - Product / Service
- Galaxy Surfactants Ltd. - Key offerings
- 12.12 Huntsman Corp
- Huntsman Corp - Overview
- Huntsman Corp - Business segments
- Huntsman Corp - Key news
- Huntsman Corp - Key offerings
- Huntsman Corp - Segment focus
- 12.13 Innospec Inc.
- Innospec Inc. - Overview
- Innospec Inc. - Business segments
- Innospec Inc. - Key offerings
- Innospec Inc. - Segment focus
- 12.14 Kao Corp.
- Kao Corp. - Overview
- Kao Corp. - Business segments
- Kao Corp. - Key news
- Kao Corp. - Key offerings
- Kao Corp. - Segment focus
- 12.15 RAG Stiftung
- RAG Stiftung - Overview
- RAG Stiftung - Product / Service
- RAG Stiftung - Key offerings
- 12.16 Solvay SA
- Solvay SA - Overview
- Solvay SA - Business segments
- Solvay SA - Key news
- Solvay SA - Key offerings
- Solvay SA - Segment focus
- 12.17 Stepan Co.
- Stepan Co. - Overview
- Stepan Co. - Business segments
- Stepan Co. - Key news
- Stepan Co. - Key offerings
- Stepan Co. - Segment focus
13 Appendix
- 13.1 Scope of the report
- 13.2 Inclusions and exclusions checklist
- Inclusions checklist
- Exclusions checklist
- 13.3 Currency conversion rates for US$
- Currency conversion rates for US$
- 13.4 Research methodology
- Research methodology
- 13.5 Data procurement
- Information sources
- 13.6 Data validation
- Data validation
- 13.7 Validation techniques employed for market sizing
- Validation techniques employed for market sizing
- 13.8 Data synthesis
- Data synthesis
- 13.9 360 degree market analysis
- 360 degree market analysis
- 13.10 List of abbreviations
- List of abbreviations

