|
|
市場調査レポート
商品コード
1267288
ポリオキシメチレン (POMまたはポリアセタール):世界市場の概要Polyoxymethylene (POM or Polyacetal) - A Global Market Overview |
||||||
|
|
|||||||


| ポリオキシメチレン (POMまたはポリアセタール):世界市場の概要 |
|
出版日: 2023年04月26日
発行: Industry Experts
ページ情報: 英文 235 Pages, 196 Charts
納期: 即納可能
|
- 全表示
- 概要
- 目次
世界のポリオキシメチレン (POM) の需要は、COVID-19の影響を受ける中、自動車・輸送用途や産業用途の需要減少により、2020年には前年比5.2%減となりました。しかし2021年には回復し、2022年にかけてその勢いは続き、エレクトロニクス、家電、医療分野の堅調な需要と自動車生産の回復により、2019年から2022年にかけてのCAGRは出荷台数で1.9%を記録しています。
当レポートでは、世界のポリオキシメチレン (POMまたはポリアセタール) の市場を調査し、市場および製品の概要、市場成長への各種影響因子の分析、生産能力、企業プロファイル、企業および製品の動向、市場規模の推移・予測、各種区分・地域/主要国別の詳細分析などをまとめています。
目次
パートA:世界市場の見通し
第1章 イントロダクション
- 市場動向・予測
- COVID-19の影響
- 製品概要
- ポリオキシメチレン (POM)
- ポリオキシメチレン (POM) の用途
第2章 産業情勢
- 生産能力
- 世界のポリオキシメチレン (POM) 樹脂の生産能力
- 世界のポリオキシメチレン (POM) 樹脂の生産能力:地域別
- 世界のポリオキシメチレン (POM) 樹脂の生産能力:国別
- 企業プロファイル
- Asahi Kasei Corporation
- BASF SE
- Kolon BASF innoPOM, Inc.
- Celanese Corporation
- China Bluechemical Ltd.
- DuPont De Nemours, Inc.
- Formosa Plastics Group
- Henan Energy and Chemical Group Co., Ltd.
- Kolon Plastics Inc
- Korea Engineering Plastics Co., Ltd.
- LG Chem Ltd
- Mitsubishi Gas Chemical Company, Inc.
- Polyplastics Co., Ltd.
- DP Engineering Plastics (Nantong) Co., Ltd
- Saudi Basic Industries Corporation (SABIC)
- National Methanol Company
- Tangshan Zhonghao Chemical Co., Ltd.
- Yankuang Lunan Chemical Co., Ltd.
- Yunnan Yuntianhua Co Ltd
第3章 主な企業および製品の動向
第4章 世界市場:概要
- 世界のポリオキシメチレン (POM) 市場の概要:エンドユーズ別
- ポリオキシメチレン (POM) 市場の分析:エンドユーズ・地域別
パートB:地域市場の展望
- 世界のポリオキシメチレン (POM) 市場の概要:地域別
地域市場の概要
第5章 北米
- ポリオキシメチレン (POM) 樹脂の生産能力
- ポリオキシメチレン (POM) 市場の概要:地域別
- ポリオキシメチレン (POM) 市場の概要:エンドユーズ別
- ポリオキシメチレン (POM) 市場の分析:国別
第6章 欧州
- ポリオキシメチレン (POM) 樹脂の生産能力
- ポリオキシメチレン (POM) 市場の概要:地域別
- ポリオキシメチレン (POM) 市場の概要:エンドユーズ別
- ポリオキシメチレン (POM) 市場の分析:国別
第7章 アジア太平洋
- ポリオキシメチレン (POM) 樹脂の生産能力
- ポリオキシメチレン (POM) 市場の概要:地域別
- ポリオキシメチレン (POM) 市場の概要:エンドユーズ別
- ポリオキシメチレン (POM) 市場の分析:国別
第8章 南米
- ポリオキシメチレン (POM) 樹脂の生産能力
- ポリオキシメチレン (POM) 市場の概要:地域別
- ポリオキシメチレン (POM) 市場の概要:エンドユーズ別
- ポリオキシメチレン (POM) 市場の分析:国別
第9章 その他の地域
- ポリオキシメチレン (POM) 市場の概要:地域別
- ポリオキシメチレン (POM) 市場の概要:エンドユーズ別
- ポリオキシメチレン (POM) 市場の分析:国別
パートC:産業ガイド
- 北米
- 欧州
- アジア太平洋
- その他の地域
パートD:付録
Report Synopsis
Polyoxymethylene (POM), also know as polyacetal or acetal resin, is commonly used as a direct replacement for metals due to its stiffness, dimensional stability and corrosion resistance and is widely used in the production of precision parts for applications including automotive, electrical & electronics, industrial and medical. POM resins are available in homopolymer and copolymer formats, with acetal copolymers offering high toughness over a wide range of temperatures, with greater resistance to hot water, hot air, and creep, as against homopolymers. However, homopolymers offer better mechanical and thermal properties.
Demand for polyoxymethylene (POM) worldwide was declined by 5.2% year-over-year in 2020 due to reduction in demand from automotive & transportation and industrial applications amid the impact of coronavirus pandemic. Global demand for polyoxymethylene (POM) recovered in 2021 and continued the momentum through 2022 there by registering a volume CAGR of 1.9% during 2019-2022 period attributed to firm demand from electronics, appliances and medical sectors and recovery in automobile production.
Research Findings & Coverage
- Global market for Polyoxymethylene (POM) is analyzed in this report with respect to major end-use applications
- The study exclusively analyzes the production capacities for POM by major players and key regions for the recent past and immediate future
- COVID-19 impact analysis has been covered for each major application area
- Key business trends focusing on product innovations/developments, M&As, JVs and other recent industry developments
- Major companies profiled - 16
- The industry guide includes the contact details for 30 companies
Product Outline
The market for end-use applications of POM studied in this report comprise the following:
- Automotive & Transportation
- Electrical & Electronics
- Industrial
- Consumer Goods
- Appliances
- Others
Analysis Period, Units and Growth Rates
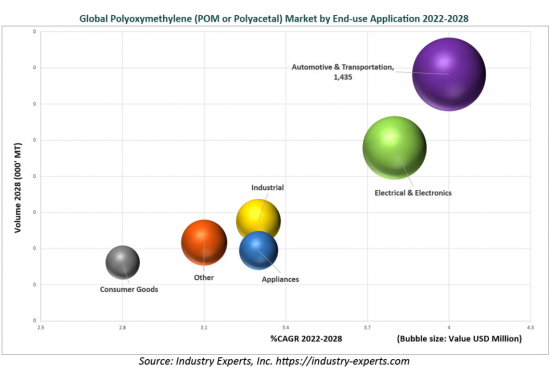
The report reviews, analyzes and projects the global POM market for the period 2019-2028 in terms of volume in metric tons and value in US$ and the compound annual growth rates (CAGRs) projected from 2022 through 2028.
Geographic Coverage
- North America (The United States, Canada and Mexico)
- Europe (France, Germany, Italy, The Netherlands, Russia, Spain, The United Kingdom and Rest of Europe)
- Asia-Pacific (China, Japan, India, South Korea, Taiwan, Thailand and Rest of Asia-Pacific)
- South America (Argentina, Brazil and Rest of South America)
- Rest of World (Middle East and Africa)
TABLE OF CONTENTS
PART A: GLOBAL MARKET PERSPECTIVE
1. INTRODUCTION
- 1.1. Market Trends and Forecast
- 1.1.1. COVID-19 Pandemic Impact on Polyoxymethylene (POM) Market
- 1.2. Product Outline
- 1.2.1. Polyoxymethylene (POM)
- 1.2.2. Applications of Polyoxymethylene (POM)
- 1.2.2.1. Appliances
- 1.2.2.2. Automotive & Transportation
- 1.2.2.3. Consumer Goods
- 1.2.2.4. Electrical & Electronics
- 1.2.2.5. Industrial
- 1.2.2.6. Other Applications
2. INDUSTRY LANDSCAPE
- 2.1. Production Capacity
- 2.1.1. Global Polyoxymethylene (POM) Resin Production Capacity
- 2.1.2. Global Polyoxymethylene (POM) Resin Production Capacity by Geographic Region
- 2.1.3. Global Polyoxymethylene (POM) Resin Production Capacity by Country
- 2.2. Company Profiles
- Asahi Kasei Corporation (Japan)
- BASF SE (Germany)
- Kolon BASF innoPOM, Inc. (South Korea)
- Celanese Corporation (United States)
- China Bluechemical Ltd. (China)
- DuPont De Nemours, Inc. (United States)
- Formosa Plastics Group (Taiwan)
- Henan Energy and Chemical Group Co., Ltd. (China)
- Kolon Plastics Inc (South Korea)
- Korea Engineering Plastics Co., Ltd. (South Korea)
- LG Chem Ltd (South Korea)
- Mitsubishi Gas Chemical Company, Inc. (Japan)
- Polyplastics Co., Ltd. (Japan)
- DP Engineering Plastics (Nantong) Co., Ltd (China)
- Saudi Basic Industries Corporation (SABIC) (Saudi Arabia)
- National Methanol Company (IBN SINA)
- Tangshan Zhonghao Chemical Co., Ltd. (China)
- Yankuang Lunan Chemical Co., Ltd. (China)
- Yunnan Yuntianhua Co Ltd (China)
3. KEY BUSINESS AND PRODUCT TRENDS
4. GLOBAL MARKET OVERVIEW
- 4.1. Global Polyoxymethylene (POM) Market Overview by End-use Application
- 4.1.1. Polyoxymethylene (POM) End-use Application Market Analysis by Geographic Region
- 4.1.1.1. Automotive & Transportation
- 4.1.1.2. Electrical & Electronics
- 4.1.1.3. Industrial Applications
- 4.1.1.4. Appliances
- 4.1.1.5. Consumer Goods
- 4.1.1.6. Other End-use Applications
- 4.1.1. Polyoxymethylene (POM) End-use Application Market Analysis by Geographic Region
PART B: REGIONAL MARKET PERSPECTIVE
- Global Polyoxymethylene (POM) Market Overview by Geographic Region
REGIONAL MARKET OVERVIEW
5. NORTH AMERICA
- 5.1. North American Polyoxymethylene (POM) Resin Production Capacity
- 5.2. North American Polyoxymethylene (POM) Market Overview by Geographic Region
- 5.3. North American Polyoxymethylene (POM) Market Overview by End-use Application
- 5.4. Country-wise Analysis of North American Polyoxymethylene (POM) Market
- 5.4.1. The United States
- 5.4.1.1. United States Polyoxymethylene (POM) Market Overview by End-use Application
- 5.4.2. Canada
- 5.4.2.1. Canada Polyoxymethylene (POM) Market Overview by End-use Application
- 5.4.3. Mexico
- 5.4.3.1. Mexico Polyoxymethylene (POM) Market Overview by End-use Application
- 5.4.1. The United States
6. EUROPE
- 6.1. European Polyoxymethylene (POM) Resin Production Capacity
- 6.2. European Polyoxymethylene (POM) Market Overview by Geographic Region
- 6.3. European Polyoxymethylene (POM) Market Overview by End-use Application
- 6.4. Country-wise Analysis of European Polyoxymethylene (POM) Market
- 6.4.1. France
- 6.4.1.1. France Polyoxymethylene (POM) Market Overview by End-use Application
- 6.4.2. Germany
- 6.4.2.1. Germany Polyoxymethylene (POM) Market Overview by End-use Application
- 6.4.3. Italy
- 6.4.3.1. Italy Polyoxymethylene (POM) Market Overview by End-use Application
- 6.4.4. The Netherlands
- 6.4.4.1. Netherlands Polyoxymethylene (POM) Market Overview by End-use Application
- 6.4.5. Russia
- 6.4.5.1. Russia Polyoxymethylene (POM) Market Overview by End-use Application
- 6.4.6. Spain
- 6.4.6.1. Spain Polyoxymethylene (POM) Market Overview by End-use Application
- 6.4.7. The United Kingdom
- 6.4.7.1. United Kingdom Polyoxymethylene (POM) Market Overview by End-use Application
- 6.4.8. Rest of Europe
- 6.4.8.1. Rest of Europe Polyoxymethylene (POM) Market Overview by End-use Application
- 6.4.1. France
7. ASIA-PACIFIC
- 7.1. Asia-Pacific Polyoxymethylene (POM) Resin Production Capacity
- 7.2. Asia-Pacific Polyoxymethylene (POM) Market Overview by Geographic Region
- 7.3. Asia-Pacific Polyoxymethylene (POM) Market Overview by End-use Application
- 7.4. Country-wise Analysis of Asia-Pacific Polyoxymethylene (POM) Market
- 7.4.1. China
- 7.4.1.1. China Polyoxymethylene (POM) Market Overview by End-use Application
- 7.4.2. India
- 7.4.2.1. India Polyoxymethylene (POM) Market Overview by End-use Application
- 7.4.3. Japan
- 7.4.3.1. Japan Polyoxymethylene (POM) Market Overview by End-use Application
- 7.4.4. South Korea
- 7.4.4.1. South Korea Polyoxymethylene (POM) Market Overview by End-use Application
- 7.4.5. Taiwan
- 7.4.5.1. Taiwan Polyoxymethylene (POM) Market Overview by End-use Application
- 7.4.6. Thailand
- 7.4.6.1. Thailand Polyoxymethylene (POM) Market Overview by End-use Application
- 7.4.7. Rest of Asia-Pacific
- 7.4.7.1. Rest of Asia-Pacific Polyoxymethylene (POM) Market Overview by End-use Application
- 7.4.1. China
8. SOUTH AMERICA
- 8.1. South America Polyoxymethylene (POM) Market Overview by Geographic Region
- 8.2. South America Polyoxymethylene (POM) Market Overview by End-use Application
- 8.3. Country-wise Analysis of South America Polyoxymethylene (POM) Market
- 8.3.1. Argentina
- 8.3.1.1. Argentina Polyoxymethylene (POM) Market Overview by End-use Application
- 8.3.2. Brazil
- 8.3.2.1. Brazil Polyoxymethylene (POM) Market Overview by End-use Application
- 8.3.3. Rest of South America
- 8.3.3.1. Rest of South America Polyoxymethylene (POM) Market Overview by End-use Application
- 8.3.1. Argentina
9. REST OF WORLD
- 9.1. Rest of World Polyoxymethylene (POM) Market Overview by Geographic Region
- 9.2. Rest of World Polyoxymethylene (POM) Market Overview by End-use Application
- 9.3. Region-wise analysis of Rest of World Polyoxymethylene (POM) Market
- 9.3.1. Middle East
- 9.3.1.1. Middle East Polyoxymethylene (POM) Market Overview by End-use Application
- 9.3.2. Africa
- 9.3.2.1. Africa Polyoxymethylene (POM) Market Overview by End-use Application
- 9.3.1. Middle East
PART C: GUIDE TO THE INDUSTRY
- 1. NORTH AMERICA
- 2. EUROPE
- 3. ASIA-PACIFIC
- 4. REST OF WORLD
PART D: ANNEXURE
- 1. RESEARCH METHODOLOGY
- 2. FEEDBACK
Charts & Graphs
PART A: GLOBAL MARKET PERSPECTIVE
- Chart 1: Global Polyoxymethylene (POM) Market (2019-2028)
- Chart 2: Global Polyoxymethylene (POM) Market (2019-2028) by End-use Application in Thousand Metric Tons
- Chart 3: Global Polyoxymethylene (POM) Market (2019-2028) by Geographic Region in Thousand Metric Tons
- Chart 4: Global Polyoxymethylene (POM) Market Analysis (2019-2028) by Volume (Thousand Metric Tons) and Value (USD Million)
- Chart 5: Global Polyoxymethylene (POM) Market Analysis (2019-2028) by End-use Application - Automotive & Transportation, Electrical & Electronics, Industrial, Consumer Goods, Appliances and Other in Thousand Metric Tons
- Chart 6: Glance at 2019, 2022 and 2028 Global Polyoxymethylene (POM) Volume Market Share (%) by End-use Application - Automotive & Transportation, Electrical & Electronics, Industrial, Consumer Goods, Appliances and Other
- Chart 7: Global Polyoxymethylene (POM) Market Analysis (2019-2028) by End-use Application - Automotive & Transportation, Electrical & Electronics, Industrial, Consumer Goods, Appliances and Other in USD Million
- Chart 8: Glance at 2019, 2022 and 2028 Global Polyoxymethylene (POM) Value Market Share (%) by End-use Application - Automotive & Transportation, Electrical & Electronics, Industrial, Consumer Goods, Appliances and Other
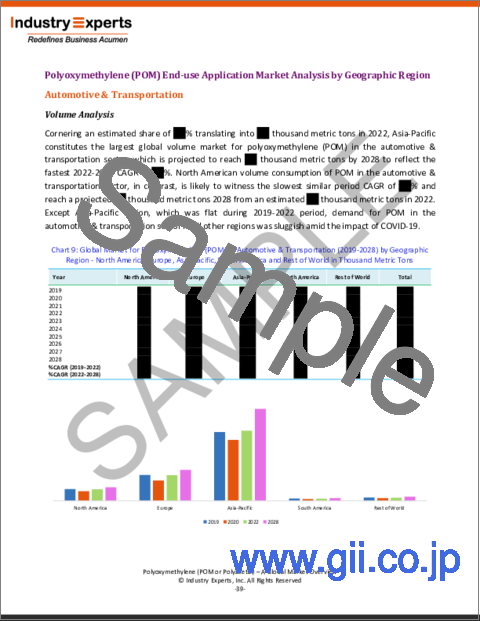
- Chart 9: Global Market for Polyoxymethylene (POM) in Automotive & Transportation (2019-2028) by Geographic Region - North America, Europe, Asia-Pacific, South America and Rest of World in Thousand Metric Tons
- Chart 10: Glance at 2019, 2022 and 2028 Global Volume Market Share (%) for Polyoxymethylene (POM) in Automotive & Transportation by Geographic Region - North America, Europe, Asia-Pacific, South America and Rest of World
- Chart 11: Global Market for Polyoxymethylene (POM) in Automotive & Transportation (2019-2028) by Geographic Region - North America, Europe, Asia-Pacific, South America and Rest of World in USD Million
- Chart 12: Glance at 2019, 2022 and 2028 Global Value Market Share (%) for Polyoxymethylene (POM) in Automotive & Transportation by Geographic Region - North America, Europe, Asia-Pacific, South America and Rest of World
- Chart 13: Global Market for Polyoxymethylene (POM) in Electrical & Electronics (2019-2028) by Geographic Region - North America, Europe, Asia-Pacific, South America and Rest of World in Thousand Metric Tons
- Chart 14: Glance at 2019, 2022 and 2028 Global Volume Market Share (%) for Polyoxymethylene (POM) in Electrical & Electronics by Geographic Region - North America, Europe, Asia-Pacific, South America and Rest of World
- Chart 15: Global Market for Polyoxymethylene (POM) in Electrical & Electronics (2019-2028) by Geographic Region - North America, Europe, Asia-Pacific, South America and Rest of World in USD Million
- Chart 16: Glance at 2019, 2022 and 2028 Global Value Market Share (%) for Polyoxymethylene (POM) in Electrical & Electronics by Geographic Region - North America, Europe, Asia-Pacific, South America and Rest of World
- Chart 17: Global Market for Polyoxymethylene (POM) in Industrial Applications (2019-2028) by Geographic Region - North America, Europe, Asia-Pacific, South America and Rest of World in Thousand Metric Tons
- Chart 18: Glance at 2019, 2022 and 2028 Global Volume Market Share (%) for Polyoxymethylene (POM) in Industrial Applications by Geographic Region - North America, Europe, Asia-Pacific, South America and Rest of World
- Chart 19: Global Market for Polyoxymethylene (POM) in Industrial Applications (2019-2028) by Geographic Region - North America, Europe, Asia-Pacific, South America and Rest of World in USD Million
- Chart 20: Glance at 2019, 2022 and 2028 Global Value Market Share (%) for Polyoxymethylene (POM) in Industrial Applications by Geographic Region - North America, Europe, Asia-Pacific, South America and Rest of World
- Chart 21: Global Market for Polyoxymethylene (POM) in Appliances (2019-2028) by Geographic Region - North America, Europe, Asia-Pacific, South America and Rest of World in Thousand Metric Tons
- Chart 22: Glance at 2019, 2022 and 2028 Global Volume Market Share (%) for Polyoxymethylene (POM) in Appliances by Geographic Region - North America, Europe, Asia-Pacific, South America and Rest of World
- Chart 23: Global Market for Polyoxymethylene (POM) in Appliances (2019-2028) by Geographic Region - North America, Europe, Asia-Pacific, South America and Rest of World in USD Million
- Chart 24: Glance at 2019, 2022 and 2028 Global Value Market Share (%) for Polyoxymethylene (POM) in Appliances by Geographic Region - North America, Europe, Asia-Pacific, South America and Rest of World
- Chart 25: Global Market for Polyoxymethylene (POM) in Consumer Goods (2019-2028) by Geographic Region - North America, Europe, Asia-Pacific, South America and Rest of World in Thousand Metric Tons
- Chart 26: Glance at 2019, 2022 and 2028 Global Volume Market Share (%) for Polyoxymethylene (POM) in Consumer Goods by Geographic Region - North America, Europe, Asia-Pacific, South America and Rest of World
- Chart 27: Global Market for Polyoxymethylene (POM) in Consumer Goods (2019-2028) by Geographic Region - North America, Europe, Asia-Pacific, South America and Rest of World in USD Million
- Chart 28: Glance at 2019, 2022 and 2028 Global Value Market Share (%) for Polyoxymethylene (POM) in Consumer Goods by Geographic Region - North America, Europe, Asia-Pacific, South America and Rest of World
- Chart 29: Global Market for Polyoxymethylene (POM) in Other End-use Applications (2019-2028) by Geographic Region - North America, Europe, Asia-Pacific, South America and Rest of World in Thousand Metric Tons
- Chart 30: Glance at 2019, 2022 and 2028 Global Volume Market Share (%) for Polyoxymethylene (POM) in Other End-use Applications by Geographic Region - North America, Europe, Asia-Pacific, South America and Rest of World
- Chart 31: Global Market for Polyoxymethylene (POM) in Other End-use Applications (2019-2028) by Geographic Region - North America, Europe, Asia-Pacific, South America and Rest of World in USD Million
- Chart 32: Glance at 2019, 2022 and 2028 Global Value Market Share (%) for Polyoxymethylene (POM) in Other End-use Applications by Geographic Region - North America, Europe, Asia-Pacific, South America and Rest of World
PART B: REGIONAL MARKET PERSPECTIVE
- Chart 33: Global Polyoxymethylene (POM) Market Analysis (2019-2028) by Geographic Region - North America, Europe, Asia-Pacific, South America and Rest of World in Thousand Metric Tons
- Chart 34: Glance at 2019, 2022 and 2028 Global Polyoxymethylene (POM) Volume Market Share (%) by Geographic Region - North America, Europe, Asia-Pacific, South America and Rest of World
- Chart 35: Global Polyoxymethylene (POM) Market Analysis (2019-2028) by Geographic Region - North America, Europe, Asia-Pacific, South America and Rest of World in USD Million
- Chart 36: Glance at 2019, 2022 and 2028 Global Polyoxymethylene (POM) Value Market Share (%) by Geographic Region - North America, Europe, Asia-Pacific, South America and Rest of World
REGIONAL MARKET OVERVIEW
NORTH AMERICA
- Chart 37: North American Polyoxymethylene (POM) Market Analysis (2019-2028) by Volume (Thousand Metric Tons) and Value (USD Million)
- Chart 38: North American Polyoxymethylene (POM) Market Analysis (2019-2028) by Geographic Region - The United States, Canada and Mexico in Thousand Metric Tons
- Chart 39: Glance at 2019, 2022 and 2028 North American Polyoxymethylene (POM) Volume Market Share (%) by Geographic Region - The United States, Canada and Mexico
- Chart 40: North American Polyoxymethylene (POM) Market Analysis (2019-2028) by Geographic Region - The United States, Canada and Mexico in USD Million
- Chart 41: Glance at 2019, 2022 and 2028 North American Polyoxymethylene (POM) Value Market Share (%) by Geographic Region - The United States, Canada and Mexico
- Chart 42: North American Polyoxymethylene (POM) Market Analysis (2019-2028) by End-use Application - Automotive & Transportation, Electrical & Electronics, Industrial, Consumer Goods, Appliances and Other in Thousand Metric Tons
- Chart 43: Glance at 2019, 2022 and 2028 North American Polyoxymethylene (POM) Volume Market Share (%) by End-use Application - Automotive & Transportation, Electrical & Electronics, Industrial, Consumer Goods, Appliances and Other
- Chart 44: North American Polyoxymethylene (POM) Market Analysis (2019-2028) by End-use Application - Automotive & Transportation, Electrical & Electronics, Industrial, Consumer Goods, Appliances and Other in USD Million
- Chart 45: Glance at 2019, 2022 and 2028 North American Polyoxymethylene (POM) Value Market Share (%) by End-use Application - Automotive & Transportation, Electrical & Electronics, Industrial, Consumer Goods, Appliances and Other
The United States
- Chart 46: United States Polyoxymethylene (POM) Market Analysis (2019-2028) by Volume (Thousand Metric Tons) and Value (USD Million)
- Chart 47: United States Polyoxymethylene (POM) Market Analysis (2019-2028) by End-use Application - Automotive & Transportation, Electrical & Electronics, Industrial, Consumer Goods, Appliances and Other in Thousand Metric Tons
- Chart 48: Glance at 2019, 2022 and 2028 United States Polyoxymethylene (POM) Volume Market Share (%) by End-use Application - Automotive & Transportation, Electrical & Electronics, Industrial, Consumer Goods, Appliances and Other
- Chart 49: United States Polyoxymethylene (POM) Market Analysis (2019-2028) by End-use Application - Automotive & Transportation, Electrical & Electronics, Industrial, Consumer Goods, Appliances and Other in USD Million
- Chart 50: Glance at 2019, 2022 and 2028 United States Polyoxymethylene (POM) Value Market Share (%) by End-use Application - Automotive & Transportation, Electrical & Electronics, Industrial, Consumer Goods, Appliances and Other
Canada
- Chart 51: Canada Polyoxymethylene (POM) Market Analysis (2019-2028) by Volume (Thousand Metric Tons) and Value (USD Million)
- Chart 52: Canada Polyoxymethylene (POM) Market Analysis (2019-2028) by End-use Application - Automotive & Transportation, Electrical & Electronics, Industrial and Other in Thousand Metric Tons
- Chart 53: Glance at 2019, 2022 and 2028 Canada Polyoxymethylene (POM) Volume Market Share (%) by End-use Application - Automotive & Transportation, Electrical & Electronics, Industrial and Other
- Chart 54: Canada Polyoxymethylene (POM) Market Analysis (2019-2028) by End-use Application - Automotive & Transportation, Electrical & Electronics, Industrial and Other in USD Million
- Chart 55: Glance at 2019, 2022 and 2028 Canada Polyoxymethylene (POM) Value Market Share (%) by End-use Application - Automotive & Transportation, Electrical & Electronics, Industrial and Other
Mexico
- Chart 56: Mexico Polyoxymethylene (POM) Market Analysis (2019-2028) by Volume (Thousand Metric Tons) and Value (USD Million)
- Chart 57: Mexico Polyoxymethylene (POM) Market Analysis (2019-2028) by End-use Application - Automotive & Transportation, Electrical & Electronics, Industrial, Consumer Goods, Appliances and Other in Thousand Metric Tons
- Chart 58: Glance at 2019, 2022 and 2028 Mexico Polyoxymethylene (POM) Volume Market Share (%) by End-use Application - Automotive & Transportation, Electrical & Electronics, Industrial, Consumer Goods, Appliances and Other
- Chart 59: Mexico Polyoxymethylene (POM) Market Analysis (2019-2028) by End-use Application - Automotive & Transportation, Electrical & Electronics, Industrial, Consumer Goods, Appliances and Other in USD Million
- Chart 60: Glance at 2019, 2022 and 2028 Mexico Polyoxymethylene (POM) Value Market Share (%) by End-use Application - Automotive & Transportation, Electrical & Electronics, Industrial, Consumer Goods, Appliances and Other
EUROPE
- Chart 61: European Polyoxymethylene (POM) Market Analysis (2019-2028) by Volume (Thousand Metric Tons) and Value (USD Million)
- Chart 62: European Polyoxymethylene (POM) Market Analysis (2019-2028) by Geographic Region - France, Germany, Italy, The Netherlands, Russia, Spain, The United Kingdom and Rest of Europe in Thousand Metric Tons
- Chart 63: Glance at 2019, 2022 and 2028 European Polyoxymethylene (POM) Volume Market Share (%) by Geographic Region - France, Germany, Italy, The Netherlands, Russia, Spain, The United Kingdom and Rest of Europe
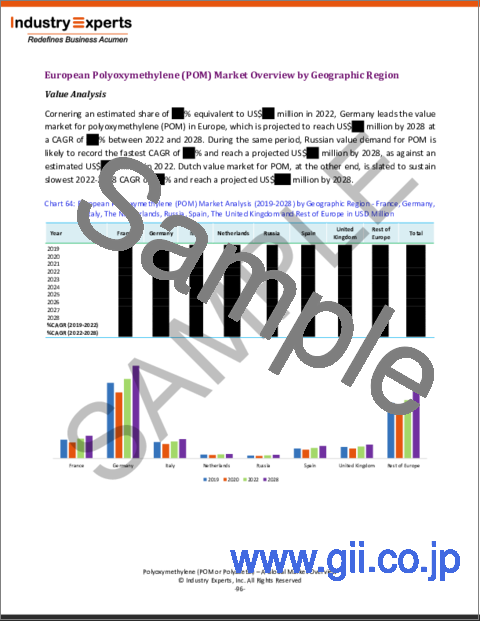
- Chart 64: European Polyoxymethylene (POM) Market Analysis (2019-2028) by Geographic Region - France, Germany, Italy, The Netherlands, Russia, Spain, The United Kingdom and Rest of Europe in USD Million
- Chart 65: Glance at 2019, 2022 and 2028 European Polyoxymethylene (POM) Value Market Share (%) by Geographic Region - France, Germany, Italy, The Netherlands, Russia, Spain, The United Kingdom and Rest of Europe
- Chart 66: European Polyoxymethylene (POM) Market Analysis (2019-2028) by End-use Application - Automotive & Transportation, Electrical & Electronics, Industrial, Consumer Goods, Appliances and Other in Thousand Metric Tons
- Chart 67: Glance at 2019, 2022 and 2028 European Polyoxymethylene (POM) Volume Market Share (%) by End-use Application - Automotive & Transportation, Electrical & Electronics, Industrial, Consumer Goods, Appliances and Other
- Chart 68: European Polyoxymethylene (POM) Market Analysis (2019-2028) by End-use Application - Automotive & Transportation, Electrical & Electronics, Industrial, Consumer Goods, Appliances and Other in USD Million
- Chart 69: Glance at 2019, 2022 and 2028 European Polyoxymethylene (POM) Value Market Share (%) by End-use Application - Automotive & Transportation, Electrical & Electronics, Industrial, Consumer Goods, Appliances and Other
France
- Chart 70: France Polyoxymethylene (POM) Market Analysis (2019-2028) by Volume (Thousand Metric Tons) and Value (USD Million)
- Chart 71: France Polyoxymethylene (POM) Market Analysis (2019-2028) by End-use Application - Automotive & Transportation, Electrical & Electronics, Industrial, Consumer Goods, Appliances and Other in Thousand Metric Tons
- Chart 72: Glance at 2019, 2022 and 2028 France Polyoxymethylene (POM) Volume Market Share (%) by End-use Application - Automotive & Transportation, Electrical & Electronics, Industrial, Consumer Goods, Appliances and Other
- Chart 73: France Polyoxymethylene (POM) Market Analysis (2019-2028) by End-use Application - Automotive & Transportation, Electrical & Electronics, Industrial, Consumer Goods, Appliances and Other in USD Million
- Chart 74: Glance at 2019, 2022 and 2028 France Polyoxymethylene (POM) Value Market Share (%) by End-use Application - Automotive & Transportation, Electrical & Electronics, Industrial, Consumer Goods, Appliances and Other
Germany
- Chart 75: Germany Polyoxymethylene (POM) Market Analysis (2019-2028) by Volume (Thousand Metric Tons) and Value (USD Million)
- Chart 76: Germany Polyoxymethylene (POM) Market Analysis (2019-2028) by End-use Application - Automotive & Transportation, Electrical & Electronics, Industrial, Consumer Goods, Appliances and Other in Thousand Metric Tons
- Chart 77: Glance at 2019, 2022 and 2028 Germany Polyoxymethylene (POM) Volume Market Share (%) by End-use Application - Automotive & Transportation, Electrical & Electronics, Industrial, Consumer Goods, Appliances and Other
- Chart 78: Germany Polyoxymethylene (POM) Market Analysis (2019-2028) by End-use Application - Automotive & Transportation, Electrical & Electronics, Industrial, Consumer Goods, Appliances and Other in USD Million
- Chart 79: Glance at 2019, 2022 and 2028 Germany Polyoxymethylene (POM) Value Market Share (%) by End-use Application - Automotive & Transportation, Electrical & Electronics, Industrial, Consumer Goods, Appliances and Other
Italy
- Chart 80: Italy Polyoxymethylene (POM) Market Analysis (2019-2028) by Volume (Thousand Metric Tons) and Value (USD Million)
- Chart 81: Italy Polyoxymethylene (POM) Market Analysis (2019-2028) by End-use Application - Automotive & Transportation, Electrical & Electronics, Industrial, Consumer Goods, Appliances and Other in Thousand Metric Tons
- Chart 82: Glance at 2019, 2022 and 2028 Italy Polyoxymethylene (POM) Volume Market Share (%) by End-use Application - Automotive & Transportation, Electrical & Electronics, Industrial, Consumer Goods, Appliances and Other
- Chart 83: Italy Polyoxymethylene (POM) Market Analysis (2019-2028) by End-use Application - Automotive & Transportation, Electrical & Electronics, Industrial, Consumer Goods, Appliances and Other in USD Million
- Chart 84: Glance at 2019, 2022 and 2028 Italy Polyoxymethylene (POM) Value Market Share (%) by End-use Application - Automotive & Transportation, Electrical & Electronics, Industrial, Consumer Goods, Appliances and Other
The Netherlands
- Chart 85: Netherlands Polyoxymethylene (POM) Market Analysis (2019-2028) by Volume (Thousand Metric Tons) and Value (USD Million)
- Chart 86: Netherlands Polyoxymethylene (POM) Market Analysis (2019-2028) by End-use Application - Automotive & Transportation, Electrical & Electronics, Industrial, Consumer Goods & Appliances and Other in Thousand Metric Tons
- Chart 87: Glance at 2019, 2022 and 2028 Netherlands Polyoxymethylene (POM) Volume Market Share (%) by End-use Application - Automotive & Transportation, Electrical & Electronics, Industrial, Consumer Goods & Appliances and Other
- Chart 88: Netherlands Polyoxymethylene (POM) Market Analysis (2019-2028) by End-use Application - Automotive & Transportation, Electrical & Electronics, Industrial, Consumer Goods & Appliances and Other in USD Million
- Chart 89: Glance at 2019, 2022 and 2028 Netherlands Polyoxymethylene (POM) Value Market Share (%) by End-use Application - Automotive & Transportation, Electrical & Electronics, Industrial, Consumer Goods & Appliances and Other
Russia
- Chart 90: Russia Polyoxymethylene (POM) Market Analysis (2019-2028) by Volume (Thousand Metric Tons) and Value (USD Million)
- Chart 91: Russia Polyoxymethylene (POM) Market Analysis (2019-2028) by End-use Application - Automotive & Transportation, Electrical & Electronics, Industrial, Consumer Goods & Appliances and Other in Thousand Metric Tons
- Chart 92: Glance at 2019, 2022 and 2028 Russia Polyoxymethylene (POM) Volume Market Share (%) by End-use Application - Automotive & Transportation, Electrical & Electronics, Industrial, Consumer Goods & Appliances and Other
- Chart 93: Russia Polyoxymethylene (POM) Market Analysis (2019-2028) by End-use Application - Automotive & Transportation, Electrical & Electronics, Industrial, Consumer Goods & Appliances and Other in USD Million
- Chart 94: Glance at 2019, 2022 and 2028 Russia Polyoxymethylene (POM) Value Market Share (%) by End-use Application - Automotive & Transportation, Electrical & Electronics, Industrial, Consumer Goods & Appliances and Other
Spain
- Chart 95: Spain Polyoxymethylene (POM) Market Analysis (2019-2028) by Volume (Thousand Metric Tons) and Value (USD Million)
- Chart 96: Spain Polyoxymethylene (POM) Market Analysis (2019-2028) by End-use Application - Automotive & Transportation, Electrical & Electronics, Industrial, Consumer Goods & Appliances and Other in Thousand Metric Tons
- Chart 97: Glance at 2019, 2022 and 2028 Spain Polyoxymethylene (POM) Volume Market Share (%) by End-use Application - Automotive & Transportation, Electrical & Electronics, Industrial, Consumer Goods & Appliances and Other
- Chart 98: Spain Polyoxymethylene (POM) Market Analysis (2019-2028) by End-use Application - Automotive & Transportation, Electrical & Electronics, Industrial, Consumer Goods & Appliances and Other in USD Million
- Chart 99: Glance at 2019, 2022 and 2028 Spain Polyoxymethylene (POM) Value Market Share (%) by End-use Application - Automotive & Transportation, Electrical & Electronics, Industrial, Consumer Goods & Appliances and Other
The United Kingdom
- Chart 100: United Kingdom Polyoxymethylene (POM) Market Analysis (2019-2028) by Volume (Thousand Metric Tons) and Value (USD Million)
- Chart 101: United Kingdom Polyoxymethylene (POM) Market Analysis (2019-2028) by End-use Application - Automotive & Transportation, Electrical & Electronics, Industrial, Consumer Goods & Appliances and Other in Thousand Metric Tons
- Chart 102: Glance at 2019, 2022 and 2028 United Kingdom Polyoxymethylene (POM) Volume Market Share (%) by End-use Application - Automotive & Transportation, Electrical & Electronics, Industrial, Consumer Goods & Appliances and Other
- Chart 103: United Kingdom Polyoxymethylene (POM) Market Analysis (2019-2028) by End-use Application - Automotive & Transportation, Electrical & Electronics, Industrial, Consumer Goods & Appliances and Other in USD Million
- Chart 104: Glance at 2019, 2022 and 2028 United Kingdom Polyoxymethylene (POM) Value Market Share (%) by End-use Application - Automotive & Transportation, Electrical & Electronics, Industrial, Consumer Goods & Appliances and Other
Rest of Europe
- Chart 105: Rest of Europe Polyoxymethylene (POM) Market Analysis (2019-2028) by Volume (Thousand Metric Tons) and Value (USD Million)
- Chart 106: Rest of Europe Polyoxymethylene (POM) Market Analysis (2019-2028) by End-use Application - Automotive & Transportation, Electrical & Electronics, Industrial, Consumer Goods, Appliances and Other in Thousand Metric Tons
- Chart 107: Glance at 2019, 2022 and 2028 Rest of Europe Polyoxymethylene (POM) Volume Market Share (%) by End-use Application - Automotive & Transportation, Electrical & Electronics, Industrial, Consumer Goods, Appliances and Other
- Chart 108: Rest of Europe Polyoxymethylene (POM) Market Analysis (2019-2028) by End-use Application - Automotive & Transportation, Electrical & Electronics, Industrial, Consumer Goods, Appliances and Other in USD Million
- Chart 109: Glance at 2019, 2022 and 2028 Rest of Europe Polyoxymethylene (POM) Value Market Share (%) by End-use Application - Automotive & Transportation, Electrical & Electronics, Industrial, Consumer Goods, Appliances and Other
ASIA-PACIFIC
- Chart 110: Asia-Pacific Polyoxymethylene (POM) Market Analysis (2019-2028) by Volume (Thousand Metric Tons) and Value (USD Million)
- Chart 111: Asia-Pacific Polyoxymethylene (POM) Market Analysis (2019-2028) by Geographic Region - China, India, Japan, South Korea, Taiwan, Thailand and Rest of Asia-Pacific in Thousand Metric Tons
- Chart 112: Glance at 2019, 2022 and 2028 Asia-Pacific Polyoxymethylene (POM) Volume Market Share (%) by Geographic Region - China, India, Japan, South Korea, Taiwan, Thailand and Rest of Asia-Pacific
- Chart 113: Asia-Pacific Polyoxymethylene (POM) Market Analysis (2019-2028) by Geographic Region - China, India, Japan, South Korea, Taiwan, Thailand and Rest of Asia-Pacific in USD Million
- Chart 114: Glance at 2019, 2022 and 2028 Asia-Pacific Polyoxymethylene (POM) Value Market Share (%) by Geographic Region - China, India, Japan, South Korea, Taiwan, Thailand and Rest of Asia-Pacific
- Chart 115: Asia-Pacific Polyoxymethylene (POM) Market Analysis (2019-2028) by End-use Application - Automotive & Transportation, Electrical & Electronics, Industrial, Consumer Goods, Appliances and Other in Thousand Metric Tons
- Chart 116: Glance at 2019, 2022 and 2028 Asia-Pacific Polyoxymethylene (POM) Volume Market Share (%) by End-use Application - Automotive & Transportation, Electrical & Electronics, Industrial, Consumer Goods, Appliances and Other
- Chart 117: Asia-Pacific Polyoxymethylene (POM) Market Analysis (2019-2028) by End-use Application - Automotive & Transportation, Electrical & Electronics, Industrial, Consumer Goods, Appliances and Other in USD Million
- Chart 118: Glance at 2019, 2022 and 2028 Asia-Pacific Polyoxymethylene (POM) Value Market Share (%) by End-use Application - Automotive & Transportation, Electrical & Electronics, Industrial, Consumer Goods, Appliances and Other
China
- Chart 119: China Polyoxymethylene (POM) Market Analysis (2019-2028) by Volume (Thousand Metric Tons) and Value (USD Million)
- Chart 120: China Polyoxymethylene (POM) Market Analysis (2019-2028) by End-use Application - Automotive & Transportation, Electrical & Electronics, Industrial, Consumer Goods, Appliances and Other in Thousand Metric Tons
- Chart 121: Glance at 2019, 2022 and 2028 China Polyoxymethylene (POM) Volume Market Share (%) by End-use Application - Automotive & Transportation, Electrical & Electronics, Industrial, Consumer Goods, Appliances and Other
- Chart 122: China Polyoxymethylene (POM) Market Analysis (2019-2028) by End-use Application - Automotive & Transportation, Electrical & Electronics, Industrial, Consumer Goods, Appliances and Other in USD Million
- Chart 123: Glance at 2019, 2022 and 2028 China Polyoxymethylene (POM) Value Market Share (%) by End-use Application - Automotive & Transportation, Electrical & Electronics, Industrial, Consumer Goods, Appliances and Other
India
- Chart 124: India Polyoxymethylene (POM) Market Analysis (2019-2028) by Volume (Thousand Metric Tons) and Value (USD Million)
- Chart 125: India Polyoxymethylene (POM) Market Analysis (2019-2028) by End-use Application - Automotive & Transportation, Electrical & Electronics, Industrial, Consumer Goods, Appliances and Other in Thousand Metric Tons
- Chart 126: Glance at 2019, 2022 and 2028 India Polyoxymethylene (POM) Volume Market Share (%) by End-use Application - Automotive & Transportation, Electrical & Electronics, Industrial, Consumer Goods, Appliances and Other
- Chart 127: India Polyoxymethylene (POM) Market Analysis (2019-2028) by End-use Application - Automotive & Transportation, Electrical & Electronics, Industrial, Consumer Goods, Appliances and Other in USD Million
- Chart 128: Glance at 2019, 2022 and 2028 India Polyoxymethylene (POM) Value Market Share (%) by End-use Application - Automotive & Transportation, Electrical & Electronics, Industrial, Consumer Goods, Appliances and Other
Japan
- Chart 129: Japan Polyoxymethylene (POM) Market Analysis (2019-2028) by Volume (Thousand Metric Tons) and Value (USD Million)
- Chart 130: Japan Polyoxymethylene (POM) Market Analysis (2019-2028) by End-use Application - Automotive & Transportation, Electrical & Electronics, Industrial, Consumer Goods, Appliances and Other in Thousand Metric Tons
- Chart 131: Glance at 2019, 2022 and 2028 Japan Polyoxymethylene (POM) Volume Market Share (%) by End-use Application - Automotive & Transportation, Electrical & Electronics, Industrial, Consumer Goods, Appliances and Other
- Chart 132: Japan Polyoxymethylene (POM) Market Analysis (2019-2028) by End-use Application - Automotive & Transportation, Electrical & Electronics, Industrial, Consumer Goods, Appliances and Other in USD Million
- Chart 133: Glance at 2019, 2022 and 2028 Japan Polyoxymethylene (POM) Value Market Share (%) by End-use Application - Automotive & Transportation, Electrical & Electronics, Industrial, Consumer Goods, Appliances and Other
South Korea
- Chart 134: South Korea Polyoxymethylene (POM) Market Analysis (2019-2028) by Volume (Thousand Metric Tons) and Value (USD Million)
- Chart 135: South Korea Polyoxymethylene (POM) Market Analysis (2019-2028) by End-use Application - Automotive & Transportation, Electrical & Electronics, Industrial, Consumer Goods, Appliances and Other in Thousand Metric Tons
- Chart 136: Glance at 2019, 2022 and 2028 South Korea Polyoxymethylene (POM) Volume Market Share (%) by End-use Application - Automotive & Transportation, Electrical & Electronics, Industrial, Consumer Goods, Appliances and Other
- Chart 137: South Korea Polyoxymethylene (POM) Market Analysis (2019-2028) by End-use Application - Automotive & Transportation, Electrical & Electronics, Industrial, Consumer Goods, Appliances and Other in USD Million
- Chart 138: Glance at 2019, 2022 and 2028 South Korea Polyoxymethylene (POM) Value Market Share (%) by End-use Application - Automotive & Transportation, Electrical & Electronics, Industrial, Consumer Goods, Appliances and Other
Taiwan
- Chart 139: Taiwan Polyoxymethylene (POM) Market Analysis (2019-2028) by Volume (Thousand Metric Tons) and Value (USD Million)
- Chart 140: Taiwan Polyoxymethylene (POM) Market Analysis (2019-2028) by End-use Application - Automotive & Transportation, Electrical & Electronics, Industrial, Consumer Goods, Appliances and Other in Thousand Metric Tons
- Chart 141: Glance at 2019, 2022 and 2028 Taiwan Polyoxymethylene (POM) Volume Market Share (%) by End-use Application - Automotive & Transportation, Electrical & Electronics, Industrial, Consumer Goods, Appliances and Other
- Chart 142: Taiwan Polyoxymethylene (POM) Market Analysis (2019-2028) by End-use Application - Automotive & Transportation, Electrical & Electronics, Industrial, Consumer Goods, Appliances and Other in USD Million
- Chart 143: Glance at 2019, 2022 and 2028 Taiwan Polyoxymethylene (POM) Value Market Share (%) by End-use Application - Automotive & Transportation, Electrical & Electronics, Industrial, Consumer Goods, Appliances and Other
Thailand
- Chart 144: Thailand Polyoxymethylene (POM) Market Analysis (2019-2028) by Volume (Thousand Metric Tons) and Value (USD Million)
- Chart 145: Thailand Polyoxymethylene (POM) Market Analysis (2019-2028) by End-use Application - Automotive & Transportation, Electrical & Electronics, Industrial, Consumer Goods, Appliances and Other in Thousand Metric Tons
- Chart 146: Glance at 2019, 2022 and 2028 Thailand Polyoxymethylene (POM) Volume Market Share (%) by End-use Application - Automotive & Transportation, Electrical & Electronics, Industrial, Consumer Goods, Appliances and Other
- Chart 147: Thailand Polyoxymethylene (POM) Market Analysis (2019-2028) by End-use Application - Automotive & Transportation, Electrical & Electronics, Industrial, Consumer Goods, Appliances and Other in USD Million
- Chart 148: Glance at 2019, 2022 and 2028 Thailand Polyoxymethylene (POM) Value Market Share (%) by End-use Application - Automotive & Transportation, Electrical & Electronics, Industrial, Consumer Goods, Appliances and Other
Rest of Asia-Pacific
- Chart 149: Rest of Asia-Pacific Polyoxymethylene (POM) Market Analysis (2019-2028) by Volume (Thousand Metric Tons) and Value (USD Million)
- Chart 150: Rest of Asia-Pacific Polyoxymethylene (POM) Market Analysis (2019-2028) by End-use Application - Automotive & Transportation, Electrical & Electronics, Industrial, Consumer Goods, Appliances and Other in Thousand Metric Tons
- Chart 151: Glance at 2019, 2022 and 2028 Rest of Asia-Pacific Polyoxymethylene (POM) Volume Market Share (%) by End-use Application - Automotive & Transportation, Electrical & Electronics, Industrial, Consumer Goods, Appliances and Other
- Chart 152: Rest of Asia-Pacific Polyoxymethylene (POM) Market Analysis (2019-2028) by End-use Application - Automotive & Transportation, Electrical & Electronics, Industrial, Consumer Goods, Appliances and Other in USD Million
- Chart 153: Glance at 2019, 2022 and 2028 Rest of Asia-Pacific Polyoxymethylene (POM) Value Market Share (%) by End-use Application - Automotive & Transportation, Electrical & Electronics, Industrial, Consumer Goods, Appliances and Other
SOUTH AMERICA
- Chart 154: South America Polyoxymethylene (POM) Market Analysis (2019-2028) by Volume (Thousand Metric Tons) and Value (USD Million)
- Chart 155: South America Polyoxymethylene (POM) Market Analysis (2019-2028) by Geographic Region - Argentina, Brazil and Rest of South America in Thousand Metric Tons
- Chart 156: Glance at 2019, 2022 and 2028 South America Polyoxymethylene (POM) Volume Market Share (%) by Geographic Region - Argentina, Brazil and Rest of South America
- Chart 157: South America Polyoxymethylene (POM) Market Analysis (2019-2028) by Geographic Region - Argentina, Brazil and Rest of South America in USD Million
- Chart 158: Glance at 2019, 2022 and 2028 South America Polyoxymethylene (POM) Value Market Share (%) by Geographic Region - Argentina, Brazil and Rest of South America
- Chart 159: South America Polyoxymethylene (POM) Market Analysis (2019-2028) by End-use Application - Automotive & Transportation, Electrical & Electronics, Industrial, Consumer Goods, Appliances and Other in Thousand Metric Tons
- Chart 160: Glance at 2019, 2022 and 2028 South America Polyoxymethylene (POM) Volume Market Share (%) by End-use Application - Automotive & Transportation, Electrical & Electronics, Industrial, Consumer Goods, Appliances and Other
- Chart 161: South America Polyoxymethylene (POM) Market Analysis (2019-2028) by End-use Application - Automotive & Transportation, Electrical & Electronics, Industrial, Consumer Goods, Appliances and Other in USD Million
- Chart 162: Glance at 2019, 2022 and 2028 South America Polyoxymethylene (POM) Value Market Share (%) by End-use Application - Automotive & Transportation, Electrical & Electronics, Industrial, Consumer Goods, Appliances and Other
Argentina
- Chart 163: Argentina Polyoxymethylene (POM) Market Analysis (2019-2028) by Volume (Thousand Metric Tons) and Value (USD Million)
- Chart 164: Argentina Polyoxymethylene (POM) Market Analysis (2019-2028) by End-use Application - Automotive & Transportation, Industrial and Other in Thousand Metric Tons
- Chart 165: Glance at 2019, 2022 and 2028 Argentina Polyoxymethylene (POM) Volume Market Share (%) by End-use Application - Automotive & Transportation, Industrial and Other
- Chart 166: Argentina Polyoxymethylene (POM) Market Analysis (2019-2028) by End-use Application - Automotive & Transportation, Industrial and Other in USD Million
- Chart 167: Glance at 2019, 2022 and 2028 Argentina Polyoxymethylene (POM) Value Market Share (%) by End-use Application - Automotive & Transportation, Industrial and Other
Brazil
- Chart 168: Brazil Polyoxymethylene (POM) Market Analysis (2019-2028) by Volume (Thousand Metric Tons) and Value (USD Million)
- Chart 169: Brazil Polyoxymethylene (POM) Market Analysis (2019-2028) by End-use Application - Automotive & Transportation, Electrical & Electronics, Industrial, Consumer Goods, Appliances and Other in Thousand Metric Tons
- Chart 170: Glance at 2019, 2022 and 2028 Brazil Polyoxymethylene (POM) Volume Market Share (%) by End-use Application - Automotive & Transportation, Electrical & Electronics, Industrial, Consumer Goods, Appliances and Other
- Chart 171: Brazil Polyoxymethylene (POM) Market Analysis (2019-2028) by End-use Application - Automotive & Transportation, Electrical & Electronics, Industrial, Consumer Goods, Appliances and Other in USD Million
- Chart 172: Glance at 2019, 2022 and 2028 Brazil Polyoxymethylene (POM) Value Market Share (%) by End-use Application - Automotive & Transportation, Electrical & Electronics, Industrial, Consumer Goods, Appliances and Other
Rest of South America
- Chart 173: Rest of South America Polyoxymethylene (POM) Market Analysis (2019-2028) by Volume (Thousand Metric Tons) and Value (USD Million)
- Chart 174: Rest of South America Polyoxymethylene (POM) Market Analysis (2019-2028) by End-use Application - Automotive & Transportation, Industrial and Other in Thousand Metric Tons
- Chart 175: Glance at 2019, 2022 and 2028 Rest of South America Polyoxymethylene (POM) Volume Market Share (%) by End-use Application - Automotive & Transportation, Industrial and Other
- Chart 176: Rest of South America Polyoxymethylene (POM) Market Analysis (2019-2028) by End-use Application - Automotive & Transportation, Industrial and Other in USD Million
- Chart 177: Glance at 2019, 2022 and 2028 Rest of South America Polyoxymethylene (POM) Value Market Share (%) by End-use Application - Automotive & Transportation, Industrial and Other
REST OF WORLD
- Chart 178: Rest of World Polyoxymethylene (POM) Market Analysis (2019-2028) by Volume (Thousand Metric Tons) and Value (USD Million)
- Chart 179: Rest of World Polyoxymethylene (POM) Market Analysis (2019-2028) by Geographic Region - Middle East and Africa in Thousand Metric Tons
- Chart 180: Glance at 2019, 2022 and 2028 Rest of World Polyoxymethylene (POM) Volume Market Share (%) by Geographic Region - Middle East and Africa
- Chart 181: Rest of World Polyoxymethylene (POM) Market Analysis (2019-2028) by Geographic Region - Middle East and Africa in USD Million
- Chart 182: Glance at 2019, 2022 and 2028 Rest of World Polyoxymethylene (POM) Value Market Share (%) by Geographic Region - Middle East and Africa
- Chart 183: Rest of World Polyoxymethylene (POM) Market Analysis (2019-2028) by End-use Application - Automotive & Transportation, Electrical & Electronics, Industrial, Consumer Goods, Appliances and Other in Thousand Metric Tons
- Chart 184: Glance at 2019, 2022 and 2028 Rest of World Polyoxymethylene (POM) Volume Market Share (%) by End-use Application - Automotive & Transportation, Electrical & Electronics, Industrial, Consumer Goods, Appliances and Other
- Chart 185: Rest of World Polyoxymethylene (POM) Market Analysis (2019-2028) by End-use Application - Automotive & Transportation, Electrical & Electronics, Industrial, Consumer Goods, Appliances and Other in USD Million
- Chart 186: Glance at 2019, 2022 and 2028 Rest of World Polyoxymethylene (POM) Value Market Share (%) by End-use Application - Automotive & Transportation, Electrical & Electronics, Industrial, Consumer Goods, Appliances and Other
Middle East
- Chart 187: Middle East Polyoxymethylene (POM) Market Analysis (2019-2028) by Volume (Thousand Metric Tons) and Value (USD Million)
- Chart 188: Middle East Polyoxymethylene (POM) Market Analysis (2019-2028) by End-use Application - Automotive & Transportation, Electrical & Electronics, Industrial, Consumer Goods, Appliances and Other in Thousand Metric Tons
- Chart 189: Glance at 2019, 2022 and 2028 Middle East Polyoxymethylene (POM) Volume Market Share (%) by End-use Application - Automotive & Transportation, Electrical & Electronics, Industrial, Consumer Goods, Appliances and Other
- Chart 190: Middle East Polyoxymethylene (POM) Market Analysis (2019-2028) by End-use Application - Automotive & Transportation, Electrical & Electronics, Industrial, Consumer Goods, Appliances and Other in USD Million
- Chart 191: Glance at 2019, 2022 and 2028 Middle East Polyoxymethylene (POM) Value Market Share (%) by End-use Application - Automotive & Transportation, Electrical & Electronics, Industrial, Consumer Goods, Appliances and Other
Africa
- Chart 192: Africa Polyoxymethylene (POM) Market Analysis (2019-2028) by Volume (Thousand Metric Tons) and Value (USD Million)
- Chart 193: Africa Polyoxymethylene (POM) Market Analysis (2019-2028) by End-use Application - Automotive & Transportation, Electrical & Electronics, Industrial, Consumer Goods & Appliances and Other in Thousand Metric Tons
- Chart 194: Glance at 2019, 2022 and 2028 Africa Polyoxymethylene (POM) Volume Market Share (%) by End-use Application - Automotive & Transportation, Electrical & Electronics, Industrial, Consumer Goods & Appliances and Other
- Chart 195: Africa Polyoxymethylene (POM) Market Analysis (2019-2028) by End-use Application - Automotive & Transportation, Electrical & Electronics, Industrial, Consumer Goods & Appliances and Other in USD Million
- Chart 196: Glance at 2019, 2022 and 2028 Africa Polyoxymethylene (POM) Value Market Share (%) by End-use Application - Automotive & Transportation, Electrical & Electronics, Industrial, Consumer Goods & Appliances and Other
Tables:
- Table 1: Global Polyoxymethylene (POM) Resin Production Capacity (2022-2026) by Company in Metric Tons/Year
- Table 2: Global Polyoxymethylene (POM) Resin Production Capacity (2022-2026) by Geographic Region in Metric Tons/Year
- Table 3: Global Polyoxymethylene (POM) Resin Production Capacity (2022-2026) by Country in Metric Tons/Year
- Table 4: North American Polyoxymethylene (POM) Resin Production Capacity by Company in Metric Tons
- Table 5: European Polyoxymethylene (POM) Resin Production Capacity by Company in Metric Tons
- Table 6: Asia-Pacific Polyoxymethylene (POM) Resin Production Capacity by Company in Metric Tons