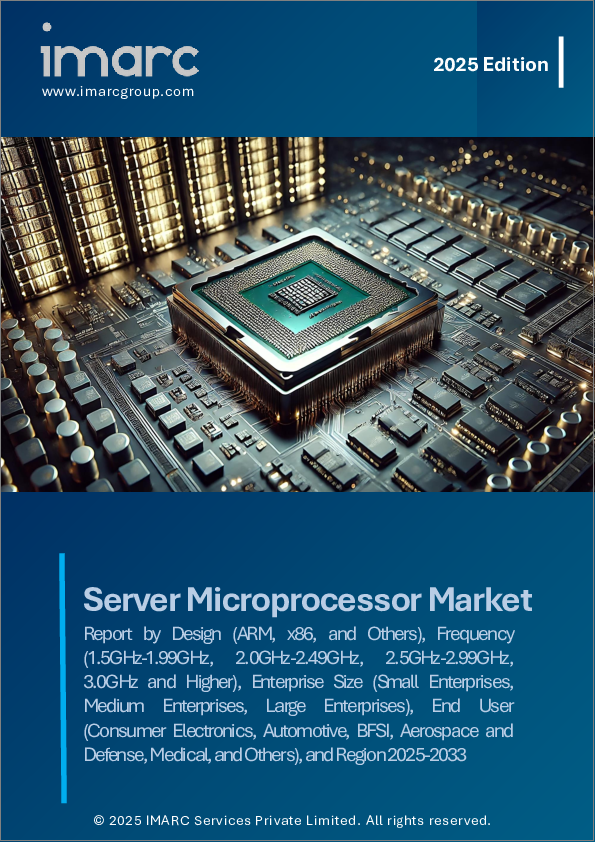
デフォルト表紙
市場調査レポート
商品コード
1561494

サーバー用マイクロプロセッサ市場レポート:設計、周波数、企業規模、エンドユーザー、地域別、2024年~2032年

Server Microprocessor Market Report by Design, Frequency, Enterprise Size, End User, and Region 2024-2032

出版日: | 発行: IMARC | ページ情報: 英文 141 Pages | 納期: 2~3営業日

● お客様のご希望に応じて、既存データの加工や未掲載情報(例:国別セグメント)の追加などの対応が可能です。  詳細はお問い合わせください。

価格
価格表記: USDを日本円(税抜)に換算
本日の銀行送金レート: 1USD=152.86円
サーバー用マイクロプロセッサ市場レポート:設計、周波数、企業規模、エンドユーザー、地域別、2024年~2032年
出版日: 2024年09月10日
発行: IMARC
ページ情報: 英文 141 Pages
納期: 2~3営業日
  • 全表示
  • 概要
  • 図表
  • 目次
概要

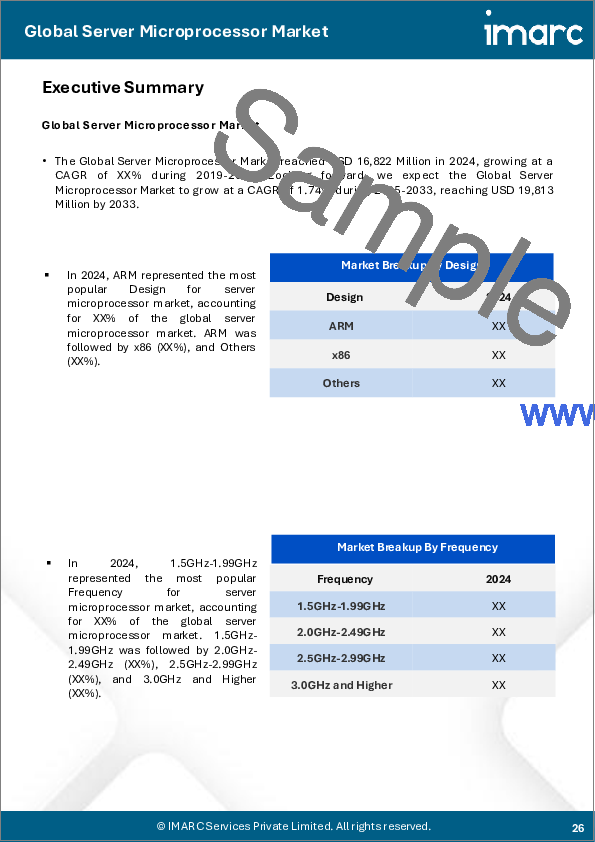
世界のサーバー用マイクロプロセッサの市場の市場規模は2023年に165億米ドルに達しました。今後、IMARC Groupは、市場は2032年までに195億米ドルに達し、2024年から2032年の間に1.8%の成長率(CAGR)を示すと予測しています。

サーバー用マイクロプロセッサーは、分析的な意思決定に役立つ中央処理装置(CPU)です。より高い周波数で機能する強力なプロセッサで構成され、メモリやその他のサブシステムでのデータ処理を可能にします。仮想環境にマルチタスク性能を提供し、シャットダウンやクラッシュ時の障害を克服するのに役立ちます。また、複数のコア、スレッド、プロセッサーをサポートし、全体的なパフォーマンス・レベルを維持します。このほか、複数のディスクを挿入できる大容量のストレージを備えているため、世界中で需要が高まっています。

サーバー用マイクロプロセッサの市場動向:

情報技術(IT)産業の隆盛は、市場の成長を強化する重要な要因のひとつです。これとは別に、クラウドベースのサービスのメリットに対する認識が高まるにつれて、世界中でクラウドベースのサービスに対する需要が高まっており、これが市場の成長に寄与しています。これらの利点には、セキュリティとモビリティの向上、コスト削減、コラボレーションの強化、災害復旧、損失防止、ソフトウェアの自動更新、競合優位性、持続可能性などが含まれます。さらに、フェイスブック、ユーチューブ、ツイッターなど、ユーザーベースのオンライン・サービスが大幅に増加しており、その結果、個人データを集中システムに保存し、大規模なサーバーを採用するデータセンターの数が増加しています。これに加え、世界のサーバーとデータセンターのニーズの高まりに対応するための研究開発活動への継続的な資金投入が、市場の見通しを良好なものにしています。さらに、市場をリードする企業は、革新的な製品を発売するために技術提携を拡大しています。また、データ分析、機械学習(ML)、人工知能(AI)などの先進技術を取り入れて設計を改善しており、これが市場成長の原動力になっていると予想されます。

本レポートで扱う主な質問

  • 世界のサーバー用マイクロプロセッサの市場はこれまでどのように推移し、今後どのように推移するのか?
  • COVID-19は世界のサーバー用マイクロプロセッサの市場にどのような影響を与えているか?
  • 主要地域市場とは?
  • 設計に基づく市場内訳は?
  • 周波数別の市場内訳は?
  • 企業規模別の市場内訳は?
  • エンドユーザー別の市場内訳は?
  • 業界のバリューチェーンにおける様々な段階とは?
  • 業界の主要な促進要因と課題は何か?
  • 世界のサーバー用マイクロプロセッサの市場の構造と主要プレーヤーは?
  • 業界の競合の程度は?

目次

第1章 序文

第2章 調査範囲と調査手法

  • 調査の目的
  • ステークホルダー
  • データソース
    • 一次情報
    • 二次情報
  • 市場推定
    • ボトムアップアプローチ
    • トップダウンアプローチ
  • 調査手法

第3章 エグゼクティブサマリー

第4章 イントロダクション

  • 概要
  • 主要業界動向

第5章 世界のサーバー用マイクロプロセッサ市場

  • 市場概要
  • 市場実績
  • COVID-19の影響
  • 市場予測

第6章 市場内訳:設計別

  • ARM
    • 市場動向
    • 市場予測
  • x86
    • 市場動向
    • 市場予測
  • その他
    • 市場動向
    • 市場予測

第7章 市場内訳:周波数別

  • 1.5GHz-1.99GHz
    • 市場動向
    • 市場予測
  • 2.0GHz-2.49GHz
    • 市場動向
    • 市場予測
  • 2.5GHz-2.99GHz
    • 市場動向
    • 市場予測
  • 3.0GHz以上
    • 市場動向
    • 市場予測

第8章 市場内訳:企業規模別

  • 中小企業
    • 市場動向
    • 市場予測
  • 中規模企業
    • 市場動向
    • 市場予測
  • 大企業
    • 市場動向
    • 市場予測

第9章 市場内訳:エンドユーザー別

  • 家電
    • 市場動向
    • 市場予測
  • 自動車
    • 市場動向
    • 市場予測
  • BFSI
    • 市場動向
    • 市場予測
  • 航空宇宙および防衛
    • 市場動向
    • 市場予測
  • 医療
    • 市場動向
    • 市場予測
  • その他
    • 市場動向
    • 市場予測

第10章 市場内訳:地域別

  • 北米
    • 米国
    • カナダ
  • アジア太平洋地域
    • 中国
    • 日本
    • インド
    • 韓国
    • オーストラリア
    • インドネシア
    • その他
  • 欧州
    • ドイツ
    • フランス
    • 英国
    • イタリア
    • スペイン
    • ロシア
    • その他
  • ラテンアメリカ
    • ブラジル
    • メキシコ
    • その他
  • 中東・アフリカ
    • 市場動向
    • 市場内訳:国別
    • 市場予測

第11章 SWOT分析

  • 概要
  • 強み
  • 弱み
  • 機会
  • 脅威

第12章 バリューチェーン分析

第13章 ポーターのファイブフォース分析

  • 概要
  • 買い手の交渉力
  • 供給企業の交渉力
  • 競合の程度
  • 新規参入業者の脅威
  • 代替品の脅威

第14章 価格分析

第15章 競合情勢

  • 市場構造
  • 主要企業
  • 主要企業のプロファイル
    • Advanced Micro Devices Inc.
    • Baikal Electronics JSC
    • HiSilicon(Shanghai)Technologies Co. Ltd.(Huawei Technologies Co. Ltd.)
    • Intel Corporation
    • International Business Machines Corporation
    • MACOM Technology Solutions
    • MediaTek Inc.
    • NVIDIA Corporation
    • Oracle Corporation
    • Qualcomm Incorporated
    • Texas Instruments Incorporated
    • Toshiba Corporation
図表

List of Figures

  • Figure 1: Global: Server Microprocessor Market: Major Drivers and Challenges
  • Figure 2: Global: Server Microprocessor Market: Sales Value (in Billion US$), 2018-2023
  • Figure 3: Global: Server Microprocessor Market Forecast: Sales Value (in Billion US$), 2024-2032
  • Figure 4: Global: Server Microprocessor Market: Breakup by Design (in %), 2023
  • Figure 5: Global: Server Microprocessor Market: Breakup by Frequency (in %), 2023
  • Figure 6: Global: Server Microprocessor Market: Breakup by Enterprise Size (in %), 2023
  • Figure 7: Global: Server Microprocessor Market: Breakup by End User (in %), 2023
  • Figure 8: Global: Server Microprocessor Market: Breakup by Region (in %), 2023
  • Figure 9: Global: Server Microprocessor (ARM) Market: Sales Value (in Million US$), 2018 & 2023
  • Figure 10: Global: Server Microprocessor (ARM) Market Forecast: Sales Value (in Million US$), 2024-2032
  • Figure 11: Global: Server Microprocessor (x86) Market: Sales Value (in Million US$), 2018 & 2023
  • Figure 12: Global: Server Microprocessor (x86) Market Forecast: Sales Value (in Million US$), 2024-2032
  • Figure 13: Global: Server Microprocessor (Other Designs) Market: Sales Value (in Million US$), 2018 & 2023
  • Figure 14: Global: Server Microprocessor (Other Designs) Market Forecast: Sales Value (in Million US$), 2024-2032
  • Figure 15: Global: Server Microprocessor (1.5GHz-1.99GHz) Market: Sales Value (in Million US$), 2018 & 2023
  • Figure 16: Global: Server Microprocessor (1.5GHz-1.99GHz) Market Forecast: Sales Value (in Million US$), 2024-2032
  • Figure 17: Global: Server Microprocessor (2.0GHz-2.49GHz) Market: Sales Value (in Million US$), 2018 & 2023
  • Figure 18: Global: Server Microprocessor (2.0GHz-2.49GHz) Market Forecast: Sales Value (in Million US$), 2024-2032
  • Figure 19: Global: Server Microprocessor (2.5GHz-2.99GHz) Market: Sales Value (in Million US$), 2018 & 2023
  • Figure 20: Global: Server Microprocessor (2.5GHz-2.99GHz) Market Forecast: Sales Value (in Million US$), 2024-2032
  • Figure 21: Global: Server Microprocessor (3.0GHz and Higher) Market: Sales Value (in Million US$), 2018 & 2023
  • Figure 22: Global: Server Microprocessor (3.0GHz and Higher) Market Forecast: Sales Value (in Million US$), 2024-2032
  • Figure 23: Global: Server Microprocessor (Small Enterprises) Market: Sales Value (in Million US$), 2018 & 2023
  • Figure 24: Global: Server Microprocessor (Small Enterprises) Market Forecast: Sales Value (in Million US$), 2024-2032
  • Figure 25: Global: Server Microprocessor (Medium Enterprises) Market: Sales Value (in Million US$), 2018 & 2023
  • Figure 26: Global: Server Microprocessor (Medium Enterprises) Market Forecast: Sales Value (in Million US$), 2024-2032
  • Figure 27: Global: Server Microprocessor (Large Enterprises) Market: Sales Value (in Million US$), 2018 & 2023
  • Figure 28: Global: Server Microprocessor (Large Enterprises) Market Forecast: Sales Value (in Million US$), 2024-2032
  • Figure 29: Global: Server Microprocessor (Consumer Electronics) Market: Sales Value (in Million US$), 2018 & 2023
  • Figure 30: Global: Server Microprocessor (Consumer Electronics) Market Forecast: Sales Value (in Million US$), 2024-2032
  • Figure 31: Global: Server Microprocessor (Automotive) Market: Sales Value (in Million US$), 2018 & 2023
  • Figure 32: Global: Server Microprocessor (Automotive) Market Forecast: Sales Value (in Million US$), 2024-2032
  • Figure 33: Global: Server Microprocessor (BFSI) Market: Sales Value (in Million US$), 2018 & 2023
  • Figure 34: Global: Server Microprocessor (BFSI) Market Forecast: Sales Value (in Million US$), 2024-2032
  • Figure 35: Global: Server Microprocessor (Aerospace and Defense) Market: Sales Value (in Million US$), 2018 & 2023
  • Figure 36: Global: Server Microprocessor (Aerospace and Defense) Market Forecast: Sales Value (in Million US$), 2024-2032
  • Figure 37: Global: Server Microprocessor (Medical) Market: Sales Value (in Million US$), 2018 & 2023
  • Figure 38: Global: Server Microprocessor (Medical) Market Forecast: Sales Value (in Million US$), 2024-2032
  • Figure 39: Global: Server Microprocessor (Other End Users) Market: Sales Value (in Million US$), 2018 & 2023
  • Figure 40: Global: Server Microprocessor (Other End Users) Market Forecast: Sales Value (in Million US$), 2024-2032
  • Figure 41: North America: Server Microprocessor Market: Sales Value (in Million US$), 2018 & 2023
  • Figure 42: North America: Server Microprocessor Market Forecast: Sales Value (in Million US$), 2024-2032
  • Figure 43: United States: Server Microprocessor Market: Sales Value (in Million US$), 2018 & 2023
  • Figure 44: United States: Server Microprocessor Market Forecast: Sales Value (in Million US$), 2024-2032
  • Figure 45: Canada: Server Microprocessor Market: Sales Value (in Million US$), 2018 & 2023
  • Figure 46: Canada: Server Microprocessor Market Forecast: Sales Value (in Million US$), 2024-2032
  • Figure 47: Asia-Pacific: Server Microprocessor Market: Sales Value (in Million US$), 2018 & 2023
  • Figure 48: Asia-Pacific: Server Microprocessor Market Forecast: Sales Value (in Million US$), 2024-2032
  • Figure 49: China: Server Microprocessor Market: Sales Value (in Million US$), 2018 & 2023
  • Figure 50: China: Server Microprocessor Market Forecast: Sales Value (in Million US$), 2024-2032
  • Figure 51: Japan: Server Microprocessor Market: Sales Value (in Million US$), 2018 & 2023
  • Figure 52: Japan: Server Microprocessor Market Forecast: Sales Value (in Million US$), 2024-2032
  • Figure 53: India: Server Microprocessor Market: Sales Value (in Million US$), 2018 & 2023
  • Figure 54: India: Server Microprocessor Market Forecast: Sales Value (in Million US$), 2024-2032
  • Figure 55: South Korea: Server Microprocessor Market: Sales Value (in Million US$), 2018 & 2023
  • Figure 56: South Korea: Server Microprocessor Market Forecast: Sales Value (in Million US$), 2024-2032
  • Figure 57: Australia: Server Microprocessor Market: Sales Value (in Million US$), 2018 & 2023
  • Figure 58: Australia: Server Microprocessor Market Forecast: Sales Value (in Million US$), 2024-2032
  • Figure 59: Indonesia: Server Microprocessor Market: Sales Value (in Million US$), 2018 & 2023
  • Figure 60: Indonesia: Server Microprocessor Market Forecast: Sales Value (in Million US$), 2024-2032
  • Figure 61: Others: Server Microprocessor Market: Sales Value (in Million US$), 2018 & 2023
  • Figure 62: Others: Server Microprocessor Market Forecast: Sales Value (in Million US$), 2024-2032
  • Figure 63: Europe: Server Microprocessor Market: Sales Value (in Million US$), 2018 & 2023
  • Figure 64: Europe: Server Microprocessor Market Forecast: Sales Value (in Million US$), 2024-2032
  • Figure 65: Germany: Server Microprocessor Market: Sales Value (in Million US$), 2018 & 2023
  • Figure 66: Germany: Server Microprocessor Market Forecast: Sales Value (in Million US$), 2024-2032
  • Figure 67: France: Server Microprocessor Market: Sales Value (in Million US$), 2018 & 2023
  • Figure 68: France: Server Microprocessor Market Forecast: Sales Value (in Million US$), 2024-2032
  • Figure 69: United Kingdom: Server Microprocessor Market: Sales Value (in Million US$), 2018 & 2023
  • Figure 70: United Kingdom: Server Microprocessor Market Forecast: Sales Value (in Million US$), 2024-2032
  • Figure 71: Italy: Server Microprocessor Market: Sales Value (in Million US$), 2018 & 2023
  • Figure 72: Italy: Server Microprocessor Market Forecast: Sales Value (in Million US$), 2024-2032
  • Figure 73: Spain: Server Microprocessor Market: Sales Value (in Million US$), 2018 & 2023
  • Figure 74: Spain: Server Microprocessor Market Forecast: Sales Value (in Million US$), 2024-2032
  • Figure 75: Russia: Server Microprocessor Market: Sales Value (in Million US$), 2018 & 2023
  • Figure 76: Russia: Server Microprocessor Market Forecast: Sales Value (in Million US$), 2024-2032
  • Figure 77: Others: Server Microprocessor Market: Sales Value (in Million US$), 2018 & 2023
  • Figure 78: Others: Server Microprocessor Market Forecast: Sales Value (in Million US$), 2024-2032
  • Figure 79: Latin America: Server Microprocessor Market: Sales Value (in Million US$), 2018 & 2023
  • Figure 80: Latin America: Server Microprocessor Market Forecast: Sales Value (in Million US$), 2024-2032
  • Figure 81: Brazil: Server Microprocessor Market: Sales Value (in Million US$), 2018 & 2023
  • Figure 82: Brazil: Server Microprocessor Market Forecast: Sales Value (in Million US$), 2024-2032
  • Figure 83: Mexico: Server Microprocessor Market: Sales Value (in Million US$), 2018 & 2023
  • Figure 84: Mexico: Server Microprocessor Market Forecast: Sales Value (in Million US$), 2024-2032
  • Figure 85: Others: Server Microprocessor Market: Sales Value (in Million US$), 2018 & 2023
  • Figure 86: Others: Server Microprocessor Market Forecast: Sales Value (in Million US$), 2024-2032
  • Figure 87: Middle East and Africa: Server Microprocessor Market: Sales Value (in Million US$), 2018 & 2023
  • Figure 88: Middle East and Africa: Server Microprocessor Market: Breakup by Country (in %), 2023
  • Figure 89: Middle East and Africa: Server Microprocessor Market Forecast: Sales Value (in Million US$), 2024-2032
  • Figure 90: Global: Server Microprocessor Industry: SWOT Analysis
  • Figure 91: Global: Server Microprocessor Industry: Value Chain Analysis
  • Figure 92: Global: Server Microprocessor Industry: Porter's Five Forces Analysis

List of Tables

  • Table 1: Global: Server Microprocessor Market: Key Industry Highlights, 2023 and 2032
  • Table 2: Global: Server Microprocessor Market Forecast: Breakup by Design (in Million US$), 2024-2032
  • Table 3: Global: Server Microprocessor Market Forecast: Breakup by Frequency (in Million US$), 2024-2032
  • Table 4: Global: Server Microprocessor Market Forecast: Breakup by Enterprise Size (in Million US$), 2024-2032
  • Table 5: Global: Server Microprocessor Market Forecast: Breakup by End User (in Million US$), 2024-2032
  • Table 6: Global: Server Microprocessor Market Forecast: Breakup by Region (in Million US$), 2024-2032
  • Table 7: Global: Server Microprocessor Market: Competitive Structure
  • Table 8: Global: Server Microprocessor Market: Key Players
目次
Product Code: SR112024A4632

The global server microprocessor market size reached US$ 16.5 Billion in 2023. Looking forward, IMARC Group expects the market to reach US$ 19.5 Billion by 2032, exhibiting a growth rate (CAGR) of 1.8% during 2024-2032.

Server microprocessor is a central processing unit (CPU) that helps in analytical decision-making. It comprises powerful processors that function at a higher frequency and allow the processing of data in memory and other subsystems. It assists in providing a multitasking performance for the virtual environment and overcoming failures in case of shutting down or crashing. It also aids in supporting multiple cores, threads, and processors to maintain the overall performance level. Besides this, as it has a large storage capacity with the ability to insert multiple disks, its demand is rising around the world.

Server Microprocessor Market Trends:

The flourishing information and technology (IT) industry represents one of the key factors strengthening the growth of the market. Apart from this, with the rising awareness about the benefits of cloud-based services, there is a rise in the demand for cloud-based services across the globe, which is contributing to market growth. These benefits include improved security and mobility, higher cost savings, increased collaboration, disaster recovery, loss prevention, automatic software updates, competitive edge, and sustainability. Additionally, there is a considerable increase in user-based online services, such as Facebook, YouTube, and Twitter, which have resulted in an increasing number of data centers that store personal data in a centralized system and employ servers on a large scale. This, along with the continuous funding on research and development (R&D) activities to address the growing needs of servers and data centers worldwide, is creating a favorable market outlook. Furthermore, leading market players are extending technology partnerships to launch innovative products. They are also incorporating advanced technologies, including data analytics, machine learning (ML), and artificial intelligence (AI), to improve their designs, which is anticipated to impel the market growth.

Key Market Segmentation:

IMARC Group provides an analysis of the key trends in each sub-segment of the global server microprocessor market report, along with forecasts at the global, regional and country level from 2024-2032. Our report has categorized the market based on design, frequency, enterprise size and end user.

Breakup by Design:

  • ARM
  • x86
  • Others

Breakup by Frequency:

  • 1.5GHz-1.99GHz
  • 2.0GHz-2.49GHz
  • 2.5GHz-2.99GHz
  • 3.0GHz and Higher

Breakup by Enterprise Size:

  • Small Enterprises
  • Medium Enterprises
  • Large Enterprises

Breakup by End User:

  • Consumer Electronics
  • Automotive
  • BFSI
  • Aerospace and Defense
  • Medical
  • Others

Breakup by Region:

  • North America
    • United States
    • Canada
  • Asia-Pacific
    • China
    • Japan
    • India
    • South Korea
    • Australia
    • Indonesia
    • Others
  • Europe
    • Germany
    • France
    • United Kingdom
    • Italy
    • Spain
    • Russia
    • Others
  • Latin America
    • Brazil
    • Mexico
    • Others
  • Middle East and Africa

Competitive Landscape:

The competitive landscape of the industry has also been examined along with the profiles of the key players being Advanced Micro Devices Inc., Baikal Electronics JSC, HiSilicon (Shanghai) Technologies Co. Ltd. (Huawei Technologies Co. Ltd.), Intel Corporation, International Business Machines Corporation, MACOM Technology Solutions, MediaTek Inc., NVIDIA Corporation, Oracle Corporation, Qualcomm Incorporated, Texas Instruments Incorporated and Toshiba Corporation.

Key Questions Answered in This Report:

  • How has the global server microprocessor market performed so far and how will it perform in the coming years?
  • What has been the impact of COVID-19 on the global server microprocessor market?
  • What are the key regional markets?
  • What is the breakup of the market based on the design?
  • What is the breakup of the market based on the frequency?
  • What is the breakup of the market based on the enterprise size?
  • What is the breakup of the market based on the end user?
  • What are the various stages in the value chain of the industry?
  • What are the key driving factors and challenges in the industry?
  • What is the structure of the global server microprocessor market and who are the key players?
  • What is the degree of competition in the industry?

Table of Contents

1 Preface

2 Scope and Methodology

  • 2.1 Objectives of the Study
  • 2.2 Stakeholders
  • 2.3 Data Sources
    • 2.3.1 Primary Sources
    • 2.3.2 Secondary Sources
  • 2.4 Market Estimation
    • 2.4.1 Bottom-Up Approach
    • 2.4.2 Top-Down Approach
  • 2.5 Forecasting Methodology

3 Executive Summary

4 Introduction

  • 4.1 Overview
  • 4.2 Key Industry Trends

5 Global Server Microprocessor Market

  • 5.1 Market Overview
  • 5.2 Market Performance
  • 5.3 Impact of COVID-19
  • 5.4 Market Forecast

6 Market Breakup by Design

  • 6.1 ARM
    • 6.1.1 Market Trends
    • 6.1.2 Market Forecast
  • 6.2 x86
    • 6.2.1 Market Trends
    • 6.2.2 Market Forecast
  • 6.3 Others
    • 6.3.1 Market Trends
    • 6.3.2 Market Forecast

7 Market Breakup by Frequency

  • 7.1 1.5GHz-1.99GHz
    • 7.1.1 Market Trends
    • 7.1.2 Market Forecast
  • 7.2 2.0GHz-2.49GHz
    • 7.2.1 Market Trends
    • 7.2.2 Market Forecast
  • 7.3 2.5GHz-2.99GHz
    • 7.3.1 Market Trends
    • 7.3.2 Market Forecast
  • 7.4 3.0GHz and Higher
    • 7.4.1 Market Trends
    • 7.4.2 Market Forecast

8 Market Breakup by Enterprise Size

  • 8.1 Small Enterprises
    • 8.1.1 Market Trends
    • 8.1.2 Market Forecast
  • 8.2 Medium Enterprises
    • 8.2.1 Market Trends
    • 8.2.2 Market Forecast
  • 8.3 Large Enterprises
    • 8.3.1 Market Trends
    • 8.3.2 Market Forecast

9 Market Breakup by End User

  • 9.1 Consumer Electronics
    • 9.1.1 Market Trends
    • 9.1.2 Market Forecast
  • 9.2 Automotive
    • 9.2.1 Market Trends
    • 9.2.2 Market Forecast
  • 9.3 BFSI
    • 9.3.1 Market Trends
    • 9.3.2 Market Forecast
  • 9.4 Aerospace and Defense
    • 9.4.1 Market Trends
    • 9.4.2 Market Forecast
  • 9.5 Medical
    • 9.5.1 Market Trends
    • 9.5.2 Market Forecast
  • 9.6 Others
    • 9.6.1 Market Trends
    • 9.6.2 Market Forecast

10 Market Breakup by Region

  • 10.1 North America
    • 10.1.1 United States
      • 10.1.1.1 Market Trends
      • 10.1.1.2 Market Forecast
    • 10.1.2 Canada
      • 10.1.2.1 Market Trends
      • 10.1.2.2 Market Forecast
  • 10.2 Asia-Pacific
    • 10.2.1 China
      • 10.2.1.1 Market Trends
      • 10.2.1.2 Market Forecast
    • 10.2.2 Japan
      • 10.2.2.1 Market Trends
      • 10.2.2.2 Market Forecast
    • 10.2.3 India
      • 10.2.3.1 Market Trends
      • 10.2.3.2 Market Forecast
    • 10.2.4 South Korea
      • 10.2.4.1 Market Trends
      • 10.2.4.2 Market Forecast
    • 10.2.5 Australia
      • 10.2.5.1 Market Trends
      • 10.2.5.2 Market Forecast
    • 10.2.6 Indonesia
      • 10.2.6.1 Market Trends
      • 10.2.6.2 Market Forecast
    • 10.2.7 Others
      • 10.2.7.1 Market Trends
      • 10.2.7.2 Market Forecast
  • 10.3 Europe
    • 10.3.1 Germany
      • 10.3.1.1 Market Trends
      • 10.3.1.2 Market Forecast
    • 10.3.2 France
      • 10.3.2.1 Market Trends
      • 10.3.2.2 Market Forecast
    • 10.3.3 United Kingdom
      • 10.3.3.1 Market Trends
      • 10.3.3.2 Market Forecast
    • 10.3.4 Italy
      • 10.3.4.1 Market Trends
      • 10.3.4.2 Market Forecast
    • 10.3.5 Spain
      • 10.3.5.1 Market Trends
      • 10.3.5.2 Market Forecast
    • 10.3.6 Russia
      • 10.3.6.1 Market Trends
      • 10.3.6.2 Market Forecast
    • 10.3.7 Others
      • 10.3.7.1 Market Trends
      • 10.3.7.2 Market Forecast
  • 10.4 Latin America
    • 10.4.1 Brazil
      • 10.4.1.1 Market Trends
      • 10.4.1.2 Market Forecast
    • 10.4.2 Mexico
      • 10.4.2.1 Market Trends
      • 10.4.2.2 Market Forecast
    • 10.4.3 Others
      • 10.4.3.1 Market Trends
      • 10.4.3.2 Market Forecast
  • 10.5 Middle East and Africa
    • 10.5.1 Market Trends
    • 10.5.2 Market Breakup by Country
    • 10.5.3 Market Forecast

11 SWOT Analysis

  • 11.1 Overview
  • 11.2 Strengths
  • 11.3 Weaknesses
  • 11.4 Opportunities
  • 11.5 Threats

12 Value Chain Analysis

13 Porters Five Forces Analysis

  • 13.1 Overview
  • 13.2 Bargaining Power of Buyers
  • 13.3 Bargaining Power of Suppliers
  • 13.4 Degree of Competition
  • 13.5 Threat of New Entrants
  • 13.6 Threat of Substitutes

14 Price Analysis

15 Competitive Landscape

  • 15.1 Market Structure
  • 15.2 Key Players
  • 15.3 Profiles of Key Players
    • 15.3.1 Advanced Micro Devices Inc.
      • 15.3.1.1 Company Overview
      • 15.3.1.2 Product Portfolio
      • 15.3.1.3 Financials
      • 15.3.1.4 SWOT Analysis
    • 15.3.2 Baikal Electronics JSC
      • 15.3.2.1 Company Overview
      • 15.3.2.2 Product Portfolio
    • 15.3.3 HiSilicon (Shanghai) Technologies Co. Ltd. (Huawei Technologies Co. Ltd.)
      • 15.3.3.1 Company Overview
      • 15.3.3.2 Product Portfolio
    • 15.3.4 Intel Corporation
      • 15.3.4.1 Company Overview
      • 15.3.4.2 Product Portfolio
      • 15.3.4.3 Financials
      • 15.3.4.4 SWOT Analysis
    • 15.3.5 International Business Machines Corporation
      • 15.3.5.1 Company Overview
      • 15.3.5.2 Product Portfolio
      • 15.3.5.3 Financials
      • 15.3.5.4 SWOT Analysis
    • 15.3.6 MACOM Technology Solutions
      • 15.3.6.1 Company Overview
      • 15.3.6.2 Product Portfolio
      • 15.3.6.3 Financials
    • 15.3.7 MediaTek Inc.
      • 15.3.7.1 Company Overview
      • 15.3.7.2 Product Portfolio
      • 15.3.7.3 Financials
      • 15.3.7.4 SWOT Analysis
    • 15.3.8 NVIDIA Corporation
      • 15.3.8.1 Company Overview
      • 15.3.8.2 Product Portfolio
      • 15.3.8.3 Financials
      • 15.3.8.4 SWOT Analysis
    • 15.3.9 Oracle Corporation
      • 15.3.9.1 Company Overview
      • 15.3.9.2 Product Portfolio
      • 15.3.9.3 Financials
      • 15.3.9.4 SWOT Analysis
    • 15.3.10 Qualcomm Incorporated
      • 15.3.10.1 Company Overview
      • 15.3.10.2 Product Portfolio
      • 15.3.10.3 Financials
      • 15.3.10.4 SWOT Analysis
    • 15.3.11 Texas Instruments Incorporated
      • 15.3.11.1 Company Overview
      • 15.3.11.2 Product Portfolio
      • 15.3.11.3 Financials
      • 15.3.11.4 SWOT Analysis
    • 15.3.12 Toshiba Corporation
      • 15.3.12.1 Company Overview
      • 15.3.12.2 Product Portfolio
      • 15.3.12.3 Financials
      • 15.3.12.4 SWOT Analysis