デフォルト表紙
市場調査レポート
商品コード
1378941

ファーマコビジランス市場:世界の産業動向、シェア、規模、成長、機会、2023-2028年予測

Pharmacovigilance Market: Global Industry Trends, Share, Size, Growth, Opportunity and Forecast 2023-2028

出版日: | 発行: IMARC | ページ情報: 英文 147 Pages | 納期: 2~3営業日

● お客様のご希望に応じて、既存データの加工や未掲載情報(例:国別セグメント)の追加などの対応が可能です。  詳細はお問い合わせください。

価格
価格表記: USDを日本円(税抜)に換算
本日の銀行送金レート: 1USD=156.53円
ファーマコビジランス市場:世界の産業動向、シェア、規模、成長、機会、2023-2028年予測
出版日: 2023年11月02日
発行: IMARC
ページ情報: 英文 147 Pages
納期: 2~3営業日
  • 全表示
  • 概要
  • 図表
  • 目次
概要

概要

世界のファーマコビジランス市場規模は2022年に73億米ドルに達しました。IMARCグループは、2022年から2028年にかけて8.8%の成長率(CAGR)を示し、2028年には121億米ドルに達すると予測しています。

ファーマコビジランス(PV)は、医薬品による好ましくない影響の検出、評価、理解、予防に関する薬理学的科学です。これまで知られていなかった副作用を特定し、頻度や重症度の変化を認識し、医薬品のリスクとベネフィットを評価して必要な措置を決定する上で極めて重要な役割を果たします。また、ヘルスケア専門家や患者に伝達される情報の正確性も保証されます。現在、PVは医薬品が個人に及ぼす影響を理解するために世界中で広く利用されています。

ファーマコビジランス市場の動向:

高血圧、糖尿病、心疾患などの生活習慣病の増加により、世界中で医薬品の消費量が増加しています。これは、医薬品副作用(ADR)の発生件数の増加と相まって、世界のファーマコビジランス市場を牽引する重要な要因の一つとなっています。これに加えて、主要企業はADR報告の自動化を確実にするために先進的なプラットフォームを導入しており、これが市場の成長に寄与しています。また、競合環境を背景に、製造業務の改善や研究開発(R&D)の効率化にも注力しています。さらに、大手製薬企業は、臨床試験を実施し、医薬品の適切な使用に関する意識を高めるために数多くの取り組みを行っています。これが、ファーマコビジランス市場の成長を促進しています。さらに、コロナウイルス感染症(COVID-19)の大流行により、ワクチンが緊急に必要とされるようになり、市場関係者に多くのビジネスチャンスをもたらしています。これとは別に、製薬メーカーはファーマコビジランス業務を第三者にアウトソーシングする方向にシフトしており、その理由としては、社内リソースの柔軟性の向上や短期間での成果の向上など、関連する利点があるためです。

本レポートで扱う主な質問

  • 世界のファーマコビジランス市場はこれまでどのように推移し、今後数年間はどのように推移するのか?
  • COVID-19が世界のファーマコビジランス市場に与えた影響は?
  • 主要な地域市場は?
  • サービスプロバイダーに基づく市場内訳は?
  • 製品ライフサイクルに基づく市場内訳は?
  • タイプ別の市場内訳は?
  • プロセスフローに基づく市場内訳は?
  • 治療領域別の市場内訳は?
  • 最終用途に基づく市場内訳は?
  • 業界のバリューチェーンにおける様々な段階とは?
  • 業界の主な促進要因と課題は何か?
  • 世界のファーマコビジランス市場の構造と主要プレーヤーは?
  • 業界の競合の程度は?

目次

第1章 序文

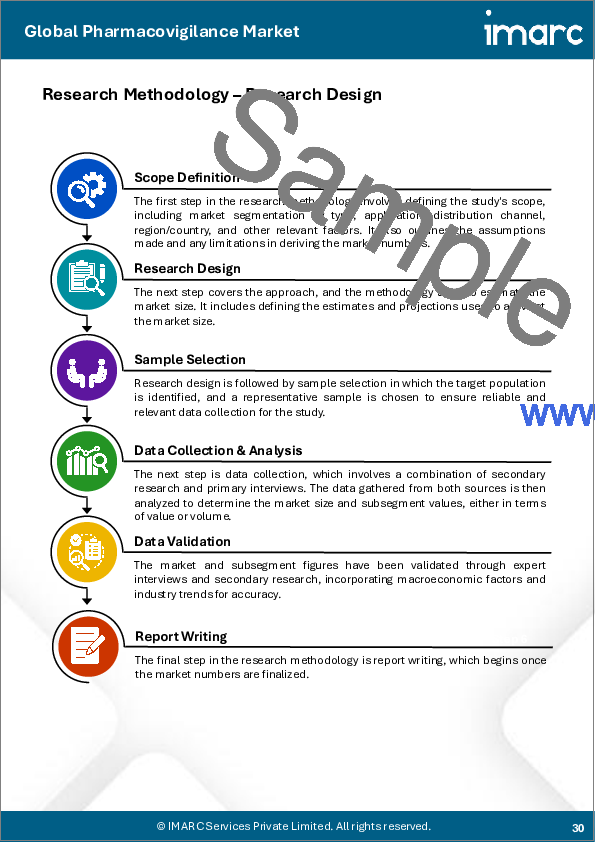
第2章 調査範囲と調査手法

  • 調査目的
  • 利害関係者
  • データソース
    • 一次情報
    • 二次情報
  • 市場推定
    • ボトムアップアプローチ
    • トップダウンアプローチ
  • 調査手法

第3章 エグゼクティブサマリー

第4章 イントロダクション

  • 概要
  • 主要産業動向

第5章 ファーマコビジランスの世界市場

  • 市場概要
  • 市場実績
  • COVID-19の影響
  • 市場予測

第6章 市場内訳:サービスプロバイダー別

  • 社内
    • 市場動向
    • 市場予測
  • アウトソーシング受託
    • 市場動向
    • 市場予測

第7章 市場内訳:製品ライフサイクル別

  • 前臨床
    • 市場動向
    • 市場予測
  • フェーズi
    • 市場動向
    • 市場予測
  • フェーズII
    • 市場動向
    • 市場予測
  • フェーズ III
    • 市場動向
    • 市場予測
  • フェーズIV
    • 市場動向
    • 市場予測

第8章 市場内訳:タイプ別

  • 自発的報告
    • 市場動向
    • 市場予測
  • ADR報告の強化
    • 市場動向
    • 市場予測
  • 自発的報告のターゲット化
    • 市場動向
    • 市場予測
  • コホートイベントモニタリング
    • 市場動向
    • 市場予測
  • EHRマイニング
    • 市場動向
    • 市場予測

第9章 市場内訳:プロセスフロー別

  • 症例データ管理
    • 市場動向
    • 主要タイプ
      • 症例ロギング
      • 症例データ分析
      • 医療レビューとレポーティング
    • 市場予測
  • シグナル検出
    • 市場動向
    • 主な種類
      • 有害事象ロギング
      • 有害事象分析
      • 有害事象のレビューと報告
    • 市場予測
  • リスク管理システム
    • 市場動向
    • 主な種類
      • リスク評価システム
      • リスク軽減システム
    • 市場予測

第10章 市場内訳:治療領域別

  • オンコロジー
    • 市場動向
    • 市場予測
  • 神経領域
    • 市場動向
    • 市場予測
  • 循環器内科
    • 市場動向
    • 市場予測
  • 呼吸器
    • 市場動向
    • 市場予測
  • その他
    • 市場動向
    • 市場予測

第11章 市場内訳:最終用途別

  • 製薬企業
    • 市場動向
    • 市場予測
  • バイオ関連企業
    • 市場動向
    • 市場予測
  • 医療機器企業
    • 市場動向
    • 市場予測
  • その他
    • 市場動向
    • 市場予測

第12章 市場内訳:地域別

  • 北米
    • 米国
      • 市場動向
      • 市場予測
    • カナダ
      • 市場動向
      • 市場予測
  • アジア太平洋
    • 中国
      • 市場動向
      • 市場予測
    • 日本
      • 市場動向
      • 市場予測
    • インド
      • 市場動向
      • 市場予測
    • 韓国
      • 市場動向
      • 市場予測
    • オーストラリア
      • 市場動向
      • 市場予測
    • インドネシア
      • 市場動向
      • 市場予測
    • その他
      • 市場動向
      • 市場予測
  • 欧州
    • ドイツ
      • 市場動向
      • 市場予測
    • フランス
      • 市場動向
      • 市場予測
    • 英国
      • 市場動向
      • 市場予測
    • イタリア
      • 市場動向
      • 市場予測
    • スペイン
      • 市場動向
      • 市場予測
    • ロシア
      • 市場動向
      • 市場予測
    • その他
      • 市場動向
      • 市場予測
  • ラテンアメリカ
    • ブラジル
      • 市場動向
      • 市場予測
    • メキシコ
      • 市場動向
      • 市場予測
    • その他
      • 市場動向
      • 市場予測
  • 中東・アフリカ地域
    • 市場動向
    • 市場内訳:国別
    • 市場予測

第13章 SWOT分析

  • 概要
  • 強み
  • 弱み
  • 機会
  • 脅威

第14章 バリューチェーン分析

第15章 ポーターのファイブフォース分析

  • 概要
  • 買い手の交渉力
  • 供給企業の交渉力
  • 競合の程度
  • 新規参入業者の脅威
  • 代替品の脅威

第16章 価格分析

第17章 競合情勢

  • 市場構造
  • 主要企業
  • 主要企業のプロファイル
    • Accenture plc
    • ArisGlobal LLC
    • BioClinica Inc.(Cinven Partners LLP)
    • Capgemini
    • Cognizant
    • International Business Machines Corporation
    • ICON plc.
    • IQVIA Inc.
    • ITClinical
    • Parexel International Corporation
    • Wipro Limited
図表

List of Figures

  • Figure 1: Global: Pharmacovigilance Market: Major Drivers and Challenges
  • Figure 2: Global: Pharmacovigilance Market: Sales Value (in Billion US$), 2017-2022
  • Figure 3: Global: Pharmacovigilance Market Forecast: Sales Value (in Billion US$), 2023-2028
  • Figure 4: Global: Pharmacovigilance Market: Breakup by Service Provider (in %), 2022
  • Figure 5: Global: Pharmacovigilance Market: Breakup by Product Life Cycle (in %), 2022
  • Figure 6: Global: Pharmacovigilance Market: Breakup by Type (in %), 2022
  • Figure 7: Global: Pharmacovigilance Market: Breakup by Process Flow (in %), 2022
  • Figure 8: Global: Pharmacovigilance Market: Breakup by Therapeutic Area (in %), 2022
  • Figure 9: Global: Pharmacovigilance Market: Breakup by End Use (in %), 2022
  • Figure 10: Global: Pharmacovigilance Market: Breakup by Region (in %), 2022
  • Figure 11: Global: Pharmacovigilance (In-house) Market: Sales Value (in Million US$), 2017 & 2022
  • Figure 12: Global: Pharmacovigilance (In-house) Market Forecast: Sales Value (in Million US$), 2023-2028
  • Figure 13: Global: Pharmacovigilance (Contract Outsourcing) Market: Sales Value (in Million US$), 2017 & 2022
  • Figure 14: Global: Pharmacovigilance (Contract Outsourcing) Market Forecast: Sales Value (in Million US$), 2023-2028
  • Figure 15: Global: Pharmacovigilance (Pre-clinical) Market: Sales Value (in Million US$), 2017 & 2022
  • Figure 16: Global: Pharmacovigilance (Pre-clinical) Market Forecast: Sales Value (in Million US$), 2023-2028
  • Figure 17: Global: Pharmacovigilance (Phase I) Market: Sales Value (in Million US$), 2017 & 2022
  • Figure 18: Global: Pharmacovigilance (Phase I) Market Forecast: Sales Value (in Million US$), 2023-2028
  • Figure 19: Global: Pharmacovigilance (Phase II) Market: Sales Value (in Million US$), 2017 & 2022
  • Figure 20: Global: Pharmacovigilance (Phase II) Market Forecast: Sales Value (in Million US$), 2023-2028
  • Figure 21: Global: Pharmacovigilance (Phase III) Market: Sales Value (in Million US$), 2017 & 2022
  • Figure 22: Global: Pharmacovigilance (Phase III) Market Forecast: Sales Value (in Million US$), 2023-2028
  • Figure 23: Global: Pharmacovigilance (Phase IV) Market: Sales Value (in Million US$), 2017 & 2022
  • Figure 24: Global: Pharmacovigilance (Phase IV) Market Forecast: Sales Value (in Million US$), 2023-2028
  • Figure 25: Global: Pharmacovigilance (Spontaneous Reporting) Market: Sales Value (in Million US$), 2017 & 2022
  • Figure 26: Global: Pharmacovigilance (Spontaneous Reporting) Market Forecast: Sales Value (in Million US$), 2023-2028
  • Figure 27: Global: Pharmacovigilance (Intensified ADR Reporting) Market: Sales Value (in Million US$), 2017 & 2022
  • Figure 28: Global: Pharmacovigilance (Intensified ADR Reporting) Market Forecast: Sales Value (in Million US$), 2023-2028
  • Figure 29: Global: Pharmacovigilance (Targeted Spontaneous Reporting) Market: Sales Value (in Million US$), 2017 & 2022
  • Figure 30: Global: Pharmacovigilance (Targeted Spontaneous Reporting) Market Forecast: Sales Value (in Million US$), 2023-2028
  • Figure 31: Global: Pharmacovigilance (Cohort Event Monitoring) Market: Sales Value (in Million US$), 2017 & 2022
  • Figure 32: Global: Pharmacovigilance (Cohort Event Monitoring) Market Forecast: Sales Value (in Million US$), 2023-2028
  • Figure 33: Global: Pharmacovigilance (EHR Mining) Market: Sales Value (in Million US$), 2017 & 2022
  • Figure 34: Global: Pharmacovigilance (EHR Mining) Market Forecast: Sales Value (in Million US$), 2023-2028
  • Figure 35: Global: Pharmacovigilance (Case Data Management) Market: Sales Value (in Million US$), 2017 & 2022
  • Figure 36: Global: Pharmacovigilance (Case Data Management) Market Forecast: Sales Value (in Million US$), 2023-2028
  • Figure 37: Global: Pharmacovigilance (Signal Detection) Market: Sales Value (in Million US$), 2017 & 2022
  • Figure 38: Global: Pharmacovigilance (Signal Detection) Market Forecast: Sales Value (in Million US$), 2023-2028
  • Figure 39: Global: Pharmacovigilance (Risk Management System) Market: Sales Value (in Million US$), 2017 & 2022
  • Figure 40: Global: Pharmacovigilance (Risk Management System) Market Forecast: Sales Value (in Million US$), 2023-2028
  • Figure 41: Global: Pharmacovigilance (Oncology) Market: Sales Value (in Million US$), 2017 & 2022
  • Figure 42: Global: Pharmacovigilance (Oncology) Market Forecast: Sales Value (in Million US$), 2023-2028
  • Figure 43: Global: Pharmacovigilance (Neurology) Market: Sales Value (in Million US$), 2017 & 2022
  • Figure 44: Global: Pharmacovigilance (Neurology) Market Forecast: Sales Value (in Million US$), 2023-2028
  • Figure 45: Global: Pharmacovigilance (Cardiology) Market: Sales Value (in Million US$), 2017 & 2022
  • Figure 46: Global: Pharmacovigilance (Cardiology) Market Forecast: Sales Value (in Million US$), 2023-2028
  • Figure 47: Global: Pharmacovigilance (Respiratory Systems) Market: Sales Value (in Million US$), 2017 & 2022
  • Figure 48: Global: Pharmacovigilance (Respiratory Systems) Market Forecast: Sales Value (in Million US$), 2023-2028
  • Figure 49: Global: Pharmacovigilance (Other Therapeutic Areas) Market: Sales Value (in Million US$), 2017 & 2022
  • Figure 50: Global: Pharmacovigilance (Other Therapeutic Areas) Market Forecast: Sales Value (in Million US$), 2023-2028
  • Figure 51: Global: Pharmacovigilance (Pharmaceuticals Companies) Market: Sales Value (in Million US$), 2017 & 2022
  • Figure 52: Global: Pharmacovigilance (Pharmaceuticals Companies) Market Forecast: Sales Value (in Million US$), 2023-2028
  • Figure 53: Global: Pharmacovigilance (Biotechnology Companies) Market: Sales Value (in Million US$), 2017 & 2022
  • Figure 54: Global: Pharmacovigilance (Biotechnology Companies) Market Forecast: Sales Value (in Million US$), 2023-2028
  • Figure 55: Global: Pharmacovigilance (Medical Device Companies) Market: Sales Value (in Million US$), 2017 & 2022
  • Figure 56: Global: Pharmacovigilance (Medical Device Companies) Market Forecast: Sales Value (in Million US$), 2023-2028
  • Figure 57: Global: Pharmacovigilance (Other End Uses) Market: Sales Value (in Million US$), 2017 & 2022
  • Figure 58: Global: Pharmacovigilance (Other End Uses) Market Forecast: Sales Value (in Million US$), 2023-2028
  • Figure 59: North America: Pharmacovigilance Market: Sales Value (in Million US$), 2017 & 2022
  • Figure 60: North America: Pharmacovigilance Market Forecast: Sales Value (in Million US$), 2023-2028
  • Figure 61: United States: Pharmacovigilance Market: Sales Value (in Million US$), 2017 & 2022
  • Figure 62: United States: Pharmacovigilance Market Forecast: Sales Value (in Million US$), 2023-2028
  • Figure 63: Canada: Pharmacovigilance Market: Sales Value (in Million US$), 2017 & 2022
  • Figure 64: Canada: Pharmacovigilance Market Forecast: Sales Value (in Million US$), 2023-2028
  • Figure 65: Asia-Pacific: Pharmacovigilance Market: Sales Value (in Million US$), 2017 & 2022
  • Figure 66: Asia-Pacific: Pharmacovigilance Market Forecast: Sales Value (in Million US$), 2023-2028
  • Figure 67: China: Pharmacovigilance Market: Sales Value (in Million US$), 2017 & 2022
  • Figure 68: China: Pharmacovigilance Market Forecast: Sales Value (in Million US$), 2023-2028
  • Figure 69: Japan: Pharmacovigilance Market: Sales Value (in Million US$), 2017 & 2022
  • Figure 70: Japan: Pharmacovigilance Market Forecast: Sales Value (in Million US$), 2023-2028
  • Figure 71: India: Pharmacovigilance Market: Sales Value (in Million US$), 2017 & 2022
  • Figure 72: India: Pharmacovigilance Market Forecast: Sales Value (in Million US$), 2023-2028
  • Figure 73: South Korea: Pharmacovigilance Market: Sales Value (in Million US$), 2017 & 2022
  • Figure 74: South Korea: Pharmacovigilance Market Forecast: Sales Value (in Million US$), 2023-2028
  • Figure 75: Australia: Pharmacovigilance Market: Sales Value (in Million US$), 2017 & 2022
  • Figure 76: Australia: Pharmacovigilance Market Forecast: Sales Value (in Million US$), 2023-2028
  • Figure 77: Indonesia: Pharmacovigilance Market: Sales Value (in Million US$), 2017 & 2022
  • Figure 78: Indonesia: Pharmacovigilance Market Forecast: Sales Value (in Million US$), 2023-2028
  • Figure 79: Others: Pharmacovigilance Market: Sales Value (in Million US$), 2017 & 2022
  • Figure 80: Others: Pharmacovigilance Market Forecast: Sales Value (in Million US$), 2023-2028
  • Figure 81: Europe: Pharmacovigilance Market: Sales Value (in Million US$), 2017 & 2022
  • Figure 82: Europe: Pharmacovigilance Market Forecast: Sales Value (in Million US$), 2023-2028
  • Figure 83: Germany: Pharmacovigilance Market: Sales Value (in Million US$), 2017 & 2022
  • Figure 84: Germany: Pharmacovigilance Market Forecast: Sales Value (in Million US$), 2023-2028
  • Figure 85: France: Pharmacovigilance Market: Sales Value (in Million US$), 2017 & 2022
  • Figure 86: France: Pharmacovigilance Market Forecast: Sales Value (in Million US$), 2023-2028
  • Figure 87: United Kingdom: Pharmacovigilance Market: Sales Value (in Million US$), 2017 & 2022
  • Figure 88: United Kingdom: Pharmacovigilance Market Forecast: Sales Value (in Million US$), 2023-2028
  • Figure 89: Italy: Pharmacovigilance Market: Sales Value (in Million US$), 2017 & 2022
  • Figure 90: Italy: Pharmacovigilance Market Forecast: Sales Value (in Million US$), 2023-2028
  • Figure 91: Spain: Pharmacovigilance Market: Sales Value (in Million US$), 2017 & 2022
  • Figure 92: Spain: Pharmacovigilance Market Forecast: Sales Value (in Million US$), 2023-2028
  • Figure 93: Russia: Pharmacovigilance Market: Sales Value (in Million US$), 2017 & 2022
  • Figure 94: Russia: Pharmacovigilance Market Forecast: Sales Value (in Million US$), 2023-2028
  • Figure 95: Others: Pharmacovigilance Market: Sales Value (in Million US$), 2017 & 2022
  • Figure 96: Others: Pharmacovigilance Market Forecast: Sales Value (in Million US$), 2023-2028
  • Figure 97: Latin America: Pharmacovigilance Market: Sales Value (in Million US$), 2017 & 2022
  • Figure 98: Latin America: Pharmacovigilance Market Forecast: Sales Value (in Million US$), 2023-2028
  • Figure 99: Brazil: Pharmacovigilance Market: Sales Value (in Million US$), 2017 & 2022
  • Figure 100: Brazil: Pharmacovigilance Market Forecast: Sales Value (in Million US$), 2023-2028
  • Figure 101: Mexico: Pharmacovigilance Market: Sales Value (in Million US$), 2017 & 2022
  • Figure 102: Mexico: Pharmacovigilance Market Forecast: Sales Value (in Million US$), 2023-2028
  • Figure 103: Others: Pharmacovigilance Market: Sales Value (in Million US$), 2017 & 2022
  • Figure 104: Others: Pharmacovigilance Market Forecast: Sales Value (in Million US$), 2023-2028
  • Figure 105: Middle East and Africa: Pharmacovigilance Market: Sales Value (in Million US$), 2017 & 2022
  • Figure 106: Middle East and Africa: Pharmacovigilance Market: Breakup by Country (in %), 2022
  • Figure 107: Middle East and Africa: Pharmacovigilance Market Forecast: Sales Value (in Million US$), 2023-2028
  • Figure 108: Global: Pharmacovigilance Industry: SWOT Analysis
  • Figure 109: Global: Pharmacovigilance Industry: Value Chain Analysis
  • Figure 110: Global: Pharmacovigilance Industry: Porter's Five Forces Analysis

List of Tables

  • Table 1: Global: Pharmacovigilance Market: Key Industry Highlights, 2022 and 2028
  • Table 2: Global: Pharmacovigilance Market Forecast: Breakup by Service Provider (in Million US$), 2023-2028
  • Table 3: Global: Pharmacovigilance Market Forecast: Breakup by Product Life Cycle (in Million US$), 2023-2028
  • Table 4: Global: Pharmacovigilance Market Forecast: Breakup by Type (in Million US$), 2023-2028
  • Table 5: Global: Pharmacovigilance Market Forecast: Breakup by Process Flow (in Million US$), 2023-2028
  • Table 6: Global: Pharmacovigilance Market Forecast: Breakup by Therapeutic Area (in Million US$), 2023-2028
  • Table 7: Global: Pharmacovigilance Market Forecast: Breakup by End Use (in Million US$), 2023-2028
  • Table 8: Global: Pharmacovigilance Market Forecast: Breakup by Region (in Million US$), 2023-2028
  • Table 9: Global: Pharmacovigilance Market: Competitive Structure
  • Table 10: Global: Pharmacovigilance Market: Key Players
目次
Product Code: SR112023A3609

Abstract

The global pharmacovigilance market size reached US$ 7.3 Billion in 2022. Looking forward, IMARC Group expects the market to reach US$ 12.1 Billion by 2028, exhibiting a growth rate (CAGR) of 8.8% during 2022-2028.

Pharmacovigilance (PV) is the pharmacological science concerning the detection, assessment, understanding and prevention of unfavorable effects with pharmaceutical products. It plays a pivotal role in identifying previously unknown adverse effects, recognizing changes in the frequency or severity, and assessing the risks and benefits of drugs to determine required actions. It also ensures the accuracy of communicated information to healthcare professionals and patients. At present, PV is widely used to understand the effects of drugs on individuals worldwide.

Pharmacovigilance Market Trends:

The increasing prevalence of lifestyle diseases, such as hypertension, diabetes, and cardiac disorders, has resulted in the rising consumption of drugs worldwide. This, in confluence with the growing incidences of adverse drug reactions (ADRs), represents one of the key factors driving the global pharmacovigilance market. Besides this, the key players are introducing advanced platforms to ensure automated ADR reporting, which is contributing to the market growth. They are also focusing on improving the manufacturing operations and streamlining research and development (R&D) on account of a competitive environment. Furthermore, leading pharmaceutical companies are undertaking numerous initiatives to conduct clinical trials and generate awareness about the proper utilization of medicines. This, in turn, is facilitating the growth of the pharmacovigilance market. Additionally, the coronavirus disease (COVID-19) outbreak has resulted in the urgent need for a vaccine, which has created numerous opportunities for the market players. Apart from this, pharmaceutical manufacturers are shifting towards outsourcing pharmacovigilance operations to third parties on account of the associated benefits, such as increasing internal resource flexibility and better outcomes over shorter periods.

Key Market Segmentation:

IMARC Group provides an analysis of the key trends in each sub-segment of the global pharmacovigilance market report, along with forecasts at the global, regional and country level from 2023-2028. Our report has categorized the market based on service provider, product life cycle, type, process flow, therapeutic area and end use.

Breakup by Service Provider:

In-house

Contract Outsourcing

Breakup by Product Life Cycle:

Pre-clinical

Phase I

Phase II

Phase III

Phase IV

Breakup by Type:

Spontaneous Reporting

Intensified ADR Reporting

Targeted Spontaneous Reporting

Cohort Event Monitoring

EHR Mining

Breakup by Process Flow:

Case Data Management

Case Logging

Case Data Analysis

Medical Reviewing and Reporting

Signal Detection

Adverse Event Logging

Adverse Event Analysis

Adverse Event Review and Reporting

Risk Management System

Risk Evaluation System

Risk Mitigation System

Breakup by Therapeutic Area:

Oncology

Neurology

Cardiology

Respiratory Systems

Others

Breakup by End Use:

Pharmaceuticals Companies

Biotechnology Companies

Medical Device Companies

Others

Breakup by Region:

North America

United States

Canada

Asia-Pacific

China

Japan

India

South Korea

Australia

Indonesia

Others

Europe

Germany

France

United Kingdom

Italy

Spain

Russia

Others

Latin America

Brazil

Mexico

Others

Middle East and Africa

Competitive Landscape:

The competitive landscape of the industry has also been examined along with the profiles of the key players being Accenture plc, ArisGlobal LLC, BioClinica Inc. (Cinven Partners LLP), Capgemini, Cognizant, International Business Machines Corporation, ICON plc., IQVIA Inc., ITClinical, Parexel International Corporation and Wipro Limited.

Key Questions Answered in This Report:

  • How has the global pharmacovigilance market performed so far and how will it perform in the coming years?
  • What has been the impact of COVID-19 on the global pharmacovigilance market?
  • What are the key regional markets?
  • What is the breakup of the market based on the service provider?
  • What is the breakup of the market based on the product life cycle?
  • What is the breakup of the market based on the type?
  • What is the breakup of the market based on the process flow?
  • What is the breakup of the market based on the therapeutic area?
  • What is the breakup of the market based on the end use?
  • What are the various stages in the value chain of the industry?
  • What are the key driving factors and challenges in the industry?
  • What is the structure of the global pharmacovigilance market and who are the key players?
  • What is the degree of competition in the industry?

Table of Contents

1 Preface

2 Scope and Methodology

  • 2.1 Objectives of the Study
  • 2.2 Stakeholders
  • 2.3 Data Sources
    • 2.3.1 Primary Sources
    • 2.3.2 Secondary Sources
  • 2.4 Market Estimation
    • 2.4.1 Bottom-Up Approach
    • 2.4.2 Top-Down Approach
  • 2.5 Forecasting Methodology

3 Executive Summary

4 Introduction

  • 4.1 Overview
  • 4.2 Key Industry Trends

5 Global Pharmacovigilance Market

  • 5.1 Market Overview
  • 5.2 Market Performance
  • 5.3 Impact of COVID-19
  • 5.4 Market Forecast

6 Market Breakup by Service Provider

  • 6.1 In-house
    • 6.1.1 Market Trends
    • 6.1.2 Market Forecast
  • 6.2 Contract Outsourcing
    • 6.2.1 Market Trends
    • 6.2.2 Market Forecast

7 Market Breakup by Product Life Cycle

  • 7.1 Pre-clinical
    • 7.1.1 Market Trends
    • 7.1.2 Market Forecast
  • 7.2 Phase I
    • 7.2.1 Market Trends
    • 7.2.2 Market Forecast
  • 7.3 Phase II
    • 7.3.1 Market Trends
    • 7.3.2 Market Forecast
  • 7.4 Phase III
    • 7.4.1 Market Trends
    • 7.4.2 Market Forecast
  • 7.5 Phase IV
    • 7.5.1 Market Trends
    • 7.5.2 Market Forecast

8 Market Breakup by Type

  • 8.1 Spontaneous Reporting
    • 8.1.1 Market Trends
    • 8.1.2 Market Forecast
  • 8.2 Intensified ADR Reporting
    • 8.2.1 Market Trends
    • 8.2.2 Market Forecast
  • 8.3 Targeted Spontaneous Reporting
    • 8.3.1 Market Trends
    • 8.3.2 Market Forecast
  • 8.4 Cohort Event Monitoring
    • 8.4.1 Market Trends
    • 8.4.2 Market Forecast
  • 8.5 EHR Mining
    • 8.5.1 Market Trends
    • 8.5.2 Market Forecast

9 Market Breakup by Process Flow

  • 9.1 Case Data Management
    • 9.1.1 Market Trends
    • 9.1.2 Major Types
      • 9.1.2.1 Case Logging
      • 9.1.2.2 Case Data Analysis
      • 9.1.2.3 Medical Reviewing and Reporting
    • 9.1.3 Market Forecast
  • 9.2 Signal Detection
    • 9.2.1 Market Trends
    • 9.2.2 Major Types
      • 9.2.2.1 Adverse Event Logging
      • 9.2.2.2 Adverse Event Analysis
      • 9.2.2.3 Adverse Event Review and Reporting
    • 9.2.3 Market Forecast
  • 9.3 Risk Management System
    • 9.3.1 Market Trends
    • 9.3.2 Major Types
      • 9.3.2.1 Risk Evaluation System
      • 9.3.2.2 Risk Mitigation System
    • 9.3.3 Market Forecast

10 Market Breakup by Therapeutic Area

  • 10.1 Oncology
    • 10.1.1 Market Trends
    • 10.1.2 Market Forecast
  • 10.2 Neurology
    • 10.2.1 Market Trends
    • 10.2.2 Market Forecast
  • 10.3 Cardiology
    • 10.3.1 Market Trends
    • 10.3.2 Market Forecast
  • 10.4 Respiratory Systems
    • 10.4.1 Market Trends
    • 10.4.2 Market Forecast
  • 10.5 Others
    • 10.5.1 Market Trends
    • 10.5.2 Market Forecast

11 Market Breakup by End Use

  • 11.1 Pharmaceuticals Companies
    • 11.1.1 Market Trends
    • 11.1.2 Market Forecast
  • 11.2 Biotechnology Companies
    • 11.2.1 Market Trends
    • 11.2.2 Market Forecast
  • 11.3 Medical Device Companies
    • 11.3.1 Market Trends
    • 11.3.2 Market Forecast
  • 11.4 Others
    • 11.4.1 Market Trends
    • 11.4.2 Market Forecast

12 Market Breakup by Region

  • 12.1 North America
    • 12.1.1 United States
      • 12.1.1.1 Market Trends
      • 12.1.1.2 Market Forecast
    • 12.1.2 Canada
      • 12.1.2.1 Market Trends
      • 12.1.2.2 Market Forecast
  • 12.2 Asia-Pacific
    • 12.2.1 China
      • 12.2.1.1 Market Trends
      • 12.2.1.2 Market Forecast
    • 12.2.2 Japan
      • 12.2.2.1 Market Trends
      • 12.2.2.2 Market Forecast
    • 12.2.3 India
      • 12.2.3.1 Market Trends
      • 12.2.3.2 Market Forecast
    • 12.2.4 South Korea
      • 12.2.4.1 Market Trends
      • 12.2.4.2 Market Forecast
    • 12.2.5 Australia
      • 12.2.5.1 Market Trends
      • 12.2.5.2 Market Forecast
    • 12.2.6 Indonesia
      • 12.2.6.1 Market Trends
      • 12.2.6.2 Market Forecast
    • 12.2.7 Others
      • 12.2.7.1 Market Trends
      • 12.2.7.2 Market Forecast
  • 12.3 Europe
    • 12.3.1 Germany
      • 12.3.1.1 Market Trends
      • 12.3.1.2 Market Forecast
    • 12.3.2 France
      • 12.3.2.1 Market Trends
      • 12.3.2.2 Market Forecast
    • 12.3.3 United Kingdom
      • 12.3.3.1 Market Trends
      • 12.3.3.2 Market Forecast
    • 12.3.4 Italy
      • 12.3.4.1 Market Trends
      • 12.3.4.2 Market Forecast
    • 12.3.5 Spain
      • 12.3.5.1 Market Trends
      • 12.3.5.2 Market Forecast
    • 12.3.6 Russia
      • 12.3.6.1 Market Trends
      • 12.3.6.2 Market Forecast
    • 12.3.7 Others
      • 12.3.7.1 Market Trends
      • 12.3.7.2 Market Forecast
  • 12.4 Latin America
    • 12.4.1 Brazil
      • 12.4.1.1 Market Trends
      • 12.4.1.2 Market Forecast
    • 12.4.2 Mexico
      • 12.4.2.1 Market Trends
      • 12.4.2.2 Market Forecast
    • 12.4.3 Others
      • 12.4.3.1 Market Trends
      • 12.4.3.2 Market Forecast
  • 12.5 Middle East and Africa
    • 12.5.1 Market Trends
    • 12.5.2 Market Breakup by Country
    • 12.5.3 Market Forecast

13 SWOT Analysis

  • 13.1 Overview
  • 13.2 Strengths
  • 13.3 Weaknesses
  • 13.4 Opportunities
  • 13.5 Threats

14 Value Chain Analysis

15 Porters Five Forces Analysis

  • 15.1 Overview
  • 15.2 Bargaining Power of Buyers
  • 15.3 Bargaining Power of Suppliers
  • 15.4 Degree of Competition
  • 15.5 Threat of New Entrants
  • 15.6 Threat of Substitutes

16 Price Analysis

17 Competitive Landscape

  • 17.1 Market Structure
  • 17.2 Key Players
  • 17.3 Profiles of Key Players
    • 17.3.1 Accenture plc
      • 17.3.1.1 Company Overview
      • 17.3.1.2 Product Portfolio
      • 17.3.1.3 Financials
      • 17.3.1.4 SWOT Analysis
    • 17.3.2 ArisGlobal LLC
      • 17.3.2.1 Company Overview
      • 17.3.2.2 Product Portfolio
    • 17.3.3 BioClinica Inc. (Cinven Partners LLP)
      • 17.3.3.1 Company Overview
      • 17.3.3.2 Product Portfolio
      • 17.3.3.3 SWOT Analysis
    • 17.3.4 Capgemini
      • 17.3.4.1 Company Overview
      • 17.3.4.2 Product Portfolio
    • 17.3.5 Cognizant
      • 17.3.5.1 Company Overview
      • 17.3.5.2 Product Portfolio
      • 17.3.5.3 Financials
      • 17.3.5.4 SWOT Analysis
    • 17.3.6 International Business Machines Corporation
      • 17.3.6.1 Company Overview
      • 17.3.6.2 Product Portfolio
      • 17.3.6.3 Financials
      • 17.3.6.4 SWOT Analysis
    • 17.3.7 ICON plc.
      • 17.3.7.1 Company Overview
      • 17.3.7.2 Product Portfolio
      • 17.3.7.3 Financials
      • 17.3.7.4 SWOT Analysis
    • 17.3.8 IQVIA Inc.
      • 17.3.8.1 Company Overview
      • 17.3.8.2 Product Portfolio
      • 17.3.8.3 Financials
      • 17.3.8.4 SWOT Analysis
    • 17.3.9 ITClinical
      • 17.3.9.1 Company Overview
      • 17.3.9.2 Product Portfolio
    • 17.3.10 Parexel International Corporation
      • 17.3.10.1 Company Overview
      • 17.3.10.2 Product Portfolio
      • 17.3.10.3 SWOT Analysis
    • 17.3.11 Wipro Limited
      • 17.3.11.1 Company Overview
      • 17.3.11.2 Product Portfolio
      • 17.3.11.3 Financials
      • 17.3.11.4 SWOT Analysis